eISSN: 2574-9927


Research Article Volume 4 Issue 2
1Department of Physics, Khulna University of Engineering & Technology, Bangladesh
2Nuclear Power Plant Company Bangladesh Limited (NPCBL), Bangladesh
3Bangladesh Council of Scientific and Industrial Research, Bangladesh
Correspondence: Shihab MT, Department of Physics, Khulna University of Engineering & Technology, Khulna, Bangladesh
Received: January 12, 2020 | Published: March 2, 2020
Citation: Shihab MT, Reza MA, Shil SK, et al. Study of crystallization phases and magnetic properties of Fe72.5Cr1 Nb3 Cu1 Si13.5B9 nanocrystalline alloy prepared by rapid quenching method. Material Sci & Eng. 2020;4(2):37-43. DOI: 10.15406/mseij.2020.04.00124
Phase constitution and soft magnetic properties of nanocrystalline alloy of composition Fe72.5Cr1Nb3Cu1Si13.5B9 prepared by single roller rapid quenching technique was investigated in this paper. The amorphous nature and the nanocrystal formation of the alloy was determined by X-ray diffraction (XRD) besides the crystallization kinetics was studied by Differential Thermal Analysis (DTA). The annealing temperature was maintained within the range 450oC to 800oC for 30minutes. DTA study reveals the existence of two exothermic peaks one for primary crystallization of phase and other for secondary crystallization of Fe2B phase. The temperature difference between two crystallization peaks is found to exist ~170oC. This large temperature gap is an indication of the enhancement of stability of phase against detrimental Fe2B phase. In the optimized annealing condition, the grain size has been obtained in the range of 10-15 nm. The saturation magnetization (Ms) has been observed 128 Am2/kg. In as-prepared condition Curie temperature (Tc) was found 316oC, close compared to the Tc of original FINEMET. Thus, a slight substitution (1 atomic %) of iron (Fe) by chromium (Cr) in original FINEMET enhances the thermo-magnetic stability of the alloy.
Keywords:FINEMET, DTA, phase, Curie temperature, saturation magnetization
XRD, X-ray diffraction; RAM, random anisotropy model; Nb, Niobium
In 1988 Yoshizawa, Oguma and Yamauchi at Hitachi Metals Ltd. developed the first nanocrystalline ultra-soft magnetic alloy called FINEMET having a composition Fe73.5Nb3Cu1Si13.5B9 by adding Copper (Cu) and Niobium (Nb) to Fe-Si-B amorphous alloys.1 This newly developed material is cost effective and exhibits splendid soft magnetic properties. The FINEMET consists of a two-phase microstructure in its optimally annealed condition. This microstructure is made up of a ferromagnetic bcc phase and/or a DO3 type of ordered Fe(Si) phase with the grain size of 10-25 nm embedded homogeneously in this residual ferromagnetic amorphous matrix. These represent a new family of excellent soft magnetic behavior: high saturation magnetization (~1.2T), low coercivity (≤1Am-1), high relative magnetic permeability (≥104) and have stimulated an enormous research activity due to their potential applications.2‒9 The formation of the particular FINEMET structure can be attributed to the combined effects of Cu and Nb and their low solubility in bcc Fe. Cu is thought to promote the nucleation of Fe(Si) grains while Nb and Boron (B) inhibit the grain growth and accelerate the formation of ferromagnetic Fe-B phases,10 which are detrimental for the soft magnetic properties. The nanoscale grain with magnetic softness can be understood in the framework of the random anisotropy model (RAM) proposed by Alben et al.11 According to the RAM, extraordinary soft magnetic properties of nanocrystalline materials arise from strong inter-granular magnetic coupling, the suppression of effective magnetocrystalline anisotropy and vanishing magnetostriction. The magnetocrystalline anisotropy vanishes when the grain size is smaller than the ferromagnetic exchange length and magnetostriction approaches zero due to the cancellation of the positive magnetostriction of crystallites and negative magnetostriction of the amorphous matrix. Effect of partial substitution of Fe with Co,12,13 Al14,15 Al-Ge,16 Ni,17 Cr-Mo18 and Cr19 have been investigated. It has been reported that the replacement of Fe by Cr enhances the thermal stability against crystallization and reduces the Curie temperature (Tc) of the amorphous phase.19 This gives the opportunity of studying the magnetic interaction in a wider temperature range between the Tc of the amorphous phase and that of the nanocrystalline phase. The magnetocrystalline Cr substituted Fe-based metallic glasses has been the subject of intensive research not only for the promising technological applications but the co-existence of various magnetic phases at an elevated temperature which make them attractive for studying basic magnetic phenomena.20‒22 The main theme of the present paper is to synthesize Fe-based alloy of Fe73.5Nb3Cu1Si13.5B9 composition in the amorphous state by using rapid quenching technique and study the formation of different phases by varying annealing temperature (Ta). The evolution of nanograins and the magnetic properties in the as-prepared condition are also investigated.
Melt spinning is a widely used production method for rapidly solidifying materials as well as preparing amorphous metallic ribbons.23‒26 In order to prepare amorphous Fe73.5Nb3Cu1Si13.5B9 alloys, the melt spinning facilities were used at the Centre for Materials Science, National University of Hanoi, Vietnam. Amorphous ribbons with the composition Fe73.5Nb3Cu1Si13.5B9 were prepared in an arc furnace on a water-cooled copper hearth under an atmosphere of pure Argon (Ar). The source materials were Fe (99.9%), Cr (99.9%), Nb (99.9%), Cu (99.9%), Si (99.9%) and B (99.9%) obtained from Johnson Matthey (Alfa Aesar Inc.). The required amounts of the constituent elements were taken from pure metal bars or flakes weighed with a sensitive electronic balance and placed on the copper hearth inside the arc furnace. The furnace chamber was first evacuated (10-4 torr) and flushed with Ar gas. The process was performed several times to remove residual air and finally, the furnace chamber was kept in an Ar atmosphere. The arc melted master alloy was crashed into small pieces and put inside the quartz tube crucible for re-melting by induction furnace using a medium frequency generator with the maximum power of 25kW at a suitable frequency of 10kHz. The molten alloy was vertically ejected onto the wheel surface. The master alloy sample was inductively remelted inside the quartz tube crucible followed by ejecting the molten metal with an overpressure of 250 mbar of 99.9% pure Ar supplied from an external reservoir through a nozzle onto a rotating copper wheel with the surface velocity of 30 m/sec. The temperature was observed by an external pyrometer from the top surface of the molten alloy through a quartz window. The metal alloys were removed at a temperature of about 150 to 250K above the melting point of the alloy to have uniform thickness and to reduce the roughness of both sides of the ribbon. The resulting ribbon samples had a thickness of about 20-25μm and a width ~6mm. Crystallization phase analysis was carried out by Differential Thermal Analysis (DTA) (SEIKO TG/DTA 6300). The crystallization activation energies for primary and secondary phases have been calculated using Kissinger’s equation:27 where β is the heating rate, Tp is the crystallization peak temperature, E is the activation energy and k is the Boltzmann’s constant. The Nanocrystalline structure has been observed by XRD (Philips (PW 3040) X ‘Pert PRO XRD) with Cu-Kα radiation. Lattice parameter (a0) was calculated from diffraction peaks in XRD patterns. Grain size (Dg) of all annealed samples was determined using the Debye-Scherrer method.28 Si contents were computed using the equation:29 , where X is at.% Si in the nano grains. Magnetic properties such as field dependent magnetization and temperature dependent magnetization were measured by a vibrating sample magnetometer (VSM) (880 DMS, USA).
Figure 1A-1F represents the DTA traces of as-cast Fe73.5Nb3Cu1Si13.5B9 alloy from room temperature to 800oC with heating rates of 10–60oC/min at the step of 10oC. In each figure, two exothermic peaks are distinctly observed; corresponding to two different crystallization events initiated at temperature Tx1 and Tx2 respectively. Figure 1 reveals that the crystallization of each phase occurs over a wide range of temperatures and the peak temperature shifts to higher values with the increase of heating rate. In other word, more heat energy is required for the formation of crystalline phases with increasing heating rates. From each of the DTA traces, it is obvious that the area under the first crystallization peak is larger than the area covered by the second crystallization peak.
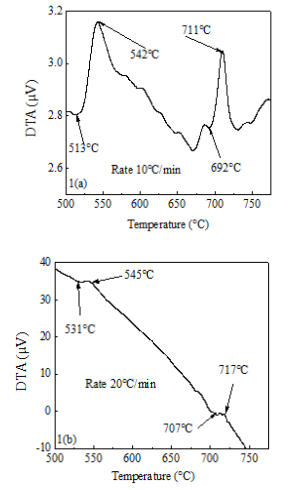
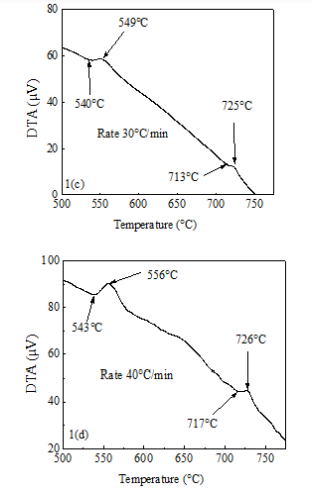
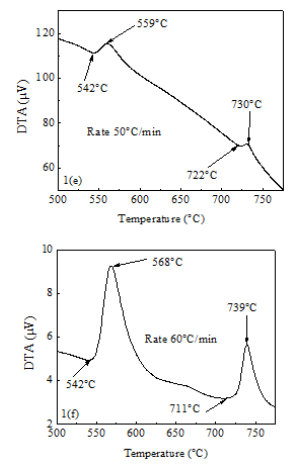
Figure 1 DTA traces of as-cast Fe72.5Cr1Nb3Cu1Si13.5B9 alloy with the heating rates of (A) 10oC/min, (B) 20oC/min, (C) 30oC/min, (D) 40oC/min, (E) 50oC/min and (F) 60oC/min.
Figure 1 also shows that the two crystallization events are separated by a large temperature gap of ~170oC. For FINEMET without Cr the temperature difference between two events was found ~150oC.30 This implies that a slight Cr-content has weakened the diffusion process to form the crystallization phases since Cr has a melting temperature (1857oC) higher than that of Fe (1536oC). The large separation between two crystallization events is one of the characteristic features of the FINEMET type-alloys, which exhibit easy nano crystallization.31 The activation energy of and Fe2B phases has been calculated using Kissinger’s plot shown in Figure 2A & 2B respectively. It shows that thermal crystallization activation energy of phase is 3.26eV and Fe2B phase is 4.87eV respectively. The activation energy for formation of phase is approximately similar to that for the original FINEMET (3.25eV).32 It is also noticed that the activation energy for first crystallization phase is lower than the second crystallization phase. This is because, at the early stage of crystallization, a formation of Cu clusters leads to low activation energy for preferential nucleation however, with the increase of crystallized volume fraction, the Cu-rich regions gradually run out.33 The data for the as-cast Fe73.5Nb3Cu1Si13.5B9 alloy with heating rates are enlisted in Table 1. DTA traces for a constant heating rate of 20°C/min of the Fe73.5Nb3Cu1Si13.5B9 alloy in the annealed state at different temperatures are shown in Figures 3A-3C. We observe from Figures 3A that as the annealing temperature (450oC) is lower than the first crystallization temperature, the onset crystallization temperature is almost unchanged with respect to its amorphous precursor. But when annealed at 550oC and 600oC which are higher than the onset of crystallization temperature of (531°C), the primary crystallization peak has completely diminished and display diffused character meaning that substantial amount of primary crystallization, phase has already been completed. The 2nd peak in Figures 3A-3C does not show any significant changes since the Ta is low compared to. Results of the DTA scan of the sample of as-cast and annealed at different temperatures are tabulated in Table 2.
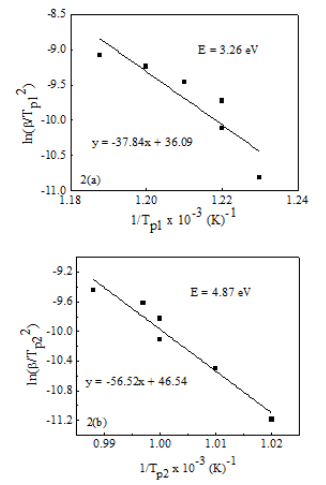
Figure 2 Kissinger’s plot to determine the activation energy of (A) phase and (B) Fe2B phase of the Fe72.5Cr1Nb3Cu1Si13.5B9 alloy.
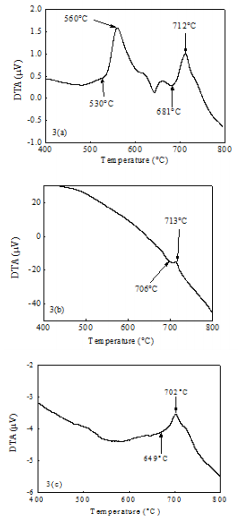
Figure 3 DTA traces of Fe72.5Cr1Nb3Cu1Si13.5B9 alloy at the heating rate of 20oC/min annealed at (A) 450oC (B) 550oC and (C) 600oC
|
Heating rate, β (0C/min) |
1st starting cc (oC) |
1st Peak TP1 ( oC) |
2nd starting TX2 (oC) |
2nd Peak TP2 (oC) |
Peak separation temperature (oC) |
Activation energy of 1st crystallization (eV) |
Activation energy of 2nd crystallization (eV) |
|
10 |
513 |
542 |
692 |
711 |
169 |
3.26 |
4.87 |
|
20 |
531 |
544 |
707 |
717 |
173 |
||
|
30 |
540 |
549 |
713 |
725 |
176 |
||
|
40 |
543 |
556 |
717 |
726 |
170 |
||
|
50 |
542 |
559 |
722 |
730 |
171 |
||
|
60 |
542 |
568 |
711 |
739 |
171 |
Table 1 Effect of heating rate on 1st and 2nd crystallization of Fe72.5Cr1Nb3Cu1Si13.5B9 alloy
|
Ta (°C) |
TX1 (°C) |
TP1 (°C) |
TX2 (°C) |
TP2 (°C) |
Peak separation temperature (°C) |
|
As-cast |
531 |
545 |
707 |
717 |
172 |
|
450 |
530 |
560 |
681 |
712 |
152 |
|
550 |
-- |
-- |
706 |
713 |
-- |
|
600 |
-- |
-- |
649 |
702 |
-- |
Table 2 Annealing effects on 1st and 2nd crystallization states of the Fe72.5Cr1Nb3Cu1Si13.5B9 alloy at a constant heating rate of 20°C/min
Structural Analysis by XRD
XRD patterns for the Fe73.5Nb3Cu1Si13.5B9 alloy as as-cast state and annealed at temperature 450, 500, 550, 600, 650, 700, 750 and 800oC each for 30 minutes are presented in Figure 4A. It is evident that the XRD patterns for the samples at as-cast state and annealed below 500oC, i.e. at 450oC, exhibit only one broad peak around 2θ = 45oC, at the position of d110 reflection which is generally referred to as diffuse hallow, indicative of an amorphous phase. This suggests that at Ta<500oC, the alloy remains amorphous. So the onset crystallization temperature determined from these results is between 450-500oC. The crystallization onset temperatures from DTA experiment for different heating rates were found in the range of 513-543oC, which shows a good consistency with the XRD results. The value of FWHM for the sample annealed at 550oC is 0.8144. With increasing Ta beyond 550oC, the FWHM value is getting smaller. It confirms that the crystallization occurs to a good extent at the higher Ta. The XRD pattern illustrated in Figure 4(a) reveals that the both the position and broadness of the (110) diffraction peak vary as the annealing temperature increases. We observe a general increase in the intensity of the diffraction peak with the annealing temperature, consistent with an increase in the crystalline volume fraction. The existence of Fe2B phase is noticed in the XRD spectra when the sample annealed above 700oC which is in agreement with the crystallization temperature obtained by DTA curves. Li-xia Wen et al.34 also reported the similar result.34 The slight shift of peak towards the lower/higher angles with increasing Ta has been noticed in the XRD spectra as shown in Figure 4B. This may be related with stress i.e., when first crystallizes at ~500oC there is stress build up, with increasing annealing temperature the stress relaxes; then it comes to a second crystallization stage at ~700oC and stress builds up again. As a result, a change in the value of a0 as well as Si-content in the phase with increasing Ta are obtained. The values of FWHM, a0 , Dg, and Si-content are enlisted in Table 3. Figure 5 shows that in the Ta range of 500 to 700oC, the grain size remains in the range of 10 to 15nm, corresponding to a soft magnetic phase. Above 700oC grain grow rapidly and attain a maximum value of 32 nm at 800oC indicating the formation of the Fe2B phase. These results suggest that within the annealing temperature range of 500-700oC, the alloy maintain its nanocrystalline structure with a nominal grain size of <15nm. Hence in order to obtain the non acrystalline alloy with optimum soft magnetic properties annealing has to be carried out within this critical temperature.
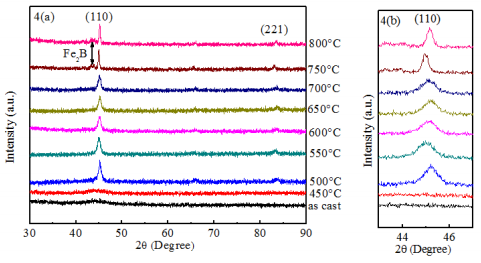
Figure 4 (A) XRD spectra of Fe72.5Cr1Nb3Cu1Si13.5B9 alloy for as cast and for different annealing temperatures (B) shifting of peak position in the XRD spectra.
|
Ta (oC) |
θ (deg.) |
d (Å) |
FWHM (deg.) |
a0 (Å) |
Dg (nm) |
Si (at. %) |
|
450 |
-- |
-- |
-- |
-- |
-- |
-- |
|
500 |
22.60 |
2.006 |
0.6585 |
2.8369 |
15 |
18 |
|
550 |
22.50 |
2.020 |
0.8144 |
2.8560 |
11 |
9 |
|
600 |
22.58 |
2.012 |
0.7278 |
2.8454 |
13 |
14 |
|
650 |
22.62 |
1.997 |
0.7162 |
2.8242 |
14 |
24 |
|
700 |
22.54 |
2.009 |
0.6871 |
2.8412 |
14 |
16 |
|
750 |
22.48 |
2.012 |
0.3175 |
2.8454 |
28 |
14 |
|
800 |
22.58 |
2.008 |
0.2946 |
2.8397 |
32 |
17 |
Table 3 Experimental XRD data of nanocrystalline Fe72.5Cr1Nb3Cu1Si13.5B9 alloy at different Ta
Temperature dependence of specific magnetization
Figure 6A shows the variation of magnetization (M) of Fe73.5Nb3Cu1Si13.5B9 alloy in the as-cast state with temperature at constant magnetic field 800 kA/m. It is clearly observed that the magnetization (M) of the sample decreases gradually at low-temperature (<300oC) and falls faster nearer to the Tc of ~316oC. The Tc has been determined as the temperature corresponding to inflection point where the rate of change of M with respect to temperature is maximum shown in Figure 6B. As the temperature approaches Tc, M falls more rapidly near to zero as the thermal energy exceeds the magnetic ordering or the exchange energy. The sharp fall of M at Tc indicates that the material is quite homogeneous from the point of amorphousity. Our measured Tc of 316oC is similar to value reported for the original FINEMET without Cr.35
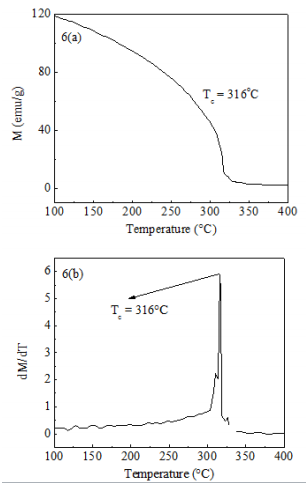
Figure 6 (A) Temperature dependence of specific magnetization (B) versus temperature curve of Fe72.5Cr1Nb3Cu1Si13.5B9 alloy.
Magnetic field dependence of magnetization
The magnetization process of the Fe73.5Nb3Cu1Si13.5B9 alloy in the as-cast state with an applied magnetic field at room temperature is shown in Figure 7. It is clearly evidenced that the magnetization saturates in the amorphous state with a very small applied field of 4×10⁴ A/m which is an indication of soft magnetic behavior. For the original FINEMET the saturation magnetization (Ms) of ~150 Am2/kg at room temperature has been reported.36 In the present study with the partial substitution of Fe magnetic moment by non-magnetic Cr, we observe that Ms decreases slightly to ~128Am2/kg.
In this work the Fe73.5Nb3Cu1Si13.5B9 alloy has been synthesized by the substitution of Fe with small amount of Cr (1 atomic %) in the original FINEMET composition. With the addition of Cr in FINEMET, we found that although the room temperature Ms decreases from ~150 to 128Am2/kg, the Tc of the sample is similar to original FINEMET. Annealing of the amorphous sample in the temperature range of 450 to 800oC reveals that the crystallization onset temperature for the phase is between 450-500oC. The phase has a nanocrystalline nature with crystallite size of <15nm. As the annealing temperature increases, this crystallite size remains relatively constant up to Ta of 700oC. Above 700oC, the crystallites coarsen considerably to 32nm. Two crystallization onsets at ~515 and 700oC are observed from DTA analysis and these onset temperatures are also found to be dependent on the heating rate during the measurement. The activation energy of the primary crystallization of phase is found to be 3.26 eV which is slightly higher than the original FINEMET. A large temperature difference of ~170oC between the two crystallization events is measured. This large temperature gap is an indication of the enhancement of stability of phase against detrimental Fe2B phase due to a slight substitution of Cr in place of Fe. Our results demonstrate that with the addition of Cr, soft magnetic nanograins in the amorphous alloy with an enhanced thermo-magnetic stability can be obtained at lower heat treatment than the original FINEMET which is good for high quality inductor applications.
The authors are highly grateful to Centre for Materials Science, National University of Hanoi, Vietnam for using their laboratory to synthesize the alloys and to Bangladesh Council of Scientific and Industrial Research (BCSIR) for giving their experimental facilities for characterization.
The authors declare that there are no conflicts of interest.

©2020 Shihab, et al. This is an open access article distributed under the terms of the, which permits unrestricted use, distribution, and build upon your work non-commercially.