Submit manuscript...
eISSN: 2574-9927

Material Science & Engineering International Journal

Research Article Volume 8 Issue 4

Polymer reinforced with nanoparticles and made using the spin coating technique: characterization and analysis

Raveendra Melavanki,1 C Siddaraju,2 T. S. Srivatsan3

1Department of Physics, M S Ramaiah Institute of Technology, India
2Department of Mechanical Engineering, M S Ramaiah Institute of Technology, India
3Department of Mechanical Engineering, The University of Akron, USA

Correspondence: T. S. Srivatsan, Department of Mechanical Engineering, The University of Akron, Akron 44325, OHIO, USA

Received: August 16, 2023 | Published: October 17, 2024

Citation: Melavanki R, Siddaraju C, Srivatsan TS. Polymer reinforced with nanoparticles and made using the spin coating technique: characterization and analysis. Material Sci & Eng. 2024;8(4):118-127. DOI: 10.15406/mseij.2024.08.00244

Download PDF

Abstract

In this research paper, thin films of polyethersulfone reinforced with different concentrations of the zinc-nickel ferrite nanoparticles [ZnNiFe] using the spin coating technique is presented and briefly discussed. The polymer chosen was polyethersulfone. Optical characterization of the test samples was carried out using different spectroscopic techniques at room temperature [25°C]. The structural properties, texture, and morphological characteristics of the as-prepared thin films were studied using the techniques of Fourier transform infrared spectroscopy [FTIR], X-ray diffraction [XRD] spectra, atomic force microscopy [AFM], and scanning electron microscopy [SEM]. The results revealed the ZnNiFe nanoparticle-reinforced polyethersulfone thin films are good candidates for selection and use in photonic applications, such as optical sensors, solar panels, and other photonic devices. In addition, both the ground state dipole moment and excited state dipole moment were determined for the polyethersulfone (PES) molecule using the solvatochromic shift method. This was essentially for developing an understanding of the charge transfer characteristics of the solute. Results of this novel study did reveal the excited state dipole moment to be observably greater than the ground state dipole moment.

Keywords: polyethersulfone, zinc-nickel ferrite nanoparticles, spin coating technology, ultra violet (UV-Vis), Scanning electron microscopy (SEM), photoluminescence, atomic force microscopy (AFM), Fourier transform infrared spectroscopy (FTIR), X-ray diffraction (XRD)

Introduction

Photonics is all about the science of light. Photonics involves a very wide range of wavelengths ranging from gamma rays to radio waves, which includes the infrared, ultra-violet (UV) and even X-rays. The science behind photonics includes the following:

(i) emission, (ii) transmission, (iii) amplification, (iv) deflection, (v) detection using optical instruments and components, (vi) lasers and other light sources, (vii) electro-optical instrumentation, and even (viii) fiber optics.

Polymers are basically organic materials in the solid form, and essentially consist of a large number of monomers that are linked to each other in a repetitive manner. In electrical engineering, the thin polymer transistors have over the years gradually improved. This has resulted in low cost thereby enabling in the development and emergence of more flexible electronics. In RF-ID [radio frequency identification] tags, the recently engineered developments are in the areas of ink-jet printing, active-matrix display, and integrated circuits. Typical material used as a dielectric organic gate consists of spin-coated polyethersulfone (PES) that is doped, or reinforced, with Zn0.5Ni0.5Fe2O4 nanoparticles. Since solid polymer electrolytes, i.e., salt dissolved in a polymer matrix, suffer from a slow polarization response, the cross-linked ultra-thin polymer films used to develop polymer ion gels have shown incredible capacitance that often exceeds that of the conventional polymer insulators and even the ceramics chosen for use in organic thin-film transistors. Some polymer films, such as the bi-axially oriented polypropylene, provide high electrical insulation. This enables them to be used as a dielectric both in capacitors and other electronic components. Also, they can be used both as a sealant and as a encapsulate. Solar cells of the next generation are currently also being fabricated and put forth using polymer thin films.

In this research study, polyethersulfone thin films are reinforced with different concentration of the zinc-nickel ferrite (Zn0.5Ni0.5Fe2O4) nanoparticles [referred to henceforth in this paper as the ZnNiFe NPS]. Optical properties of the as-prepared samples were carried out using different spectroscopic techniques at room temperature (25°C). Structural properties, texture, and morphological characteristics of the as-prepared polymer thin films were studied with the help of the following:

(i) Fourier transform infrared (FTIR) spectra, (ii) X-ray diffraction (XRD), (iii) atomic force microscope (AFM), and (iv) scanning electron microscope (SEM).1–10 Spectroscopic studies have grown both in strength and confidence to become an imperative tool for the development of novel nonlinear molecules. The ground state dipole moment and excited state dipole moment of a chosen sample were determined so as to enable in an understanding of solute-solvent interactions that tend to occur in different environments.11 Among both the existing methods and available methods, the solvatochromic method does offer a high linear correlation between the spectroscopic parameters and functions of the chosen solvent.12–16

Polyethersulfone is a nucleophilic aromatic substitution between dichloro diphenyl sulfone and sodium salt of 1,4-dihydroxybenzene. Polyethersulfone can essentially be classified to be strong polymer that is suitable for high-performance applications. Polyethersulfone is an amorphous polymer that is capable of withstanding a wide range of temperatures without experiencing a noticeable change in material properties. These polymers are dimensionally stable in the environments of laboratory air and water. Therefore, they can be processed as thin films that form the basis of this independent research study. They are essentially a transparent polymer that find selection and use in electro-optical applications, such as photovoltaic cells. Besides having excellent electrical properties, they are also chemically resistant.

Materials and methods

Material

The chemical formula of the polyethersulfone (PES) is (C12H8O3S) n, and its molecular weight is 232.26 g/mol. Polyethersulfone was acquired from TCI Chemicals [India] and had the following properties:

(i) density of 1.24g/cm3, (ii) melting point of 180°C, and (iii) refractive index of 1.615.

The molecular structure of PES is shown in Figure 1. The Zn (NO3)2, Fe (NO3)3, and ODH (Oxidative Dehydrogenation) were used for the preparation of nanoparticles.

Figure 1 Molecular structure of polyethersulfone (PES)

Preparation of nanoparticles

The ZnNiFe nanoparticles were synthesized using the solution combustion method. The following steps were taken for preparation and/or synthesis of the ZnNiFe nanoparticles.

First, we measured the required amount of Zn (NO3)2, and Fe (NO3)3.

  1. Amount of Zn (NO3)2: 2.97grams
  2. Amount of Fe (NO3)3: 08grams
  3. Amount of ODH (Oxidative Dehydrogenation): 4.7257grams

The above chemicals were thoroughly mixed in a glass beaker. The resultant solution was mixed well using a magnetic stirrer at a speed of 550 rpm and temperature of 300°C. Along with this, 25ml of distilled water was added to the solution. We did observe a flame to arise as a direct consequence of smoldering. It took approximately 20 minutes to complete the reaction.

 Doping with nickel (Ni+)

Here, we are adding Ni+ ions from the Ni nitrates of different concentration, i.e., x = 0.1, 0.3, 0.5, and 0.7, to get a different concentration of the nanoparticles. The different concentrations of the ZnFe oxides and oxidative dehydrogenation (ODH) are summarized in Table 1.

Ni-Nitrate (gm)

Fe Nitrate (gm)

Zn Nitrate (gm)

ODH (gm)

ZnNiFeO Nanoparticle

2.616

8.08

0.2974

4.722

Zn0.1Ni0.9Fe2O4

2.0346

8.08

0.8922

4.722

Zn0.3Ni0.7Fe2O4

1.4542

8.08

1.487

4.722

Zn0.5Ni0.5Fe2O4

0.8719

8.08

2.0818

4.722

Zn0.7Ni0.3Fe2O4

0.29

8.08

2.677

4.722

Zn0.9Ni0.1Fe2O4

0.29

8.08

2.677

4.722

Zn0.9Ni0.1Fe2O4

Table 1  Table of different concentration of ZnFe oxide and ODH

Production of a thin film

The ZnNiFe nanoparticles-reinforced polymer thin films were prepared using 0.5 percent of nanoparticles. To start with, the measuring beakers were thoroughly cleaned and subsequently dried in a hot air oven. Precision weighed three (3) portions of 0.10 mg of polyethersulfone (PES) granules using a weighing balance along with the following:

(i) 0.05 mg ZnNiFe (0.5%) nanoparticles, (ii) 0.10 mg ZnNiFe (0.5%) nanoparticles, and (iii) 0.15mg ZnNiFe (0.5%) nanoparticles.

The chosen portions were then mixed well in a beaker resulting in three polyethersulfone (PES) nanocomposites. An amount of 10 ml of dimethylformamide was added to the as-synthesized nanocomposites. The beaker was covered after placing a magnetic bead that was wrapped in an aluminum foil. The magnetic bead was placed on a magnetic stirrer. Temperature of the magnetic stirrer can vary between 45°C to -75°C, and speed of the magnetic stirrer was set at 700 - 900 rpm. The solution was allowed to stir for full 60 minutes. Herein, we are using the underlying concept of spin coating for preparing thin films of the chosen polymer. The spin coater [Model: EZ Spin A1 Spin Coater] housed within the research laboratory at the BMS Institute of Technology [Bangalore-560064, India] was used. The spin coater was calibrated for 10 minutes. The vacuum was switched on, the spinner was then thoroughly cleaned using acetone and then placed in the spin coater. Programing was done at a speed of 600 rpm for about 10 seconds, and the resultant outcomes saved. Three to four drops of the nanocomposite solution were allowed to gradually drip onto the glass substrate using a dipper. The spinner was then started and allowed to run very much in conformance with the program saved. This step is referred to as “Spin ON”. After 10 seconds, the spinner was turned off. This step is referred to as “Spin OFF”. The polymer thin film was then left to evaporate for about 15 minutes and subsequently placed in an air-tight container.

Solvatochromic shift method

In an attempt to understand the solute-solvent interactions and charge transfer characteristics of the solute in different environments, the electronic dipole moments of fluorophore in a liquid medium were evaluated using the equations put forth by Bilot and Kawaski.17,18 These equations are:

v ¯ a v ¯ f = m ( 1 ) F( ε, n )+ constant MathType@MTEF@5@5@+= feaagKart1ev2aqatCvAUfeBSjuyZL2yd9gzLbvyNv2CaerbuLwBLn hiov2DGi1BTfMBaeXatLxBI9gBaerbujxzIv3yOvgDG00uaerbd9wD YLwzYbItLDharqqtubsr4rNCHbGeaGqkY=MjYJH8sqFD0xXdHaVhbb f9v8qqaqFr0xc9pk0xbba9q8WqFfea0=yr0RYxir=Jbba9q8aq0=yq =He9q8qqQ8frFve9Fve9Ff0dmeaabaqaciGacaGaaeaadaabaeaafa aakeaadaqdaaqaaiaadAhaaaWaaSbaaSqaaabaaaaaaaaapeGaamyy aaWdaeqaaOWdbiabgkHiT8aadaqdaaqaaiaadAhaaaWaaSbaaSqaa8 qacaWGMbaapaqabaGccqGH9aqpcaaMc8+dbiaad2gapaWaaWbaaSqa beaapeWaaeWaa8aabaWdbiaabgdaaiaawIcacaGLPaaaaaGccaWGgb WaaeWaa8aabaWdbiabew7aLjaacYcacaGGGcGaamOBaaGaayjkaiaa wMcaaiabgUcaRiaacckacaWGJbGaam4Baiaad6gacaWGZbGaamiDai aadggacaWGUbGaamiDaaaa@58B0@     (1)

v ¯ a v ¯ f = m ( 2 ) ϕ( ε, n )+ constant MathType@MTEF@5@5@+= feaagKart1ev2aqatCvAUfeBSjuyZL2yd9gzLbvyNv2CaerbuLwBLn hiov2DGi1BTfMBaeXatLxBI9gBaerbujxzIv3yOvgDG00uaerbd9wD YLwzYbItLDharqqtubsr4rNCHbGeaGqkY=MjYJH8sqFD0xXdHaVhbb f9v8qqaqFr0xc9pk0xbba9q8WqFfea0=yr0RYxir=Jbba9q8aq0=yq =He9q8qqQ8frFve9Fve9Ff0dmeaabaqaciGacaGaaeaadaabaeaafa aakeaadaqdaaqaaiaadAhaaaWaaSbaaSqaaabaaaaaaaaapeGaamyy aaWdaeqaaOWdbiabgkHiT8aadaqdaaqaaiaadAhaaaWaaSbaaSqaa8 qacaWGMbaapaqabaGccqGH9aqpcqGHsislpeGaamyBa8aadaahaaWc beqaa8qadaqadaWdaeaapeGaaeOmaaGaayjkaiaawMcaaaaak8aacq aHvpGzpeWaaeWaa8aabaWdbiabew7aLjaacYcacaGGGcGaamOBaaGa ayjkaiaawMcaaiabgUcaRiaacckacaWGJbGaam4Baiaad6gacaWGZb GaamiDaiaadggacaWGUbGaamiDaaaa@592F@             (2)

where ϕ( n,ε )=[ F( n, )+ 2g( n ) ]. MathType@MTEF@5@5@+= feaagKart1ev2aqatCvAUfeBSjuyZL2yd9gzLbvyNv2CaerbuLwBLn hiov2DGi1BTfMBaeXatLxBI9gBaerbujxzIv3yOvgDG00uaerbd9wD YLwzYbItLDharqqtubsr4rNCHbGeaGqkY=MjYJH8sqFD0xXdHaVhbb f9v8qqaqFr0xc9pk0xbba9q8WqFfea0=yr0RYxir=Jbba9q8aq0=yq =He9q8qqQ8frFve9Fve9Ff0dmeaabaqaciGacaGaaeaadaabaeaafa aakeaacqaHvpGzqaaaaaaaaaWdbmaabmaapaqaa8qacaWGUbGaaiil aiabew7aLbGaayjkaiaawMcaaiabg2da9maadmaapaqaa8qacaWGgb WaaeWaa8aabaWdbiaad6gacaGGSaaacaGLOaGaayzkaaGaey4kaSIa aiiOaiaabkdacaWGNbWaaeWaa8aabaWdbiaad6gaaiaawIcacaGLPa aaaiaawUfacaGLDbaacaGGUaaaaa@513E@

If the ground state ( μ g ) MathType@MTEF@5@5@+= feaagKart1ev2aaatCvAUfeBSjuyZL2yd9gzLbvyNv2CaerbuLwBLn hiov2DGi1BTfMBaeXatLxBI9gBaerbujxzIv3yOvgDG00uaerbd9wD YLwzYbItLDharqqtubsr4rNCHbGeaGqkY=MjYJH8sqFD0xXdHaVhbb f9v8qqaqFr0xc9pk0xbba9q8WqFfea0=yr0RYxir=Jbba9q8aq0=yq =He9q8qqQ8frFve9Fve9Ff0dmeaabaqaciGacaGaaeaadaabaeaafa aakeaacaGGOaaeaaaaaaaaa8qacqaH8oqBpaWaaSbaaSqaa8qacaWG NbaapaqabaGccaGGPaaaaa@40C1@ dipole moment and excited state ( μ e ) MathType@MTEF@5@5@+= feaagKart1ev2aaatCvAUfeBSjuyZL2yd9gzLbvyNv2CaerbuLwBLn hiov2DGi1BTfMBaeXatLxBI9gBaerbujxzIv3yOvgDG00uaerbd9wD YLwzYbItLDharqqtubsr4rNCHbGeaGqkY=MjYJH8sqFD0xXdHaVhbb f9v8qqaqFr0xc9pk0xbba9q8WqFfea0=yr0RYxir=Jbba9q8aq0=yq =He9q8qqQ8frFve9Fve9Ff0dmeaabaqaciGacaGaaeaadaabaeaafa aakeaaqaaaaaaaaaWdbiaacIcacqaH8oqBpaWaaSbaaSqaa8qacaWG LbaapaqabaGccaGGPaaaaa@40BF@ dipole moment is not collinear, then the angle between the two dipole moments μ g MathType@MTEF@5@5@+= feaagKart1ev2aaatCvAUfeBSjuyZL2yd9gzLbvyNv2CaerbuLwBLn hiov2DGi1BTfMBaeXatLxBI9gBaerbujxzIv3yOvgDG00uaerbd9wD YLwzYbItLDharqqtubsr4rNCHbGeaGqkY=MjYJH8sqFD0xXdHaVhbb f9v8qqaqFr0xc9pk0xbba9q8WqFfea0=yr0RYxir=Jbba9q8aq0=yq =He9q8qqQ8frFve9Fve9Ff0dmeaabaqaciGacaGaaeaadaabaeaafa aakeaaqaaaaaaaaaWdbiabeY7aT9aadaWgaaWcbaWdbiaadEgaa8aa beaaaaa@3F5E@ and μ e MathType@MTEF@5@5@+= feaagKart1ev2aaatCvAUfeBSjuyZL2yd9gzLbvyNv2CaerbuLwBLn hiov2DGi1BTfMBaeXatLxBI9gBaerbujxzIv3yOvgDG00uaerbd9wD YLwzYbItLDharqqtubsr4rNCHbGeaGqkY=MjYJH8sqFD0xXdHaVhbb f9v8qqaqFr0xc9pk0xbba9q8WqFfea0=yr0RYxir=Jbba9q8aq0=yq =He9q8qqQ8frFve9Fve9Ff0dmeaabaqaciGacaGaaeaadaabaeaafa aakeaaqaaaaaaaaaWdbiabeY7aT9aadaWgaaWcbaWdbiaadwgaa8aa beaaaaa@3F5C@ is determined using Equation (3)

cosϕ= 1 2 μ g μ e [ ( μ g 2 + μ e 2 ) m ( 1 ) m ( 2 ) ( μ e 2 μ g 2 ) ] MathType@MTEF@5@5@+= feaagKart1ev2aqatCvAUfeBSjuyZL2yd9gzLbvyNv2CaerbuLwBLn hiov2DGi1BTfMBaeXatLxBI9gBaerbujxzIv3yOvgDG00uaerbd9wD YLwzYbItLDharqqtubsr4rNCHbGeaGqkY=MjYJH8sqFD0xXdHaVhbb f9v8qqaqFr0xc9pk0xbba9q8WqFfea0=yr0RYxir=Jbba9q8aq0=yq =He9q8qqQ8frFve9Fve9Ff0dmeaabaqaciGacaGaaeaadaabaeaafa aakeaaqaaaaaaaaaWdbiaadogacaWGVbGaam4Ca8aacqaHvpGzpeGa eyypa0JaaGPaVpaalaaapaqaa8qacaqGXaaapaqaa8qacaqGYaGaeq iVd02damaaBaaaleaapeGaam4zaaWdaeqaaOWdbiabeY7aT9aadaWg aaWcbaWdbiaadwgaa8aabeaaaaGcpeWaamWaa8aabaWdbmaabmaapa qaa8qacqaH8oqBpaWaaSbaaSqaa8qacaWGNbaapaqabaGcdaahaaWc beqaa8qacaqGYaaaaOGaey4kaSIaeqiVd02damaaBaaaleaapeGaam yzaaWdaeqaaOWaaWbaaSqabeaapeGaaeOmaaaaaOGaayjkaiaawMca aiabgkHiTmaalaaapaqaa8qacaWGTbWdamaaCaaaleqabaWdbmaabm aapaqaa8qacaqGXaaacaGLOaGaayzkaaaaaaGcpaqaa8qacaWGTbWd amaaCaaaleqabaWdbmaabmaapaqaa8qacaqGYaaacaGLOaGaayzkaa aaaaaakmaabmaapaqaa8qacqaH8oqBpaWaaSbaaSqaa8qacaWGLbaa paqabaGcdaahaaWcbeqaa8qacaqGYaaaaOGaeyOeI0IaeqiVd02dam aaBaaaleaapeGaam4zaaWdaeqaaOWaaWbaaSqabeaapeGaaeOmaaaa aOGaayjkaiaawMcaaaGaay5waiaaw2faaaaa@6B48@ (3)

Using the slopes obtained from the linear plots of Equation (1) and Equation (2), the dipole moment of the fluorophore in the ground state and excited state was determined using Equation (4) and Equation (5)

µ g = ( 1 2 ( m ( 2 ) m ( 1 ) ) ) hc a 3 2 m ( 1 ) MathType@MTEF@5@5@+= feaagKart1ev2aqatCvAUfeBSjuyZL2yd9gzLbvyNv2CaerbuLwBLn hiov2DGi1BTfMBaeXatLxBI9gBaerbujxzIv3yOvgDG00uaerbd9wD YLwzYbItLDharqqtubsr4rNCHbGeaGqkY=MjYJH8sqFD0xXdHaVhbb f9v8qqaqFr0xc9pk0xbba9q8WqFfea0=yr0RYxir=Jbba9q8aq0=yq =He9q8qqQ8frFve9Fve9Ff0dmeaabaqaciGacaGaaeaadaabaeaafa aakeaaqaaaaaaaaaWdbiaadwlapaWaaSbaaSqaa8qacaWGNbaapaqa baGcpeGaeyypa0JaaiiOamaabmaapaqaa8qadaWcaaWdaeaapeGaae ymaaWdaeaapeGaaeOmaaaacaGGOaGaamyBa8aadaahaaWcbeqaa8qa daqadaWdaeaapeGaaeOmaaGaayjkaiaawMcaaaaakiabgkHiTiaad2 gapaWaaWbaaSqabeaapeWaaeWaa8aabaWdbiaabgdaaiaawIcacaGL PaaaaaGccaGGPaaacaGLOaGaayzkaaWaaOaaa8aabaWdbmaalaaapa qaa8qacaWGObGaam4yaiaadggapaWaaWbaaSqabeaapeGaae4maaaa aOWdaeaapeGaaeOmaiaad2gapaWaaWbaaSqabeaapeWaaeWaa8aaba WdbiaabgdaaiaawIcacaGLPaaaaaaaaaqabaaaaa@56A8@    (4)

µ e =( 1 2 ( m ( 2 ) + m ( 1 ) ) ) hc a 3 2 m ( 1 ) MathType@MTEF@5@5@+= feaagKart1ev2aqatCvAUfeBSjuyZL2yd9gzLbvyNv2CaerbuLwBLn hiov2DGi1BTfMBaeXatLxBI9gBaerbujxzIv3yOvgDG00uaerbd9wD YLwzYbItLDharqqtubsr4rNCHbGeaGqkY=MjYJH8sqFD0xXdHaVhbb f9v8qqaqFr0xc9pk0xbba9q8WqFfea0=yr0RYxir=Jbba9q8aq0=yq =He9q8qqQ8frFve9Fve9Ff0dmeaabaqaciGacaGaaeaadaabaeaafa aakeaaqaaaaaaaaaWdbiaadwlapaWaaSbaaSqaa8qacaWGLbaapaqa baGcpeGaeyypa0ZaaeWaa8aabaWdbmaalaaapaqaa8qacaqGXaaapa qaa8qacaqGYaaaaiaacIcacaWGTbWdamaaCaaaleqabaWdbmaabmaa paqaa8qacaqGYaaacaGLOaGaayzkaaaaaOGaey4kaSIaamyBa8aada ahaaWcbeqaa8qadaqadaWdaeaapeGaaeymaaGaayjkaiaawMcaaaaa kiaacMcaaiaawIcacaGLPaaadaGcaaWdaeaapeWaaSaaa8aabaWdbi aadIgacaWGJbGaamyya8aadaahaaWcbeqaa8qacaqGZaaaaaGcpaqa a8qacaqGYaGaamyBa8aadaahaaWcbeqaa8qadaqadaWdaeaapeGaae ymaaGaayjkaiaawMcaaaaaaaaabeaaaaa@5577@             (5)

Using Equation (6) and Equation (7), the solvent polarity functions were determined.

F(n,ε) =[ ( 2 n 2 +1 )  ( n 2  +2 ) ]( ε1 ε+2 n 2 1 n 2 +2 ) MathType@MTEF@5@5@+= feaagKart1ev2aaatCvAUfeBSjuyZL2yd9gzLbvyNv2CaerbuLwBLn hiov2DGi1BTfMBaeXatLxBI9gBaerbujxzIv3yOvgDG00uaerbd9wD YLwzYbItLDharqqtubsr4rNCHbGeaGqkY=MjYJH8sqFD0xXdHaVhbb f9v8qqaqFr0xc9pk0xbba9q8WqFfea0=yr0RYxir=Jbba9q8aq0=yq =He9q8qqQ8frFve9Fve9Ff0dmeaabaqaciGacaGaaeaadaabaeaafa aakeaaqaaaaaaaaaWdbiaadAeapaGaaiika8qacaWGUbGaaiilaiab ew7aL9aacaGGPaWdbiaabccacqGH9aqpcaaMc8+aamWaa8aabaWdbm aalaaapaqaa8qadaqadaWdaeaapeGaaeOmaiaad6gapaWaaWbaaSqa beaapeGaaeOmaaaakiabgUcaRiaabgdaaiaawIcacaGLPaaacaGGGc aapaqaa8qadaqadaWdaeaapeGaamOBa8aadaahaaWcbeqaa8qacaqG YaaaaOGaaiiOaiabgUcaRiaabkdaaiaawIcacaGLPaaaaaaacaGLBb GaayzxaaWaaeWaa8aabaWdbmaalaaapaqaa8qacqaH1oqzcqGHsisl caqGXaaapaqaa8qacqaH1oqzcqGHRaWkcaqGYaaaaiabgkHiTmaala aapaqaa8qacaWGUbWdamaaCaaaleqabaWdbiaabkdaaaGccqGHsisl caqGXaaapaqaa8qacaWGUbWdamaaCaaaleqabaWdbiaabkdaaaGccq GHRaWkcaqGYaaaaaGaayjkaiaawMcaaaaa@6602@                          (6)

And g(n,ε) = 3 2 [ n 4 1 ( n 2 +2 ) 2 ] MathType@MTEF@5@5@+= feaagKart1ev2aaatCvAUfeBSjuyZL2yd9gzLbvyNv2CaerbuLwBLn hiov2DGi1BTfMBaeXatLxBI9gBaerbujxzIv3yOvgDG00uaerbd9wD YLwzYbItLDharqqtubsr4rNCHbGeaGqkY=MjYJH8sqFD0xXdHaVhbb f9v8qqaqFr0xc9pk0xbba9q8WqFfea0=yr0RYxir=Jbba9q8aq0=yq =He9q8qqQ8frFve9Fve9Ff0dmeaabaqaciGacaGaaeaadaabaeaafa aakeaaqaaaaaaaaaWdbiaadEgapaGaaiika8qacaWGUbGaaiilaiab ew7aL9aacaGGPaWdbiaabccacqGH9aqpcaaMc8+aaSaaa8aabaWdbi aabodaa8aabaWdbiaabkdaaaWaamWaa8aabaWdbmaalaaapaqaa8qa caWGUbWdamaaCaaaleqabaWdbiaabsdaaaGccqGHsislcaqGXaaapa qaa8qadaqadaWdaeaapeGaamOBa8aadaahaaWcbeqaa8qacaqGYaaa aOGaey4kaSIaaeOmaaGaayjkaiaawMcaa8aadaahaaWcbeqaa8qaca qGYaaaaaaaaOGaay5waiaaw2faaaaa@5364@            (7)

As suggested by Lippert-Mataga,19 Bakhsheiv20 and Kawaski-Chamma-Viallet,21,22 we can determine dipole moment of the fluorophore in both the ground state and excited state using Equation (8), Equation (9) and Equation (10), as is given below.

v ¯ a v ¯ f = m 1 F 1 ( n,ε )+ constant MathType@MTEF@5@5@+= feaagKart1ev2aaatCvAUfeBSjuyZL2yd9gzLbvyNv2CaerbuLwBLn hiov2DGi1BTfMBaeXatLxBI9gBaerbujxzIv3yOvgDG00uaerbd9wD YLwzYbItLDharqqtubsr4rNCHbGeaGqkY=MjYJH8sqFD0xXdHaVhbb f9v8qqaqFr0xc9pk0xbba9q8WqFfea0=yr0RYxir=Jbba9q8aq0=yq =He9q8qqQ8frFve9Fve9Ff0dmeaabaqaciGacaGaaeaadaabaeaafa aakeaadaqdaaqaaiaadAhaaaWaaSbaaSqaaabaaaaaaaaapeGaamyy aaWdaeqaaOWdbiabgkHiT8aadaqdaaqaaiaadAhaaaWaaSbaaSqaa8 qacaWGMbaapaqabaGccqGH9aqpcaaMc8+dbiaad2gapaWaaSbaaSqa a8qacaqGXaaapaqabaGccaaMc8+dbiaadAeapaWaaSbaaSqaa8qaca qGXaaapaqabaGcpeWaaeWaa8aabaWdbiaad6gacaGGSaGaeqyTduga caGLOaGaayzkaaGaey4kaSIaaiiOaiaadogacaWGVbGaamOBaiaado hacaWG0bGaamyyaiaad6gacaWG0baaaa@58B4@ (8)

v ¯ a v ¯ f = m 2 F 2 ( n,ε )+ constant MathType@MTEF@5@5@+= feaagKart1ev2aaatCvAUfeBSjuyZL2yd9gzLbvyNv2CaerbuLwBLn hiov2DGi1BTfMBaeXatLxBI9gBaerbujxzIv3yOvgDG00uaerbd9wD YLwzYbItLDharqqtubsr4rNCHbGeaGqkY=MjYJH8sqFD0xXdHaVhbb f9v8qqaqFr0xc9pk0xbba9q8WqFfea0=yr0RYxir=Jbba9q8aq0=yq =He9q8qqQ8frFve9Fve9Ff0dmeaabaqaciGacaGaaeaadaabaeaafa aakeaadaqdaaqaaiaadAhaaaWaaSbaaSqaaabaaaaaaaaapeGaamyy aaWdaeqaaOWdbiabgkHiT8aadaqdaaqaaiaadAhaaaWaaSbaaSqaa8 qacaWGMbaapaqabaGccqGH9aqpcaaMc8+dbiaad2gapaWaaSbaaSqa a8qacaqGYaaapaqabaGccaaMc8+dbiaadAeapaWaaSbaaSqaa8qaca qGYaaapaqabaGcpeWaaeWaa8aabaWdbiaad6gacaGGSaGaeqyTduga caGLOaGaayzkaaGaey4kaSIaaiiOaiaadogacaWGVbGaamOBaiaado hacaWG0bGaamyyaiaad6gacaWG0baaaa@58B6@                     (9)

v ¯ a + v ¯ f 2 = m 3 F 3 ( n,ε )+ constant MathType@MTEF@5@5@+= feaagKart1ev2aaatCvAUfeBSjuyZL2yd9gzLbvyNv2CaerbuLwBLn hiov2DGi1BTfMBaeXatLxBI9gBaerbujxzIv3yOvgDG00uaerbd9wD YLwzYbItLDharqqtubsr4rNCHbGeaGqkY=MjYJH8sqFD0xXdHaVhbb f9v8qqaqFr0xc9pk0xbba9q8WqFfea0=yr0RYxir=Jbba9q8aq0=yq =He9q8qqQ8frFve9Fve9Ff0dmeaabaqaciGacaGaaeaadaabaeaafa aakeaaqaaaaaaaaaWdbmaalaaapaqaamaanaaabaGaamODaaaadaWg aaWcbaWdbiaadggaa8aabeaak8qacqGHRaWkpaWaa0aaaeaacaWG2b aaamaaBaaaleaapeGaamOzaaWdaeqaaaGcbaWdbiaabkdaaaGaeyyp a0JaaGPaVlaad2gapaWaaSbaaSqaa8qacaqGZaaapaqabaGccaaMc8 +dbiaadAeapaWaaSbaaSqaa8qacaqGZaaapaqabaGcpeWaaeWaa8aa baWdbiaad6gacaGGSaGaeqyTdugacaGLOaGaayzkaaGaey4kaSIaai iOaiaadogacaWGVbGaamOBaiaadohacaWG0bGaamyyaiaad6gacaWG 0baaaa@5991@             (10)

The validity of Equation (8), Equation (9) and Equation (10) was checked using the solvent polarity function relations expressed by Equation (11), Equation (12), and Equation (13).

F 1 ( n,ε )=[ ( ( ε1 ) ( 2+1 ) )( ( n 2 1 ) ( 2 n 2 +1 ) ) ] MathType@MTEF@5@5@+= feaagKart1ev2aqatCvAUfeBSjuyZL2yd9gzLbvyNv2CaerbuLwBLn hiov2DGi1BTfMBaeXatLxBI9gBaerbujxzIv3yOvgDG00uaerbd9wD YLwzYbItLDharqqtubsr4rNCHbGeaGqkY=MjYJH8sqFD0xXdHaVhbb f9v8qqaqFr0xc9pk0xbba9q8WqFfea0=yr0RYxir=Jbba9q8aq0=yq =He9q8qqQ8frFve9Fve9Ff0dmeaabaqaciGacaGaaeaadaabaeaafa aakeaaqaaaaaaaaaWdbiaadAeapaWaaSbaaSqaa8qacaqGXaaapaqa baGcpeWaaeWaa8aabaWdbiaad6gacaGGSaGaeqyTdugacaGLOaGaay zkaaGaeyypa0ZaamWaa8aabaWdbmaabmaapaqaa8qadaWcaaWdaeaa peWaaeWaa8aabaWdbiabew7aLjabgkHiTiaabgdaaiaawIcacaGLPa aaa8aabaWdbmaabmaapaqaa8qacaqGYaGaey4kaSIaaeymaaGaayjk aiaawMcaaaaaaiaawIcacaGLPaaacqGHsisldaqadaWdaeaapeWaaS aaa8aabaWdbmaabmaapaqaa8qacaWGUbWdamaaCaaaleqabaWdbiaa bkdaaaGccqGHsislcaqGXaaacaGLOaGaayzkaaaapaqaa8qadaqada WdaeaapeGaaeOmaiaad6gapaWaaWbaaSqabeaapeGaaeOmaaaakiab gUcaRiaabgdaaiaawIcacaGLPaaaaaaacaGLOaGaayzkaaaacaGLBb Gaayzxaaaaaa@5F53@     (11)

F 2 ( n,ε )= [ ( 2 n 2 +1 ) ( n 2  +2 ) ][ ( ε1 ε+2 )( n 2 1 n 2 +2 ) ] MathType@MTEF@5@5@+= feaagKart1ev2aqatCvAUfeBSjuyZL2yd9gzLbvyNv2CaerbuLwBLn hiov2DGi1BTfMBaeXatLxBI9gBaerbujxzIv3yOvgDG00uaerbd9wD YLwzYbItLDharqqtubsr4rNCHbGeaGqkY=MjYJH8sqFD0xXdHaVhbb f9v8qqaqFr0xc9pk0xbba9q8WqFfea0=yr0RYxir=Jbba9q8aq0=yq =He9q8qqQ8frFve9Fve9Ff0dmeaabaqaciGacaGaaeaadaabaeaafa aakeaaqaaaaaaaaaWdbiaadAeapaWaaSbaaSqaaiaabkdaaeqaaOWd bmaabmaapaqaa8qacaWGUbGaaiilaiabew7aLbGaayjkaiaawMcaai abg2da9iaacckadaWadaWdaeaapeWaaSaaa8aabaWdbmaabmaapaqa a8qacaqGYaGaamOBa8aadaahaaWcbeqaa8qacaqGYaaaaOGaey4kaS IaaeymaaGaayjkaiaawMcaaaWdaeaapeWaaeWaa8aabaWdbiaad6ga paWaaWbaaSqabeaapeGaaeOmaaaakiaacckacqGHRaWkcaqGYaaaca GLOaGaayzkaaaaaaGaay5waiaaw2faamaadmaapaqaa8qadaqadaWd aeaapeWaaSaaa8aabaWdbiabew7aLjabgkHiTiaabgdaa8aabaWdbi abew7aLjabgUcaRiaabkdaaaaacaGLOaGaayzkaaGaeyOeI0YaaeWa a8aabaWdbmaalaaapaqaa8qacaWGUbWdamaaCaaaleqabaWdbiaabk daaaGccqGHsislcaqGXaaapaqaa8qacaWGUbWdamaaCaaaleqabaWd biaabkdaaaGccqGHRaWkcaqGYaaaaaGaayjkaiaawMcaaaGaay5wai aaw2faaaaa@68A9@          (12)

F 3 ( n,ε )={ 1 2 ( 2 n 2 +1 ) ( n 2  +2 ) [ ε1 ε+2 n 2 1 n 2 +2 ]+ 3 2 [ n 4 1 ( n 2 +2 ) 2 ] } MathType@MTEF@5@5@+= feaagKart1ev2aqatCvAUfeBSjuyZL2yd9gzLbvyNv2CaerbuLwBLn hiov2DGi1BTfMBaeXatLxBI9gBaerbujxzIv3yOvgDG00uaerbd9wD YLwzYbItLDharqqtubsr4rNCHbGeaGqkY=MjYJH8sqFD0xXdHaVhbb f9v8qqaqFr0xc9pk0xbba9q8WqFfea0=yr0RYxir=Jbba9q8aq0=yq =He9q8qqQ8frFve9Fve9Ff0dmeaabaqaciGacaGaaeaadaabaeaafa aakeaaqaaaaaaaaaWdbiaadAeapaWaaSbaaSqaa8qacaqGZaaapaqa baGcpeWaaeWaa8aabaWdbiaad6gacaGGSaGaeqyTdugacaGLOaGaay zkaaGaeyypa0ZaaiWaa8aabaWdbmaalaaapaqaa8qacaqGXaaapaqa a8qacaqGYaaaamaalaaapaqaa8qadaqadaWdaeaapeGaaeOmaiaad6 gapaWaaWbaaSqabeaapeGaaeOmaaaakiabgUcaRiaabgdaaiaawIca caGLPaaaa8aabaWdbmaabmaapaqaa8qacaWGUbWdamaaCaaaleqaba WdbiaabkdaaaGccaGGGcGaey4kaSIaaeOmaaGaayjkaiaawMcaaaaa daWadaWdaeaapeWaaSaaa8aabaWdbiabew7aLjabgkHiTiaabgdaa8 aabaWdbiabew7aLjabgUcaRiaabkdaaaGaeyOeI0YaaSaaa8aabaWd biaad6gapaWaaWbaaSqabeaapeGaaeOmaaaakiabgkHiTiaabgdaa8 aabaWdbiaad6gapaWaaWbaaSqabeaapeGaaeOmaaaakiabgUcaRiaa bkdaaaaacaGLBbGaayzxaaGaey4kaSYaaSaaa8aabaWdbiaabodaa8 aabaWdbiaabkdaaaWaamWaa8aabaWdbmaalaaapaqaa8qacaWGUbWd amaaCaaaleqabaWdbiaabsdaaaGccqGHsislcaqGXaaapaqaa8qada qadaWdaeaapeGaamOBa8aadaahaaWcbeqaa8qacaqGYaaaaOGaey4k aSIaaeOmaaGaayjkaiaawMcaa8aadaahaaWcbeqaa8qacaqGYaaaaa aaaOGaay5waiaaw2faaaGaay5Eaiaaw2haaaaa@752E@               (13)

In these equations, n is the refractive index and ε represents dielectric constant of the solvent used. Further, m1, m2 and m3 are the slopes obtained by a linear fit of Equation (8), Equation (9) and Equation (10). The slope depends upon a change in the solute’s dipole moment upon excitation (μ=  μ e   μ g ) MathType@MTEF@5@5@+= feaagKart1ev2aaatCvAUfeBSjuyZL2yd9gzLbvyNv2CaerbuLwBLn hiov2DGi1BTfMBaeXatLxBI9gBaerbujxzIv3yOvgDG00uaerbd9wD YLwzYbItLDharqqtubsr4rNCHbGeaGqkY=MjYJH8sqFD0xXdHaVhbb f9v8qqaqFr0xc9pk0xbba9q8WqFfea0=yr0RYxir=Jbba9q8aq0=yq =He9q8qqQ8frFve9Fve9Ff0dmeaabaqaciGacaGaaeaadaabaeaafa aakeaacaGGOaaeaaaaaaaaa8qacqaH8oqBcqGH9aqpcaqGGaGaeqiV d02damaaBaaaleaapeGaamyzaaWdaeqaaOWdbiaacobicaqGGaGaeq iVd02damaaBaaaleaapeGaam4zaaWdaeqaaOGaaiykaaaa@488E@ and size of the cavity radius (a).

We can use Equation (14) and Equation (15) to determine μ g MathType@MTEF@5@5@+= feaagKart1ev2aaatCvAUfeBSjuyZL2yd9gzLbvyNv2CaerbuLwBLn hiov2DGi1BTfMBaeXatLxBI9gBaerbujxzIv3yOvgDG00uaerbd9wD YLwzYbItLDharqqtubsr4rNCHbGeaGqkY=MjYJH8sqFD0xXdHaVhbb f9v8qqaqFr0xc9pk0xbba9q8WqFfea0=yr0RYxir=Jbba9q8aq0=yq =He9q8qqQ8frFve9Fve9Ff0dmeaabaqaciGacaGaaeaadaabaeaafa aakeaaqaaaaaaaaaWdbiabeY7aT9aadaWgaaWcbaWdbiaadEgaa8aa beaaaaa@3F5E@ and μ e MathType@MTEF@5@5@+= feaagKart1ev2aaatCvAUfeBSjuyZL2yd9gzLbvyNv2CaerbuLwBLn hiov2DGi1BTfMBaeXatLxBI9gBaerbujxzIv3yOvgDG00uaerbd9wD YLwzYbItLDharqqtubsr4rNCHbGeaGqkY=MjYJH8sqFD0xXdHaVhbb f9v8qqaqFr0xc9pk0xbba9q8WqFfea0=yr0RYxir=Jbba9q8aq0=yq =He9q8qqQ8frFve9Fve9Ff0dmeaabaqaciGacaGaaeaadaabaeaafa aakeaaqaaaaaaaaaWdbiabeY7aT9aadaWgaaWcbaWdbiaadwgaa8aa beaaaaa@3F5C@ provided both are parallel to each other.

µ g =  m 3 m 2 2 ( hc a 3 2 m 2 ) 1 2 MathType@MTEF@5@5@+= feaagKart1ev2aqatCvAUfeBSjuyZL2yd9gzLbvyNv2CaerbuLwBLn hiov2DGi1BTfMBaeXatLxBI9gBaerbujxzIv3yOvgDG00uaerbd9wD YLwzYbItLDharqqtubsr4rNCHbGeaGqkY=MjYJH8sqFD0xXdHaVhbb f9v8qqaqFr0xc9pk0xbba9q8WqFfea0=yr0RYxir=Jbba9q8aq0=yq =He9q8qqQ8frFve9Fve9Ff0dmeaabaqaciGacaGaaeaadaabaeaafa aakeaaqaaaaaaaaaWdbiaadwlapaWaaSbaaSqaa8qacaWGNbaapaqa baGcpeGaeyypa0JaaiiOamaalaaapaqaa8qacaWGTbWdamaaBaaale aapeGaae4maaWdaeqaaOWdbiabgkHiTiaad2gapaWaaSbaaSqaa8qa caqGYaaapaqabaaakeaapeGaaeOmaaaadaqadaWdaeaapeWaaSaaa8 aabaWdbiaadIgacaWGJbGaamyya8aadaahaaWcbeqaa8qacaqGZaaa aaGcpaqaa8qacaqGYaGaamyBa8aadaWgaaWcbaWdbiaabkdaa8aabe aaaaaak8qacaGLOaGaayzkaaWdamaaCaaaleqabaWdbmaalaaapaqa a8qacaqGXaaapaqaa8qacaqGYaaaaaaaaaa@51BF@                (14)

µ e =  m 3 + m 2 2 ( hc a 3 2 m 2 ) 1 2 MathType@MTEF@5@5@+= feaagKart1ev2aqatCvAUfeBSjuyZL2yd9gzLbvyNv2CaerbuLwBLn hiov2DGi1BTfMBaeXatLxBI9gBaerbujxzIv3yOvgDG00uaerbd9wD YLwzYbItLDharqqtubsr4rNCHbGeaGqkY=MjYJH8sqFD0xXdHaVhbb f9v8qqaqFr0xc9pk0xbba9q8WqFfea0=yr0RYxir=Jbba9q8aq0=yq =He9q8qqQ8frFve9Fve9Ff0dmeaabaqaciGacaGaaeaadaabaeaafa aakeaaqaaaaaaaaaWdbiaadwlapaWaaSbaaSqaa8qacaWGLbaapaqa baGcpeGaeyypa0JaaiiOamaalaaapaqaa8qacaWGTbWdamaaBaaale aapeGaae4maaWdaeqaaOWdbiabgUcaRiaad2gapaWaaSbaaSqaa8qa caqGYaaapaqabaaakeaapeGaaeOmaaaadaqadaWdaeaapeWaaSaaa8 aabaWdbiaadIgacaWGJbGaamyya8aadaahaaWcbeqaa8qacaqGZaaa aaGcpaqaa8qacaqGYaGaamyBa8aadaWgaaWcbaWdbiaabkdaa8aabe aaaaaak8qacaGLOaGaayzkaaWdamaaCaaaleqabaWdbmaalaaapaqa a8qacaqGXaaapaqaa8qacaqGYaaaaaaaaaa@51B2@                    (15)

and µ e =  m 2 + m 3 m 3 m 2 µ g  ; m 3 > m 2 MathType@MTEF@5@5@+= feaagKart1ev2aqatCvAUfeBSjuyZL2yd9gzLbvyNv2CaerbuLwBLn hiov2DGi1BTfMBaeXatLxBI9gBaerbujxzIv3yOvgDG00uaerbd9wD YLwzYbItLDharqqtubsr4rNCHbGeaGqkY=MjYJH8sqFD0xXdHaVhbb f9v8qqaqFr0xc9pk0xbba9q8WqFfea0=yr0RYxir=Jbba9q8aq0=yq =He9q8qqQ8frFve9Fve9Ff0dmeaabaqaciGacaGaaeaadaabaeaafa aakeaaqaaaaaaaaaWdbiaadwlapaWaaSbaaSqaa8qacaWGLbaapaqa baGcpeGaeyypa0JaaiiOamaalaaapaqaa8qacaWGTbWdamaaBaaale aapeGaaeOmaaWdaeqaaOWdbiabgUcaRiaad2gapaWaaSbaaSqaa8qa caqGZaaapaqabaaakeaapeGaamyBa8aadaWgaaWcbaWdbiaabodaa8 aabeaak8qacqGHsislcaWGTbWdamaaBaaaleaapeGaaeOmaaWdaeqa aaaak8qacaWG1cWdamaaBaaaleaapeGaam4zaaWdaeqaaOWdbiaacc kacaGG7aGaamyBa8aadaWgaaWcbaWdbiaabodaa8aabeaak8qacqGH +aGpcaWGTbWdamaaBaaaleaapeGaaeOmaaWdaeqaaaaa@5533@             (16)

Suppaman’s expression (Equation 17) was used to determine radius of the cavity.

a= ( 3M 4πδN ) 1/3 MathType@MTEF@5@5@+= feaagKart1ev2aqatCvAUfeBSjuyZL2yd9gzLbvyNv2CaerbuLwBLn hiov2DGi1BTfMBaeXatLxBI9gBaerbujxzIv3yOvgDG00uaerbd9wD YLwzYbItLDharqqtubsr4rNCHbGeaGqkY=MjYJH8sqFD0xXdHaVhbb f9v8qqaqFr0xc9pk0xbba9q8WqFfea0=yr0RYxir=Jbba9q8aq0=yq =He9q8qqQ8frFve9Fve9Ff0dmeaabaqaciGacaGaaeaadaabaeaafa aakeaaqaaaaaaaaaWdbiaadggacqGH9aqpdaqadaWdaeaapeWaaSaa a8aabaWdbiaabodacaWGnbaapaqaa8qacaqG0aGaeqiWdaNaeqiTdq MaamOtaaaaaiaawIcacaGLPaaapaWaaWbaaSqabeaapeGaaeymaiaa b+cacaqGZaaaaaaa@4921@        (17)

In Equation 17, N represents the Avogadro’s number, M represents the molecular wight and δ MathType@MTEF@5@5@+= feaagKart1ev2aqatCvAUfeBSjuyZL2yd9gzLbvyNv2CaerbuLwBLn hiov2DGi1BTfMBaeXatLxBI9gBaerbujxzIv3yOvgDG00uaerbd9wD YLwzYbItLDharqqtubsr4rNCHbGeaGqkY=MjYJH8sqFD0xXdHaVhbb f9v8qqaqFr0xc9pk0xbba9q8WqFfea0=yr0RYxir=Jbba9q8aq0=yq =He9q8qqQ8frFve9Fve9Ff0dmeaabaqaciGacaGaaeaadaabaeaafa aakeaaqaaaaaaaaaWdbiabes7aKbaa@3E08@ represents density of the chosen solute.

Experimental techniques

A UV-Visible spectrophotometer [Model: Shimadzu UV Visible Spectrometer] was used to record Optical Density of the three doped thin films and pure polyethersulfone (PES). It was also used to record the absorption spectra of PES in the different solvent mediums. The Fourier transform infrared (FTIR) spectroscopy used in this research study was the Perkin Elmer FTIR and carried out at the research laboratory housed at the BMS Institute of Technology [Bangalore, India]. Use of the FTIR did reveal a noticeable change in the functional group of both the engineered thin films of the polymer composite and the pure polymer, i.e., polyethersulfone (PES). The photoluminescence study [using Model: FP-8300 Jarko] was carried out at the research laboratory housed within the campus of Mysore University [Mysore, India]. Fluorescence spectroscopy was done for the purpose of analysing fluorescent properties of the thin film samples.

The X-ray diffractometer [Model: D8 XRD] study was carried out at the Ramaiah Institute of Technology [Bangalore, India] and did reveal an observable change in intensity with concurrent improvement in crystallinity of the chosen engineered polymer nanocomposite.

The scanning electron microscope (SEM) [Model: Tescan Vegan 3] observations were carried out at the BMS College of Engineering [Bangalore, India] and did reveal an observable change in morphology of both the chosen polymer and the engineered polymer nanocomposites.

Atomic Force Microscopy (AFM) revealed overall roughness of the sample surface of the three engineered polyethersulfone thin films.

Results and discussion

Fourier transform infrared spectroscopy (FTIR) results

The Fourier transform infrared spectra of the reinforced thin films were recorded over the frequency range (4000-400) cm−1. The thin film membranes that were prepared using the spin coating technique were found to be affected and/or influenced by the solvent used. Even if the solvent evaporated, both temperature and chemical properties of the solvent does exert an influence on the spin-coated membrane.2328 In the FTIR spectra, 600 cm-1 to 1400 cm-1 is the fingerprint region, and the region from 1400 cm-1 to 4000 /cm-1 is the functional group region. The FTIR results for the chosen polyethersulfone polymer and the polyethersulfone / ZnNiFe nanocomposites for three different ratios of the ZnNiFe nanoparticles in 0.10 g of the chosen polymer [i.e., polyethersulfone (PES)] was (i) 0.5g ZnNiFe nanoparticles, (ii) 0.10g ZnNiFe nanoparticles, and (iii) 0.15g of ZnNiFe nanoparticles. Here we conducted FTIR in the mid-IR region, i.e., from 4500 cm-1 to 400 cm-1, for the four chosen thin films. The FTIR spectra of the four chosen thin films, namely:

(i) pure polyethersulfone (PES),
(ii) PES + ZnNiFe-1 [10g of polymer + 0.5g of nanoparticles),
(iii) PES + ZnNiFe-2 [10g of polymer + 0.10g of nanoparticles), and
(iv) PES + ZnNiFe-3 [0.10g of polymer + 0.15g of nanoparticles)

is shown in Figure 2. The –OH stretching vibrations appeared at 3527 cm-1 and 3366 cm-1 for the nanoparticle-reinforced thin films, and at 3174 cm-1 for pure polyethersulfone (PES). The C-H stretching and bending vibrations were observed at 2663 cm-1, 2584 cm-1, 2482 cm-1, 2417 cm-1, and 1588 cm-1, 1457 cm-1, and 1444 cm-1. We observed the -OH stretching band that arises due to the addition of ZnNiFe nanoparticles to disappear with a gradual increase in the percentage of nanoparticles in the chosen polymer PES (polyethersulfone). The regions of different wavelength peaks for the as-synthesized PES + ZnNiFe nanocomposites for different ratios of the nanoparticle reinforcements are summarized in Table 2.29
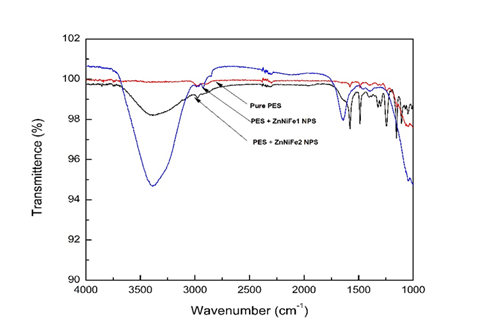
Figure 2 Fourier transform infrared (FTIR) spectra for pure polyethersulfone (PES), PES + ZnNiFe1 and PES + ZnNiFe2.

Wavenumber (cm-1)

Functional groups

3,527,313,133,663,170

-OH stretch, alcohols

2663, 2584,2482,2417

C-H stretch, alkane

2176, 2090

−C ≡ C − stretch, alkynes

194,718,441,837

C=O stretch, carbonyl group

158,814,571,444

CH bend, alkanes

1296

CN stretch, aliphatic amines

901,900

OH bend, carboxylic acid

741

OCN bending

553

Fingerprint region

Table 2  Fourier transform infrared (FTIR) table for the polyethersulfone nanocomposites

Ultra-violet [UV] visible spectroscopy

UV-Visible spectroscopy was conducted with the prime purpose of finding the Optical Density peak for the (i) pure polymers, (ii) pure ZnNiFe nanoparticles, and (iii) polymer/ZnNiFe nanocomposites. Basically, UV-visible spectroscopy was to determine the light absorption capability of the material. The absorption spectra of (i) pure PES, and (ii) PES + ZnNiFe nanoparticles, for different ratios of the ZnNiFe nanoparticles, was found to be constant for the three thin films that contained 0.5g of ZnNiFe nanoparticles, 0.10g of ZnNiFe nanoparticles, and 0.15g of ZnNiFe nanoparticles. We observed both Optical Density and the wavelength maxima at 339 nm to be unaffected by reinforcing polyethersulfone with ZnNiFe nanoparticles (Figure 3).30–33
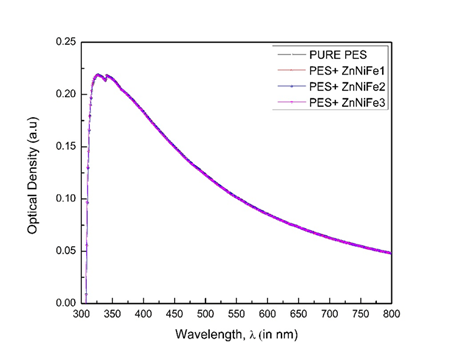
Figure 3 Typical absorption spectra of pure PES and the PES + ZnNiFe nanocomposites for different concentrations.

Photoluminescence results

Fluorescence (FL) emission spectroscopy was used to determine nature of the sample and to concurrently study and document the imperfection-related intensity of the fluorescence emission and peak wavelength depending on the conjoint and mutually interactive influences of nature of synthesis, solvent used, starting materials used, processing time, and few other factors.34–43 The graphs of photoluminescence for pure PES, pure Zn0.5Ni0.5Fe2O4 nanoparticle, and the engineered PES nanocomposite are shown in Figure 4. The optimum wavelength range is selected from 300 nanometers to 500 nanometers. For pure PES the peak intensity was observed to occur at 394 nm, and for the pure Zn0.5Ni0.5Fe2O4, nanoparticles it was observed to occur at 438 nm. For reinforcing the chosen polymer, i.e., PES, with nanoparticles, we do observe a noticeable increase in intensity of the as-synthesized PES nanocomposite and it is 409 nm. The photoluminescence intensity is directly proportional to the concentration of molecules. Hence, we can conclude that reinforcing the chosen polymer (i.e., polyethersulfone) was done properly. The observed increase in intensity for the as-synthesized polymer nanocomposites makes it a potential candidate for selection and use in Opto-electronic applications.
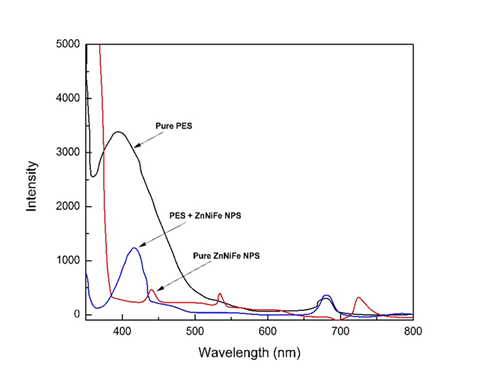
Figure 4 Photoluminescence graph for (i) pure PES, (ii) pure ZnNiFe nanoparticle and (iii) PES + ZnNiFe nanoparticle.

X-ray diffraction results

The x-ray diffraction [XRD] spectra of (i) pure polyethersulfone (PES), (ii) pure Zn0.5Ni0.5Fe2O4 nanoparticles, and (iii) reinforced polyethersulfone composites are shown in Figure 5. The XRD graph of polyethersulfone (PES) both with and without ZnNiFe nanoparticles is well displayed in Figure 5. It is observed that there are no distinct and observable peaks for the XRD spectra of pure polyethersulfone (PES). Hence, it can safely be concluded to be amorphous in nature. However, for the pure ZnNiFe nanoparticles a few sharp peaks were distinctly observed in the spectra. This goes to confirm an overall crystalline nature of the as-synthesized ZnNiFe nanoparticles. When polyethersulfone (PES) is combined with ZnNiFe nanoparticles a few high peaks did appear when compared one-on-one with the XRD spectra of the pure nanoparticles. This suggests that crystallinity has increased by the addition of ZnNiFe nanoparticles to polyethersulfone (PES).
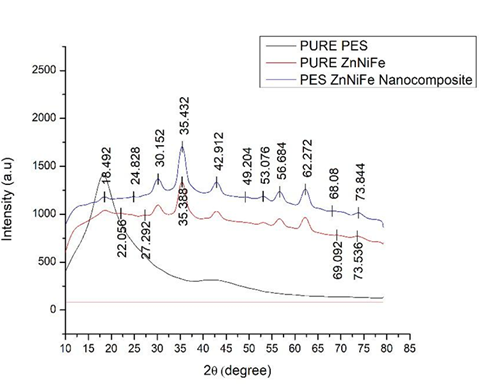
Figure 5 X-ray diffraction (XRD) graph of polyethersulfone (PES) both with and without ZnNiFe nanoparticles.

Atomic force microscopy [AFM] observations

The AFM images were taken to study roughness of the thin film surfaces of both the polymer (polyethersulfone) and polymer nanocomposite. Since the thin films were prepared using the spin coating technique, the thickness is less than that of the dip casting film. Consequently, roughness is less when compared one-on-one with the dip coating thin film having nanometer thickness. The 3-D images of pure polyethersulfone and the polyethersulfone nanocomposite are shown in Figure 6 and 7. It was observed that by reinforcing the chosen polymer, i.e., polyethersulfone, with ZnNiFe nanoparticles, the roughness of the thin film was noticeably reduced. By observing the images, we conclude that thickness of the thin film decreases with the addition of nanoparticles. The thickness was consistency for the thin films of pure PES and 1.3 μm and for the thin films of the PES nanocomposite it was 0.83μm. The surface texture, or morphology, of the thin films prepared for this research study is shown in Figure 8 and 9. Morphology of the pure polymer thin film was found to be of grainy texture, whereas morphology of the as-synthesized polymer nanocomposite was noticeably less granular when compared to pure polyethersulfone (PES). Also, we did observe an overall change in grain structure. The average grain size for pure PES was 1.0μm, whereas for the PES nanocomposite the average grain size was 0.8μm. This suggests that the approach chosen and used for the addition of nanoparticles to polymer polyethersulfone (PES) is correct and desirable.
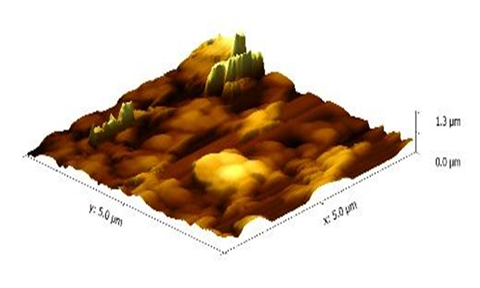
Figure 6 Atomic force microscope (AFM) 3-D (three-Dimensional) image of pure polyethersulfone (PES).
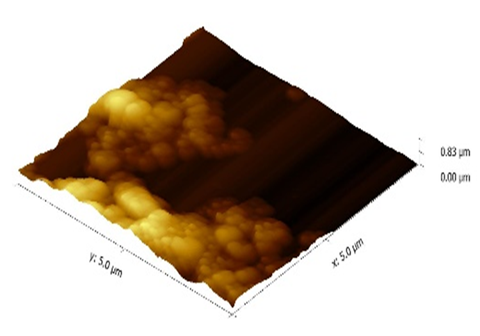
Figure 7 Atomic force microscope three-dimensional image of the polyethersulfone (PES) nanocomposite.
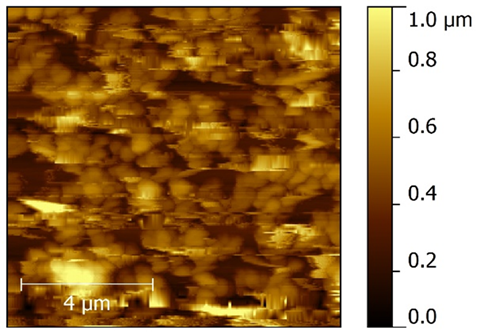
Figure 8 Atomic Force Microscope morphology of pure polyethersulfone (PES).
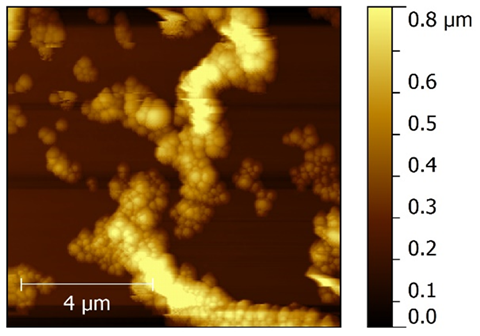
Figure 9 Atomic force microscope (AFM) morphology of the polyethersulfone (PES) nanocomposite.

Scanning electron microscopy observations

The Scanning Electron Microscope (SEM) images of pure polyethersulfone (PES), pure ZnNiFe nanoparticles, and PES + ZnNiFe nanocomposite are shown in Figure 1012. Size of PES is 2μm and size of the ZnNiFe nanoparticle is 500 nm. The difference in grain size can be distinctly seen. A noticeable change in morphology occurs when ZnNiFe nanoparticles are added to the polymer (PES) and the size is around 1μm as shown in Figure 12. For pure polyethersulfone (PES) (Figure 10), it is granular in structure with a lot of spacing, or less networking, within the structure. This reveals a lot of space between the particles. However, for the pure nanoparticle, it is a highly networked structure with not many gaps or “open” spaces. The addition of ZnNiFe nanoparticles to the chosen polymer (polyethersulfone), we did observe a network-like structure with no gaps. Further, the network was both pronounced and noticeable.
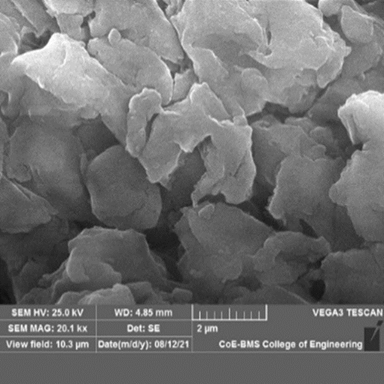
Figure 10 Scanning electron microscope image of pure polyethersulfone.
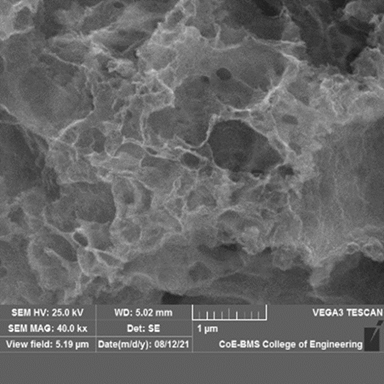
Figure 11 Scanning electron microscope image of pure Zn0.5Ni0.5Fe2O4.
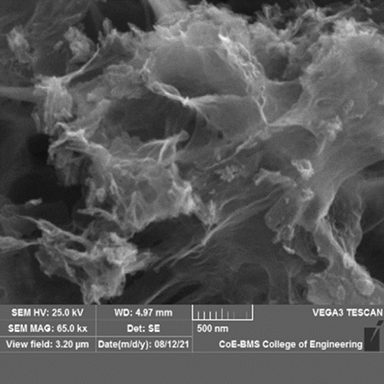
Figure 12 Scanning electron micrograph of the polyethersulfone + Zn0.5Ni0.5Fe2O4 nanocomposite.

Estimation of the ground state dipole moment and excited state dipole moment of polyethersulfone (PES)

The PES molecule's typical absorption and fluorescence spectra were recorded in different solvents and are shown in Figure 13 and 14. Values of the dielectric constantand (ε) MathType@MTEF@5@5@+= feaagKart1ev2aaatCvAUfeBSjuyZL2yd9gzLbvyNv2CaerbuLwBLn hiov2DGi1BTfMBaeXatLxBI9gBaerbujxzIv3yOvgDG00uaerbd9wD YLwzYbItLDharqqtubsr4rNCHbGeaGqkY=MjYJH8sqFD0xXdHaVhbb f9v8qqaqFr0xc9pk0xbba9q8WqFfea0=yr0RYxir=Jbba9q8aq0=yq =He9q8qqQ8frFve9Fve9Ff0dmeaabaqaciGacaGaaeaadaabaeaafa aakeaacaGGOaaeaaaaaaaaa8qacqaH1oqzcaGGPaaaaa@3F62@ polarity parameters of the different solvents are summarized in Table 3. The solvatochromic data of polyethersulfone (PES) in the different solvents are summarized in Table 4. It is observed that the fluorescence wavelength maxima undergo a bathochromic effect on increasing solvent polarity. This can essentially be attributed to a ππ* MathType@MTEF@5@5@+= feaagKart1ev2aaatCvAUfeBSjuyZL2yd9gzLbvyNv2CaerbuLwBLn hiov2DGi1BTfMBaeXatLxBI9gBaerbujxzIv3yOvgDG00uaerbd9wD YLwzYbItLDharqqtubsr4rNCHbGeaGqkY=MjYJH8sqFD0xXdHaVhbb f9v8qqaqFr0xc9pk0xbba9q8WqFfea0=yr0RYxir=Jbba9q8aq0=yq =He9q8qqQ8frFve9Fve9Ff0dmeaabaqaciGacaGaaeaadaabaeaafa aakeaaqaaaaaaaaaWdbiabec8aWjabgkziUkabec8aWjaacQcaaaa@4277@ transition at the spectral level. A greater magnitude of Stokes shift reveals geometry of the excited state to be different from that of the ground state coupled with the nature of intermolecular charge transfer (ICT) of the excited state. The plots of Bilot-Kawaski’s, Lippert’s, Bakshiev’s, and Kawski-Chamma-Viallet’s were plotted using the Origin 8 software and is as shown in Figure 1518. A statistical treatment of the correlations for solvent spectral shifts of the PES molecule is provided in Table 5. For the Bilot-Kawaski method, values for μ g MathType@MTEF@5@5@+= feaagKart1ev2aaatCvAUfeBSjuyZL2yd9gzLbvyNv2CaerbuLwBLn hiov2DGi1BTfMBaeXatLxBI9gBaerbujxzIv3yOvgDG00uaerbd9wD YLwzYbItLDharqqtubsr4rNCHbGeaGqkY=MjYJH8sqFD0xXdHaVhbb f9v8qqaqFr0xc9pk0xbba9q8WqFfea0=yr0RYxir=Jbba9q8aq0=yq =He9q8qqQ8frFve9Fve9Ff0dmeaabaqaciGacaGaaeaadaabaeaafa aakeaaqaaaaaaaaaWdbiabeY7aT9aadaWgaaWcbaWdbiaadEgaa8aa beaaaaa@3F5E@ and μ e MathType@MTEF@5@5@+= feaagKart1ev2aaatCvAUfeBSjuyZL2yd9gzLbvyNv2CaerbuLwBLn hiov2DGi1BTfMBaeXatLxBI9gBaerbujxzIv3yOvgDG00uaerbd9wD YLwzYbItLDharqqtubsr4rNCHbGeaGqkY=MjYJH8sqFD0xXdHaVhbb f9v8qqaqFr0xc9pk0xbba9q8WqFfea0=yr0RYxir=Jbba9q8aq0=yq =He9q8qqQ8frFve9Fve9Ff0dmeaabaqaciGacaGaaeaadaabaeaafa aakeaaqaaaaaaaaaWdbiabeY7aT9aadaWgaaWcbaWdbiaadwgaa8aa beaaaaa@3F5C@ were obtained and 3.623 D and 6.859 D for a molecule of the chosen polymer (polyethersulfone). The dipole moment in the ground state and dipole moment in the excited state ( μ e ) MathType@MTEF@5@5@+= feaagKart1ev2aaatCvAUfeBSjuyZL2yd9gzLbvyNv2CaerbuLwBLn hiov2DGi1BTfMBaeXatLxBI9gBaerbujxzIv3yOvgDG00uaerbd9wD YLwzYbItLDharqqtubsr4rNCHbGeaGqkY=MjYJH8sqFD0xXdHaVhbb f9v8qqaqFr0xc9pk0xbba9q8WqFfea0=yr0RYxir=Jbba9q8aq0=yq =He9q8qqQ8frFve9Fve9Ff0dmeaabaqaciGacaGaaeaadaabaeaafa aakeaaqaaaaaaaaaWdbiaacIcacqaH8oqBpaWaaSbaaSqaa8qacaWG LbaapaqabaGccaGGPaaaaa@40BF@ was determined using Equation (17) and Equation (19) and found to be 1.916 D and 5.153 D for a molecule of PES. The dipole moment for the excited state obtained from use of the Lippert’s equation, Bakshiev’s equation, and Kawski-Chamma-Viallet’s equation are 7.401 D, 5.153 D, and 6.699 D for a molecule of PES. The angle between μ g MathType@MTEF@5@5@+= feaagKart1ev2aaatCvAUfeBSjuyZL2yd9gzLbvyNv2CaerbuLwBLn hiov2DGi1BTfMBaeXatLxBI9gBaerbujxzIv3yOvgDG00uaerbd9wD YLwzYbItLDharqqtubsr4rNCHbGeaGqkY=MjYJH8sqFD0xXdHaVhbb f9v8qqaqFr0xc9pk0xbba9q8WqFfea0=yr0RYxir=Jbba9q8aq0=yq =He9q8qqQ8frFve9Fve9Ff0dmeaabaqaciGacaGaaeaadaabaeaafa aakeaaqaaaaaaaaaWdbiabeY7aT9aadaWgaaWcbaWdbiaadEgaa8aa beaaaaa@3F5E@ and μ e MathType@MTEF@5@5@+= feaagKart1ev2aaatCvAUfeBSjuyZL2yd9gzLbvyNv2CaerbuLwBLn hiov2DGi1BTfMBaeXatLxBI9gBaerbujxzIv3yOvgDG00uaerbd9wD YLwzYbItLDharqqtubsr4rNCHbGeaGqkY=MjYJH8sqFD0xXdHaVhbb f9v8qqaqFr0xc9pk0xbba9q8WqFfea0=yr0RYxir=Jbba9q8aq0=yq =He9q8qqQ8frFve9Fve9Ff0dmeaabaqaciGacaGaaeaadaabaeaafa aakeaaqaaaaaaaaaWdbiabeY7aT9aadaWgaaWcbaWdbiaadwgaa8aa beaaaaa@3F5C@ , i.e., ϕ MathType@MTEF@5@5@+= feaagKart1ev2aaatCvAUfeBSjuyZL2yd9gzLbvyNv2CaerbuLwBLn hiov2DGi1BTfMBaeXatLxBI9gBaerbujxzIv3yOvgDG00uaerbd9wD YLwzYbItLDharqqtubsr4rNCHbGeaGqkY=MjYJH8sqFD0xXdHaVhbb f9v8qqaqFr0xc9pk0xbba9q8WqFfea0=yr0RYxir=Jbba9q8aq0=yq =He9q8qqQ8frFve9Fve9Ff0dmeaabaqaciGacaGaaeaadaabaeaafa aakeaaqaaaaaaaaaWdbiabew9aMbaa@3E2A@ , was found to be 8 degrees for a molecule of PES. These values are neatly summarized in Table 6. From this table (Table 6) it is observed that values of the excited-state dipole moment are noticeably greater than that of the ground state dipole moment for a molecule of the polymer polyethersulfone (PES). From these observations, we conclude that a molecule of the chosen polymer (PES) is more polar in the excited state than in the ground state. However, the values of μ e MathType@MTEF@5@5@+= feaagKart1ev2aaatCvAUfeBSjuyZL2yd9gzLbvyNv2CaerbuLwBLn hiov2DGi1BTfMBaeXatLxBI9gBaerbujxzIv3yOvgDG00uaerbd9wD YLwzYbItLDharqqtubsr4rNCHbGeaGqkY=MjYJH8sqFD0xXdHaVhbb f9v8qqaqFr0xc9pk0xbba9q8WqFfea0=yr0RYxir=Jbba9q8aq0=yq =He9q8qqQ8frFve9Fve9Ff0dmeaabaqaciGacaGaaeaadaabaeaafa aakeaaqaaaaaaaaaWdbiabeY7aT9aadaWgaaWcbaWdbiaadwgaa8aa beaaaaa@3F5C@ are marginally different for the different models chosen and studied. This is essentially because the different models use different assumptions for the development of their model. It is observed that an increase in dipole moment in the excited state can be attributed to specific solvent effects, such as the hydrogen bonding effect.
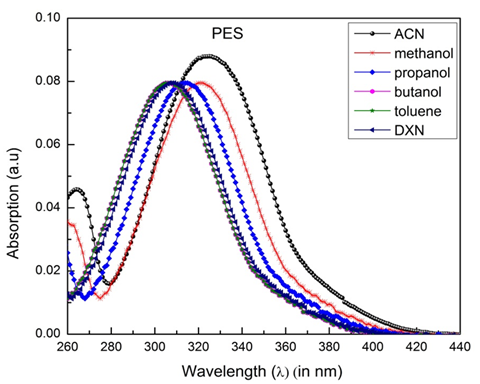
Figure 13 The absorption spectra of the polyethersulfone (PES) molecule in different solvents at room temperature.
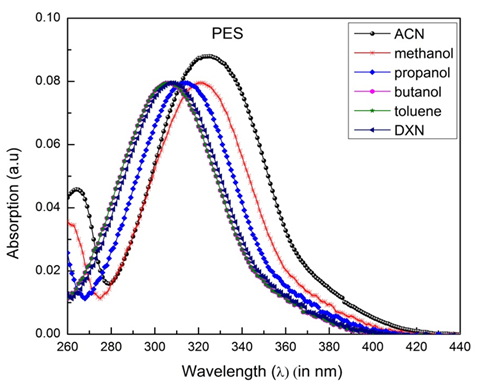
Figure 14 The fluorescence spectra of a molecule of polyethersulfone (PES) in the different solvents at room temperature.
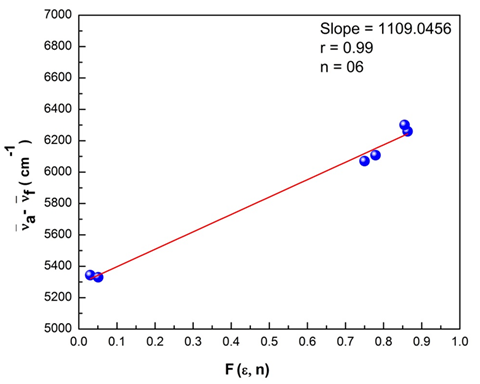
Figure 15 The stoke’s shift as a function of F (e, n) for the polyethersulfone (PES) molecule.
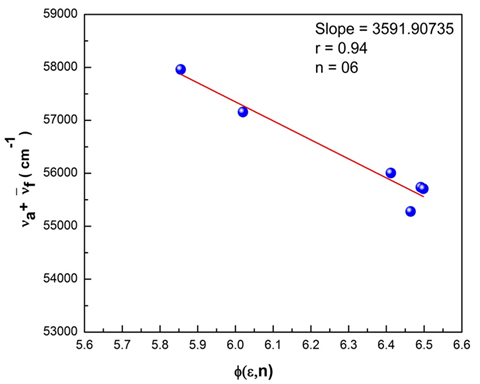
Figure 16 The Stoke’s shift as a function of f(e, n) for the polyethersulfone (PES) molecule.
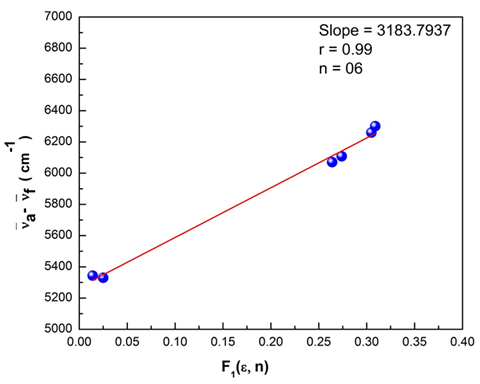
Figure 17 Lippert’s plot for the polyethersulfone (PES) molecule.
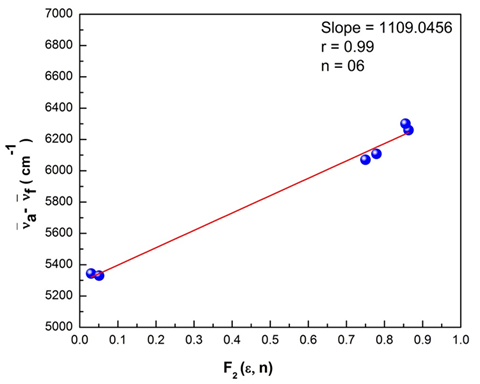
Figure 18 Bakshiev’s plot for the polyethersulfone (PES) molecule.

Sl. No.

Solvents

ε MathType@MTEF@5@5@+= feaagKart1ev2aaatCvAUfeBSjuyZL2yd9gzLbvyNv2CaerbuLwBLn hiov2DGi1BTfMBaeXatLxBI9gBaerbujxzIv3yOvgDG00uaerbd9wD YLwzYbItLDharqqtubsr4rNCHbGeaGqkY=MjYJH8sqFD0xXdHaVhbb f9v8qqaqFr0xc9pk0xbba9q8WqFfea0=yr0RYxir=Jbba9q8aq0=yq =He9q8qqQ8frFve9Fve9Ff0dmeaabaqaciGacaGaaeaadaabaeaafa aakeaaqaaaaaaaaaWdbiabew7aLbaa@3E09@

f 1 MathType@MTEF@5@5@+= feaagKart1ev2aaatCvAUfeBSjuyZL2yd9gzLbvyNv2CaerbuLwBLn hiov2DGi1BTfMBaeXatLxBI9gBaerbujxzIv3yOvgDG00uaerbd9wD YLwzYbItLDharqqtubsr4rNCHbGeaGqkY=MjYJH8sqFD0xXdHaVhbb f9v8qqaqFr0xc9pk0xbba9q8WqFfea0=yr0RYxir=Jbba9q8aq0=yq =He9q8qqQ8frFve9Fve9Ff0dmeaabaqaciGacaGaaeaadaabaeaafa aakeaaieWaqaaaaaaaaaWdbiaa=zgapaWaaSbaaSqaa8qacaqGXaaa paqabaaaaa@3E63@

f 2 MathType@MTEF@5@5@+= feaagKart1ev2aaatCvAUfeBSjuyZL2yd9gzLbvyNv2CaerbuLwBLn hiov2DGi1BTfMBaeXatLxBI9gBaerbujxzIv3yOvgDG00uaerbd9wD YLwzYbItLDharqqtubsr4rNCHbGeaGqkY=MjYJH8sqFD0xXdHaVhbb f9v8qqaqFr0xc9pk0xbba9q8WqFfea0=yr0RYxir=Jbba9q8aq0=yq =He9q8qqQ8frFve9Fve9Ff0dmeaabaqaciGacaGaaeaadaabaeaafa aakeaaieWaqaaaaaaaaaWdbiaa=zgapaWaaSbaaSqaa8qacaqGYaaa paqabaaaaa@3E64@

f 3 MathType@MTEF@5@5@+= feaagKart1ev2aaatCvAUfeBSjuyZL2yd9gzLbvyNv2CaerbuLwBLn hiov2DGi1BTfMBaeXatLxBI9gBaerbujxzIv3yOvgDG00uaerbd9wD YLwzYbItLDharqqtubsr4rNCHbGeaGqkY=MjYJH8sqFD0xXdHaVhbb f9v8qqaqFr0xc9pk0xbba9q8WqFfea0=yr0RYxir=Jbba9q8aq0=yq =He9q8qqQ8frFve9Fve9Ff0dmeaabaqaciGacaGaaeaadaabaeaafa aakeaaieWaqaaaaaaaaaWdbiaa=zgapaWaaSbaaSqaa8qacaqGZaaa paqabaaaaa@3E65@

g( n ) MathType@MTEF@5@5@+= feaagKart1ev2aaatCvAUfeBSjuyZL2yd9gzLbvyNv2CaerbuLwBLn hiov2DGi1BTfMBaeXatLxBI9gBaerbujxzIv3yOvgDG00uaerbd9wD YLwzYbItLDharqqtubsr4rNCHbGeaGqkY=MjYJH8sqFD0xXdHaVhbb f9v8qqaqFr0xc9pk0xbba9q8WqFfea0=yr0RYxir=Jbba9q8aq0=yq =He9q8qqQ8frFve9Fve9Ff0dmeaabaqaciGacaGaaeaadaabaeaafa aakeaaieWaqaaaaaaaaaWdbiaa=DgadaqadaWdaeaapeGaa8NBaaGa ayjkaiaawMcaaaaa@3FED@

( n,ε ) MathType@MTEF@5@5@+= feaagKart1ev2aaatCvAUfeBSjuyZL2yd9gzLbvyNv2CaerbuLwBLn hiov2DGi1BTfMBaeXatLxBI9gBaerbujxzIv3yOvgDG00uaerbd9wD YLwzYbItLDharqqtubsr4rNCHbGeaGqkY=MjYJH8sqFD0xXdHaVhbb f9v8qqaqFr0xc9pk0xbba9q8WqFfea0=yr0RYxir=Jbba9q8aq0=yq =He9q8qqQ8frFve9Fve9Ff0dmeaabaqaciGacaGaaeaadaabaeaafa aakeaaqaaaaaaaaaWdbiabgwGigpaabmaapaqaaGqad8qacaWFUbGa aiilaiabew7aLbGaayjkaiaawMcaaaaa@42D5@

1

ACN

37.5

0.305

0.863

0.666

2.8

6.464

2

methanol

32.7

0.309

0.855

0.651

2.778

6.412

3

propanol

20.33

0.274

0.779

0.652

2.856

6.491

4

butanol

17.5

0.264

0.75

0.646

2.874

6.498

5

toluene

2.38

0.014

0.03

0.35

2.995

6.02

6

DXN

2.25

0.025

0.051

0.311

2.902

5.855

Table 3  The values of dielectric constant and polarity parameters of different solvents

Sl. no.

Solvents

λ a ( nm ) MathType@MTEF@5@5@+= feaagKart1ev2aaatCvAUfeBSjuyZL2yd9gzLbvyNv2CaerbuLwBLn hiov2DGi1BTfMBaeXatLxBI9gBaerbujxzIv3yOvgDG00uaerbd9wD YLwzYbItLDharqqtubsr4rNCHbGeaGqkY=MjYJH8sqFD0xXdHaVhbb f9v8qqaqFr0xc9pk0xbba9q8WqFfea0=yr0RYxir=Jbba9q8aq0=yq =He9q8qqQ8frFve9Fve9Ff0dmeaabaqaciGacaGaaeaadaabaeaafa aakeaaqaaaaaaaaaWdbiabeU7aS9aadaWgaaWcbaWdbiaadggaa8aa beaakmaabmaabaWdbiaad6gacaWGTbaapaGaayjkaiaawMcaaaaa@42ED@ λ f ( nm ) MathType@MTEF@5@5@+= feaagKart1ev2aaatCvAUfeBSjuyZL2yd9gzLbvyNv2CaerbuLwBLn hiov2DGi1BTfMBaeXatLxBI9gBaerbujxzIv3yOvgDG00uaerbd9wD YLwzYbItLDharqqtubsr4rNCHbGeaGqkY=MjYJH8sqFD0xXdHaVhbb f9v8qqaqFr0xc9pk0xbba9q8WqFfea0=yr0RYxir=Jbba9q8aq0=yq =He9q8qqQ8frFve9Fve9Ff0dmeaabaqaciGacaGaaeaadaabaeaafa aakeaaqaaaaaaaaaWdbiabeU7aS9aadaWgaaWcbaWdbiaadAgaa8aa beaakmaabmaabaWdbiaad6gacaWGTbaapaGaayjkaiaawMcaaaaa@42F2@

ν ¯ a ( c m 1 ) MathType@MTEF@5@5@+= feaagKart1ev2aaatCvAUfeBSjuyZL2yd9gzLbvyNv2CaerbuLwBLn hiov2DGi1BTfMBaeXatLxBI9gBaerbujxzIv3yOvgDG00uaerbd9wD YLwzYbItLDharqqtubsr4rNCHbGeaGqkY=MjYJH8sqFD0xXdHaVhbb f9v8qqaqFr0xc9pk0xbba9q8WqFfea0=yr0RYxir=Jbba9q8aq0=yq =He9q8qqQ8frFve9Fve9Ff0dmeaabaqaciGacaGaaeaadaabaeaafa aakeaaieWaqaaaaaaaaaWdbiqa=17apaGbaebadaWgaaWcbaWdbiaa =fgaa8aabeaakiaaykW7daqadaqaa8qacaWHJbGaaCyBa8aadaahaa Wcbeqaa8qacqGHsislcaWHXaaaaaGcpaGaayjkaiaawMcaaaaa@461F@

ν ¯ f ( c m 1 ) MathType@MTEF@5@5@+= feaagKart1ev2aaatCvAUfeBSjuyZL2yd9gzLbvyNv2CaerbuLwBLn hiov2DGi1BTfMBaeXatLxBI9gBaerbujxzIv3yOvgDG00uaerbd9wD YLwzYbItLDharqqtubsr4rNCHbGeaGqkY=MjYJH8sqFD0xXdHaVhbb f9v8qqaqFr0xc9pk0xbba9q8WqFfea0=yr0RYxir=Jbba9q8aq0=yq =He9q8qqQ8frFve9Fve9Ff0dmeaabaqaciGacaGaaeaadaabaeaafa aakeaaieWaqaaaaaaaaaWdbiqa=17apaGbaebadaWgaaWcbaWdbiaa =zgaa8aabeaakiaaykW7daqadaqaa8qacaWHJbGaaCyBa8aadaahaa Wcbeqaa8qacqGHsislcaWHXaaaaaGcpaGaayjkaiaawMcaaaaa@4624@ ν ¯ a ν ¯ f ( c m 1 ) MathType@MTEF@5@5@+= feaagKart1ev2aaatCvAUfeBSjuyZL2yd9gzLbvyNv2CaerbuLwBLn hiov2DGi1BTfMBaeXatLxBI9gBaerbujxzIv3yOvgDG00uaerbd9wD YLwzYbItLDharqqtubsr4rNCHbGeaGqkY=MjYJH8sqFD0xXdHaVhbb f9v8qqaqFr0xc9pk0xbba9q8WqFfea0=yr0RYxir=Jbba9q8aq0=yq =He9q8qqQ8frFve9Fve9Ff0dmeaabaqaciGacaGaaeaadaabaeaafa aakeaaieWaqaaaaaaaaaWdbiqa=17apaGbaebadaWgaaWcbaWdbiaa =fgaa8aabeaak8qacqGHsislceWF9oWdayaaraWaaSbaaSqaa8qaca WFMbaapaqabaGccaaMc8+aaeWaaeaapeGaaC4yaiaah2gapaWaaWba aSqabeaapeGaeyOeI0IaaCymaaaaaOWdaiaawIcacaGLPaaaaaa@49C0@ ν ¯ a + ν ¯ f )( c m 1 ) MathType@MTEF@5@5@+= feaagKart1ev2aaatCvAUfeBSjuyZL2yd9gzLbvyNv2CaerbuLwBLn hiov2DGi1BTfMBaeXatLxBI9gBaerbujxzIv3yOvgDG00uaerbd9wD YLwzYbItLDharqqtubsr4rNCHbGeaGqkY=MjYJH8sqFD0xXdHaVhbb f9v8qqaqFr0xc9pk0xbba9q8WqFfea0=yr0RYxir=Jbba9q8aq0=yq =He9q8qqQ8frFve9Fve9Ff0dmeaabaqaciGacaGaaeaadaabaeaafa aakeaaieWaqaaaaaaaaaWdbiqa=17apaGbaebadaWgaaWcbaWdbiaa =fgaa8aabeaak8qacqGHRaWkceWF9oWdayaaraWaaSbaaSqaa8qaca WFMbaapaqabaGcpeGaaiykaiaaykW7paWaaeWaaeaapeGaaC4yaiaa h2gapaWaaWbaaSqabeaapeGaeyOeI0IaaCymaaaaaOWdaiaawIcaca GLPaaaaaa@4A81@ ( ν ¯ a + ν ¯ f ) 2 ( c m 1 ) MathType@MTEF@5@5@+= feaagKart1ev2aaatCvAUfeBSjuyZL2yd9gzLbvyNv2CaerbuLwBLn hiov2DGi1BTfMBaeXatLxBI9gBaerbujxzIv3yOvgDG00uaerbd9wD YLwzYbItLDharqqtubsr4rNCHbGeaGqkY=MjYJH8sqFD0xXdHaVhbb f9v8qqaqFr0xc9pk0xbba9q8WqFfea0=yr0RYxir=Jbba9q8aq0=yq =He9q8qqQ8frFve9Fve9Ff0dmeaabaqaciGacaGaaeaadaabaeaafa aakeaaqaaaaaaaaaWdbmaalaaapaqaa8qadaqadaWdaeaaieWapeGa b8xVd8aagaqeamaaBaaaleaapeGaa8xyaaWdaeqaaOWdbiabgUcaRi qa=17apaGbaebadaWgaaWcbaWdbiaa=zgaa8aabeaaaOWdbiaawIca caGLPaaaa8aabaWdbiaabkdaaaWdamaabmaabaWdbiaahogacaWHTb WdamaaCaaaleqabaWdbiabgkHiTiaahgdaaaaak8aacaGLOaGaayzk aaaaaa@4AF4@

1

ACN

325

408

30769.2308

24509.8039

6259.42685

55279.0347

27639.5174

2

methanol

321

402

31152.648

24852.186

6300.4616

56004.834

28002.417

3

propanol

323

403

30921.6658

24813.8958

6107.77

55735.5616

27867.7808

4

butanol

316

391

31645.5696

25575.4476

6070.12205

57221.0172

28610.5086

5

toluene

320

386

31250

25906.7357

5343.2643

57156.7357

28578.3679

6

DXN

316

380

31645.5696

26315.7895

5329.78013

57961.3591

28980.6795

Table 4  Solvatochromic data for a molecule of polyethersulfone (PES) in the different solvents

Correlations

Slope (m)

Correlation factor (r)

Number of solvents (n)

Bilot Kawaski’s correlation

3591.907

0.94

6

Lippert’s

3183.793

0.99

6

Bakshiev’s

1109.045

0.99

6

Kawski-Chamma-Viallet’s

2421.835

0.87

6

Table 5  Statistical treatment of the correlations of solvents spectral shifts for a molecule of polyethersulfone (PES)

Compound

Radius'r',( Å ) MathType@MTEF@5@5@+= feaagKart1ev2aaatCvAUfeBSjuyZL2yd9gzLbvyNv2CaerbuLwBLn hiov2DGi1BTfMBaeXatLxBI9gBaerbujxzIv3yOvgDG00uaerbd9wD YLwzYbItLDharqqtubsr4rNCHbGeaGqkY=MjYJH8sqFD0xXdHaVhbb f9v8qqaqFr0xc9pk0xbba9q8WqFfea0=yr0RYxir=Jbba9q8aq0=yq =He9q8qqQ8frFve9Fve9Ff0dmeaabaqaciGacaGaaeaadaabaeaafa aakeaaieWaqaaaaaaaaaWdbiaa=jfacaWFHbGaa8hzaiaa=LgacaWF 1bGaa83CaiaaykW7caWFNaGaa8NCaiaa=DcacaGGSaWaaeWaa8aaba Wdbiaa=vmaaiaawIcacaGLPaaaaaa@4948@

μ g a ( D ) MathType@MTEF@5@5@+= feaagKart1ev2aaatCvAUfeBSjuyZL2yd9gzLbvyNv2CaerbuLwBLn hiov2DGi1BTfMBaeXatLxBI9gBaerbujxzIv3yOvgDG00uaerbd9wD YLwzYbItLDharqqtubsr4rNCHbGeaGqkY=MjYJH8sqFD0xXdHaVhbb f9v8qqaqFr0xc9pk0xbba9q8WqFfea0=yr0RYxir=Jbba9q8aq0=yq =He9q8qqQ8frFve9Fve9Ff0dmeaabaqaciGacaGaaeaadaabaeaafa aakeaacqaH8oqBdaWgaaWcbaacbmaeaaaaaaaaa8qacaWFNbaapaqa baGcdaahaaWcbeqaa8qacaWFHbaaaOWdaiaaykW7peWaaeWaa8aaba Wdbiaa=reaaiaawIcacaGLPaaaaaa@4491@

μ g b ( D ) MathType@MTEF@5@5@+= feaagKart1ev2aaatCvAUfeBSjuyZL2yd9gzLbvyNv2CaerbuLwBLn hiov2DGi1BTfMBaeXatLxBI9gBaerbujxzIv3yOvgDG00uaerbd9wD YLwzYbItLDharqqtubsr4rNCHbGeaGqkY=MjYJH8sqFD0xXdHaVhbb f9v8qqaqFr0xc9pk0xbba9q8WqFfea0=yr0RYxir=Jbba9q8aq0=yq =He9q8qqQ8frFve9Fve9Ff0dmeaabaqaciGacaGaaeaadaabaeaafa aakeaacqaH8oqBdaWgaaWcbaacbmaeaaaaaaaaa8qacaWFNbaapaqa baGcdaahaaWcbeqaa8qacaWFIbaaaOWdaiaaykW7peWaaeWaa8aaba Wdbiaa=reaaiaawIcacaGLPaaaaaa@4492@

μ e c ( D ) MathType@MTEF@5@5@+= feaagKart1ev2aaatCvAUfeBSjuyZL2yd9gzLbvyNv2CaerbuLwBLn hiov2DGi1BTfMBaeXatLxBI9gBaerbujxzIv3yOvgDG00uaerbd9wD YLwzYbItLDharqqtubsr4rNCHbGeaGqkY=MjYJH8sqFD0xXdHaVhbb f9v8qqaqFr0xc9pk0xbba9q8WqFfea0=yr0RYxir=Jbba9q8aq0=yq =He9q8qqQ8frFve9Fve9Ff0dmeaabaqaciGacaGaaeaadaabaeaafa aakeaacqaH8oqBdaWgaaWcbaacbmaeaaaaaaaaa8qacaWFLbaapaqa baGcdaahaaWcbeqaaiaadogaaaGccaaMc8+dbmaabmaapaqaa8qaca WFebaacaGLOaGaayzkaaaaaa@4476@

μ e d ( D ) MathType@MTEF@5@5@+= feaagKart1ev2aaatCvAUfeBSjuyZL2yd9gzLbvyNv2CaerbuLwBLn hiov2DGi1BTfMBaeXatLxBI9gBaerbujxzIv3yOvgDG00uaerbd9wD YLwzYbItLDharqqtubsr4rNCHbGeaGqkY=MjYJH8sqFD0xXdHaVhbb f9v8qqaqFr0xc9pk0xbba9q8WqFfea0=yr0RYxir=Jbba9q8aq0=yq =He9q8qqQ8frFve9Fve9Ff0dmeaabaqaciGacaGaaeaadaabaeaafa aakeaacqaH8oqBdaWgaaWcbaacbmaeaaaaaaaaa8qacaWFLbaapaqa baGcdaahaaWcbeqaaiaadsgaaaGccaaMc8+dbmaabmaapaqaa8qaca WFebaacaGLOaGaayzkaaaaaa@4477@

μ e e ( D ) MathType@MTEF@5@5@+= feaagKart1ev2aaatCvAUfeBSjuyZL2yd9gzLbvyNv2CaerbuLwBLn hiov2DGi1BTfMBaeXatLxBI9gBaerbujxzIv3yOvgDG00uaerbd9wD YLwzYbItLDharqqtubsr4rNCHbGeaGqkY=MjYJH8sqFD0xXdHaVhbb f9v8qqaqFr0xc9pk0xbba9q8WqFfea0=yr0RYxir=Jbba9q8aq0=yq =He9q8qqQ8frFve9Fve9Ff0dmeaabaqaciGacaGaaeaadaabaeaafa aakeaacqaH8oqBdaWgaaWcbaacbmaeaaaaaaaaa8qacaWFLbaapaqa baGcdaahaaWcbeqaaiaadwgaaaGccaaMc8+dbmaabmaapaqaa8qaca WFebaacaGLOaGaayzkaaaaaa@4478@

μ e f ( D ) MathType@MTEF@5@5@+= feaagKart1ev2aaatCvAUfeBSjuyZL2yd9gzLbvyNv2CaerbuLwBLn hiov2DGi1BTfMBaeXatLxBI9gBaerbujxzIv3yOvgDG00uaerbd9wD YLwzYbItLDharqqtubsr4rNCHbGeaGqkY=MjYJH8sqFD0xXdHaVhbb f9v8qqaqFr0xc9pk0xbba9q8WqFfea0=yr0RYxir=Jbba9q8aq0=yq =He9q8qqQ8frFve9Fve9Ff0dmeaabaqaciGacaGaaeaadaabaeaafa aakeaacqaH8oqBdaWgaaWcbaacbmaeaaaaaaaaa8qacaWFLbaapaqa baGcdaahaaWcbeqaaiaadAgaaaGccaaMc8+dbmaabmaapaqaa8qaca WFebaacaGLOaGaayzkaaaaaa@4479@

μ e g ( D ) MathType@MTEF@5@5@+= feaagKart1ev2aaatCvAUfeBSjuyZL2yd9gzLbvyNv2CaerbuLwBLn hiov2DGi1BTfMBaeXatLxBI9gBaerbujxzIv3yOvgDG00uaerbd9wD YLwzYbItLDharqqtubsr4rNCHbGeaGqkY=MjYJH8sqFD0xXdHaVhbb f9v8qqaqFr0xc9pk0xbba9q8WqFfea0=yr0RYxir=Jbba9q8aq0=yq =He9q8qqQ8frFve9Fve9Ff0dmeaabaqaciGacaGaaeaadaabaeaafa aakeaacqaH8oqBdaWgaaWcbaacbmaeaaaaaaaaa8qacaWFLbaapaqa baGcdaahaaWcbeqaaiaadEgaaaGccaaMc8+dbmaabmaapaqaa8qaca WFebaacaGLOaGaayzkaaaaaa@447A@

Δ μ h ( D ) MathType@MTEF@5@5@+= feaagKart1ev2aaatCvAUfeBSjuyZL2yd9gzLbvyNv2CaerbuLwBLn hiov2DGi1BTfMBaeXatLxBI9gBaerbujxzIv3yOvgDG00uaerbd9wD YLwzYbItLDharqqtubsr4rNCHbGeaGqkY=MjYJH8sqFD0xXdHaVhbb f9v8qqaqFr0xc9pk0xbba9q8WqFfea0=yr0RYxir=Jbba9q8aq0=yq =He9q8qqQ8frFve9Fve9Ff0dmeaabaqaciGacaGaaeaadaabaeaafa aakeaaqaaaaaaaaaWdbiabfs5aejabeY7aTnaaCaaaleqabaGaamiA aaaakiaaykW7daqadaWdaeaaieWapeGaa8hraaGaayjkaiaawMcaaa aa@44A6@

ϕ i MathType@MTEF@5@5@+= feaagKart1ev2aaatCvAUfeBSjuyZL2yd9gzLbvyNv2CaerbuLwBLn hiov2DGi1BTfMBaeXatLxBI9gBaerbujxzIv3yOvgDG00uaerbd9wD YLwzYbItLDharqqtubsr4rNCHbGeaGqkY=MjYJH8sqFD0xXdHaVhbb f9v8qqaqFr0xc9pk0xbba9q8WqFfea0=yr0RYxir=Jbba9q8aq0=yq =He9q8qqQ8frFve9Fve9Ff0dmeaabaqaciGacaGaaeaadaabaeaafa aakeaacqaHvpGzdaahaaWcbeqaaGqadabaaaaaaaaapeGaa8xAaaaa aaa@3F4D@

PES

4.546

3.623

1.916

6.859

5.153

7.401

5.153

6.699

5.485

80

Table 6  Ground state dipole moment and excited state dipole moment of the polyethersulfone (PES) molecule

Debye(D)=3.33564× 10 30 cm =  10 18 esu cm, MathType@MTEF@5@5@+= feaagKart1ev2aaatCvAUfeBSjuyZL2yd9gzLbvyNv2CaerbuLwBLn hiov2DGi1BTfMBaeXatLxBI9gBaerbujxzIv3yOvgDG00uaerbd9wD YLwzYbItLDharqqtubsr4rNCHbGeaGqkY=MjYJH8sqFD0xXdHaVhbb f9v8qqaqFr0xc9pk0xbba9q8WqFfea0=yr0RYxir=Jbba9q8aq0=yq =He9q8qqQ8frFve9Fve9Ff0dmeaabaqaciGacaGaaeaadaabaeaafa aakeaaqaaaaaaaaaWdbiaabseacaqGLbGaaeOyaiaabMhacaqGLbGa aGPaVlaabIcacaWGebGaaeykaiaaykW7cqGH9aqpcaaMc8Uaae4mai aab6cacaqGZaGaae4maiaabwdacaqG2aGaaeinaiabgEna0kaabgda caqGWaWdamaaCaaaleqabaWdbiabgkHiTiaabodacaqGWaaaaOGaae 4yaiaab2gacaqGGaGaeyypa0JaaeiiaiaabgdacaqGWaWdamaaCaaa leqabaWdbiabgkHiTiaabgdacaqG4aaaaOGaaeyzaiaabohacaqG1b GaaeiiaiaabogacaqGTbGaaeilaaaa@61FF@

athe ground state dipole moment calculated from Bilot-Kawaski Eqn. (4),

bthe ground state dipole moment calculated using Eqn. 17,

cthe excited state dipole moment calculated using Bilot-Kawaski Eqn. (5),

dthe excited state dipole moment calculated using Eqn.19,

ethe experimental excited state dipole moment calculated from Lippert’s equation,

fthe experimental excited state dipole moment calculated from Bakshiev equation,

gthe experimental excited state dipole moments calculated from Kawaski-Chamma-Viallet equation,

hthe change in dipole moments for μe and μg,

iThe angle between ground state dipole moment and excited state dipole moment.

Conclusion

In the present study, thin films of polyethersulfone (PES) reinforced with ZnNiFe nanoparticles was made possible using the technique of spin coating. Following are the key findings and observations.

  1. The Fourier Transform Infrared (FTIR) analysis reveals a 50-60 percent change in the functional group of the polymer nanocomposite when compared to pure PES thereby confirming the spin coating to have been done properly.
  2. X-ray diffraction (XRD) analysis reveals the formation and occurrence of crystallinity in the reinforced thin films.
  3. Atomic force microscopy [AFM] images of the composite thin films were studied and confirms the addition of ZnNiFe nanoparticles to pure polyethersulfone (PES) to be successful.
  4. Scanning electron microscope observations were used to see both a change in morphology and interaction between the reinforcing nanoparticles. This was clearly evident from the SEM observations.
  5. In addition, we observed a solvent effect to exist on both the absorption and fluorescence spectra of a molecule of polyethersulfone (PES) in the different solvents at room temperature. An observable shift in the emission spectra of pure PES in the different solvents confirms a ππ* MathType@MTEF@5@5@+= feaagKart1ev2aaatCvAUfeBSjuyZL2yd9gzLbvyNv2CaerbuLwBLn hiov2DGi1BTfMBaeXatLxBI9gBaerbujxzIv3yOvgDG00uaerbd9wD YLwzYbItLDharqqtubsr4rNCHbGeaGqkY=MjYJH8sqFD0xXdHaVhbb f9v8qqaqFr0xc9pk0xbba9q8WqFfea0=yr0RYxir=Jbba9q8aq0=yq =He9q8qqQ8frFve9Fve9Ff0dmeaabaqaciGacaGaaeaadaabaeaafa aakeaaqaaaaaaaaaWdbiabec8aWjabgkziUkabec8aWjaacQcaaaa@4277@ transition
  6. The ground state dipole moment and excited state dipole moment was calculated using the solvatochromic shift method. It is observed that the excited state dipole moment is greater than the ground state dipole moment for a molecule of PES. This indicates the excited state to be more polar than the ground state coupled with the solute's high charge-transfer characteristics.
  7. Based on observations, it is safe to conclude that the prepared thin films can be chosen for use in photonic applications, such as the following: (i) light emitting diode (LED), (ii) solid-state lighting, (iii) photovoltaics, (iv) bio-photonics, (v) sensing, and (vi) bioimaging.

Acknowledgments

None.

Funding

None.

Conflicts of interest

The authors declare that there is no conflict of interest.

References

  1. Almusawe J, Hassen TF, Rahman MA, et al. Linear optical properties of bromocresol green dye doped poly methyl methacrylate thin films. Iraqi J Science. 2018;59(1):299–306.
  2. Giridharan S, Shankar P. Optical characterization of PMMA doped with an organic polymer. IIOAB Journal. 2018;9:18–25.
  3. El-Bashir SM, Al Salih MS, Al-Faifi F, et al. Spectral Properties of PMMA thin films doped by perylene dyestuff for photosensitive greenhouse cladding applications. Polymers. 2019;11(3):494.
  4. Cho YJ, Lee JY. Thermally stable aromatic amine derivative with symmetrically substituted double spirobifluorene core as a hole transport material for green phosphorescent organic light-emitting diodes. Thin Solid Films. 2012;522:415–419.
  5. Kwang M, Abdelrasoul A, Doan H. Controlling polysulfone (PSF) fiber diameter and membrane morphology for an enhanced ultrafiltration performance using heat treatment. Results in Materials. 2019;2:100021.
  6. AL-Kadhemy MFH, Alwan EM. FTIR Spectrum of laser-dye fluorescence doped polymer PMMA films. Research and Reviews in Polymer. 2012;3(3):102–106.
  7. Esfahani ZH, Ghanipour M, Dorranian D. Effect of dye concentration on the optical properties of Red BS dye doped PVA film. J Theor Appl Phys. 2014;8:117–121.
  8. Khan MS, Qazi RA, Wahid MS. Miscibility studies of PVC/PMMA and PS/PMMA blends by dilute solution viscometry and FTIR. African J Pure Appl Chem. 2008;2(4):041–045.
  9. Melavanki RM, Sharma K, Muttannavar VT, et al. Examining the spectroscopic features and quantum chemical computations of a Quinoline derivative: Experimental and theoretical insights into the photophysical characteristics. Indian J Pure Appl Phys. 2020;58(7):503–515.
  10. Deepa HR, Melavanki RM, Mogurampelly S, et al. Quantum chemical and solvatochromic studies of biological active 1,3,4-thiadiazol coumarin derivatives. Chemical Data Collections. 2020;29:100516.
  11. Sharma K, Melavanki R, Sadasivuni KK. Quantum chemical computations and photo-physical spectral features studies of two coumarin compounds. Luminescence. 2020;35(6):845–862.
  12. Melavanki R, Sharma K, Muttannavar VT, et al. Quantum chemical computations, fluorescence spectral features and molecular docking of two biologically active heterocyclic class of compounds. J Photochemistry Photobiology A: Chemistry. 2021;404:112956.
  13. Koppal VV, Hebsur RK, Melavanki RM, et al. Solvent polarity and environment sensitive behavior of coumarin derivative. Macromolecular Symposia. 2020;392(1):1900200 .
  14. Melavanki R, Muddapur GV, Srinivasa HT, et al. Solvation, rotational dynamics, photophysical properties study of aromatic asymmetric di-ketones: An experimental and theoretical approach. J Molecular Liquids. 2021;337:116456.
  15. Melavanki R, Basanagouda MM, Mogurampelly S, et al. Computational and spectroscopic studies of biologically active coumarin-based fluorophores. Luminescence. 2021;36(3):769–787.
  16. Bilot L, Kawski A. On the theory of the influence of solvents on the electronic spectra of molecules. J Natural Research A. 1962;17(7):621–627.
  17. Kawski A, Kukliński B, Bojarski P. Photophysical properties and thermochromic shifts of electronic spectra of Nile Red in selected solvents. Excited states dipole moments. Chem Phys. 2009;359(1–3):58–64.
  18. Lippert E. Dipole moment and electronic structure of excited molecules. J Natural Sciences A. 1955;10(7):541–545.
  19. Bakhshiev NG. Universal intermolecular interactions and their effect on the position of the electronic spectra of molecules in 2-component solutions. 7. Theory (general case for isotopic solution). Optika i Spektroskopiya. 1964;16(5):821–832.
  20. Kawski A, Kukliński B, Bojarski P. Dipole moment of aniline in the excited S1 state from thermochromic effect on electronic spectra. Chem Phys Letters. 2005;415(4–6):251–255.
  21. Chamma A, Viallet P. Determination du moment dipolar d’une molecule dans un etat excite singulet. CR Acad Sci Paris Ser C. 1970;270:1901–1904.
  22. Yoon HJ, Bang KS, Lim JW, et al. Optical properties of zirconium oxide thin films for semi-transparent solar cell applications. J Mater Sci: Mater Electron. 2016;27:11358–11365.
  23. Ting YH, Liu CC, Park SM, et al. Surface roughening of polystyrene and poly (methyl methacrylate) in Ar/O2 plasma etching. Polymers. 2010;2(4):649–663.
  24. Patil RC, Ahmed SM, Shiigi H, et al. Investigation of some physicochemical properties of camphor sulfonic acid (CSA)–doped poly (o‐anisidine)(PoAN) and CSA‐doped PoAN/ABS composites. J Polymer Sci Part A: Polymer Chem. 1999;37(24):4596–4604.
  25. Zaharieva J, Milanova M. Modern technologies for creating the thin-film systems and coatings. Rijeka, Croatia. Janeza Trdine. 2017;9:51000.
  26. Koppal VV, Melavanki R, Kusanur R, et al. Analysis of fluorescence quenching of coumarin derivative under steady state and transient state methods. J Fluoresc. 2021;31(2):393–400.
  27. Christina G, Reitenbach J, Kreuzer LP, et al. PMMA-b-PNIPAM thin films display cononsolvency-driven response in mixed water/methanol vapours. Macromolecules. 2021;54(7):3517–3530.
  28. Ramesh GV, Porel S, Radhakrishnan TP. Polymer thin films embedded with in situ grown metal nanoparticles. Chem Soc Rev. 2009;38(9):2646–2656.
  29. Kusanur RA, Ghate M, Kulkarni MV. Synthesis of spiro [indolo-1, 5-benzodiazepines] from 3-acetyl coumarins for use as possible antianxiety agents. J Chem Sci. 2004;116(5):265–270.
  30. Yan Z, Yang Y, Cai X. Preparation of a ferroelectric composite film metal–organic framework/PVDF. J Polym Res. 2020;27:377.
  31. Kusanur R, Ghate M, Kulkarni M. Synthesis and biological activities of some substituted 4-{4-(1, 5-diphenyl-1H-pyrazol-3-yl) phenoxymethyl} coumarins. Indian J Het Chem. 2004;13(3):201–204.
  32. Waghmare M, Reddy KTV. Design and modal analysis of photonic crystal fiber for dispersion compensation over broadband range. J Microw Optoelectron Electromagn Appl. 2016;15(04):365–379.
  33. Wochnowski C, Metev S, Sepold G. UV–laser-assisted modification of the optical properties of polymethylmethacrylate. Appl Surf Sci. 2000;154–155:706–711.
  34. O’Regan BC, Durrant JR. Kinetic and energetic paradigms for dye-sensitized solar cells: moving from the ideal to the real. Acc Chem Res. 2009;42(11):1799–1808.
  35. Al-Saidi IADH, Sadik F. Synthesis and investigation of phenol red dye doped polymer films. Adv Mater Phys Chem. 2016;6(5):120–128.
  36. Wang C, Chen X, Chen F, et al. Organic photodetectors based on copper phthalocyanine films prepared by a multiple drop casting method. Organ Electron. 2019;66:183–187.
  37. Sharma K, Melavanki R, Yallur BC, et al. Optical characterization of chalcone‐doped PMMA thin films for photonic applications using spectroscopic technique of drop casting method. Macromolecular Symposia. 2020;392(1):2000165.
  38. Melavanki R, Vaijayanthimala S, Yallur BC, et al. Preparation and optical parameter characterization of two aldehyde derivative thin films for photonic applications by drop casting method. Luminescence. 2020;35(6):903–912.
  39. Ghorpade SP, Krishna RH, Melavanki RM, et al. Effect of Eu3+ on optical and energy bandgap of SrY2O4 nanophosphors for FED applications. Int J Light Electron Optics. 2020;208:164533.
  40. Ghorpade SP, Melavanki R, Patil NR. A study on the optical behavior of Dyx3+ ion activated Sr(1‐X)Y2O4 nanophosphors. Macromolecular Symposia. 2020;392(1):1900155.
  41. Ghorpade SP, Kottam N, Melavanki R, et al. Photoluminescence, TGA/DSC and photocatalytic activity studies of Dy3+ doped SrY2O4 nanophosphors. RSC Adv. 2020;10(36):21049–21056.
  42. Sharma K, Melavanki R, Patil SS, et al. Spectroscopic behavior, FMO, NLO and NBO analysis of two novel aryl boronic acid derivatives: Experimental and theoretical insights. J Mol Struct. 2019;1181:474–487.
  43. Koppal VV, Muddapur GV, Patil NR, et al. Spectroscopic studies of biologically active coumarin laser dye: Evaluation of dipole moments by solvatochromic shift method. AIP Conf Proc. 2016;1728(1):020411.
Creative Commons Attribution License

©2024 Melavanki, et al. This is an open access article distributed under the terms of the, which permits unrestricted use, distribution, and build upon your work non-commercially.