eISSN: 2574-9927


Research Article Volume 1 Issue 1
Department of science and engineering materials, University Federal of Rio Grande, Brazil
Correspondence: LMP Garcia, Department of science and engineering materials, University Federal of Rio Grande, Natal, Brazil
Received: March 16, 2017 | Published: July 20, 2017
Citation: Garcia LMP, Gurgel GHM, Lovisa LX, et al. Influence of the number of layers and crystallization temperature on the photocatalytic activity of Tio2 / In2o3 thin films. Material Sci & Eng Int J. 2017;1(1):22-28. DOI: 10.15406/mseij.2017.01.00005
The TiO2/In2O3 thin films were prepared by the spin coating method, varying their number of layers (4, 8 and 16 layers). The Method of polymerization of complex (CPM) was used to synthesize the precursor resins in order to produce thin films. The TiO2/In2O3 films were heat-treated at 300 °C, 500 °C and 700 °C and characterized by X-ray diffraction, scanning electron microscopy (FEG-SEM), atomic force microscopy (AFM), UV–vis spectrophotometer and photoluminescence (PL). It was found that the band gap energy of the as-prepared TiO2/In2O3 composite thin films decrease as temperature increases. According to the UV–vis diffuse reflectance spectra, the TiO2/In2O3 composite shows good visible-light absorption ability. The photoluminescent properties of the films were studied at room temperature using a wavelength of 350 nm excitation. High photoluminescent intensity was observed for the films treated at 300 °C heat, studied in different films. The photocatalytic activity of the composite TiO2/In2O3 was evaluated by the photodecomposition of methylene blue dye in aqueous solution and showed that all the composite samples presented excellent photocatalytic performance even when recycled. This study shows that the coupling of TiO2 with In2O3 is an effective way to increase the TiO2 absorption in the visible region for catalytic applications and that the temperature has a greater influence on the results than the number of layers.
Keywords: Thin films; spin coating; TiO2/In2O3; Photocatalysis
The semiconductor based in photocatalysis is considered as a promising technique for pollution treatment,1 due to its potential applications in environmental pollution remediation and renewable energy generation, as well as the non-use products additional chemicals, and operating at room temperature.1,2
TiO2 is renowned as the most admirable material in photocatalytic applications, because of their high photocatalytic activities, low costs and nontoxic natures. However, due to their high Egap (3.2 eV), they only absorb UV light.3 Much effort has been devoted to the further enhancement of the photocatalytic performance of TiO2 for the degradation of various organic pollutants.4 A variety of materials, such as metal oxides and metal sulfides, have been coupled with TiO2 to form composites.1 As one of the oxide semiconductor photocatalysts, In2O3, comparing with TiO2, has the similar properties on photocatalytic activities. Meanwhile, In2O3 had proved to be an efficient sensitizer to extend the absorption spectra of oxide semiconductor photocatalysts from the UV region into the visible region, with a Egap of 2.8 eV.3,5 However, the photocatalytic activity of pure In2O3 is very low due to the quick recombination of photogenerated electron–hole pairs. This material is obviously more suitable as a sensitizer to be combined with a large band-gap semiconductor. Since the conduction band energy level of In2O3 is more negative than that of TiO2 , the electron transfer from In2O3 to TiO2 is possible.1
Composite photo catalyst with two or more components can improve the separation of photo induced charges and enhance photocatalytic activity due to the high efficiency of the interfacial charge transfer between components. During the past decades, numerous studies have been successfully made to design different and efficient composite photocatalysts, such as noble-metal-based composites.2 Recently, a multilayer thin film of TiO2/In2O3 has been used in solar cells, in order to improve the electrical properties of TiO2 and increase the efficiency of the photovoltaic energy conversion, because the addition of In2O3 prevents the recombination of electrons / holes generated by the irradiation of TiO2 particles, thereby increasing the formation of highly oxidative radicals on the TiO2 surface, together with the visible absorption of In2O3 to 600 nm.TiO2 and In2O3 films have been studied by several investigators. However, TiO2/In2O3 films are still understudied.6
In this paper, we report the study of thin films of TiO2/In2O3 composite prepared by method of polymerization of complex and deposited by spin coating. We also investigated the influence of the number of layers in the thin films of TiO2/In2O3 on its photocatalytic efficiency and photoluminescent emission. The thin film was reused three times and shown to be efficient photocatalysts for degrading dyes. The photoluminescence emission shown that TiO2/In2O3 composite was strongly affected by the crystallization temperature.
Preparation of multilayer TiO2/ In2O3 thin films
The resin was prepared by the method of polymerization of complex, this method uses in situ polymerization, soluble metal polymerisation compounds are prepared with citric acid, and only then is added the polyalcohol, in this case ethylene glycol, which promotes the polymerization of metal compounds. As shown below: The thin film was obtained from a precursor solution using titanium (IV) isopropoxide and citric acid in a molar ratio of 3: 1. Citric acid was added and dissolved in 100 ml of distillated water under stirring at 70 °C. It was then slowly added the titanium isopropoxide until a homogeneous and transparent solution was obtained. Finally, ethylene glycol was added in a ratio of 40/60 (wt %) relative to citric acid and the temperature was raised to 90°C. The same procedure was used to obtain the resin In2O3, substituting titanium isopropoxide by indium nitrate. The citric acid / metal cations (titanium isopropoxide, indium nitrate) at a ratio of 3: 1 and ethylene glycol were added in a ratio of 40/60 (% by mass) relative to citric acid. The viscosity of the deposition resin was adjusted to 20 mPa/s measured at room temperature.
The substrates were spin-coated by dropping a small amount of the polymeric resin onto them. Rotation speed and spin time were fixed at 700 rpm for 3s and 7200 rpm for 30s, using a commercial spinner (Chemat Technology KW-4B spin-coater). After deposition, the wet films were dried at 80 °C for 10 min on hot plate. Four, eight and sixteen layers were deposited for each film and the procedure was repeated for each layer. The deposition of multilayer TiO2/In2O3 thin films (4, 8 and 16 layers) on substrates was illustrated in Figure 1. Finally, the films were heat-treated in the resistive furnace at 300, 500 and 700 °C for 2 h. Two films were produced for each temperature and for each variation of the number of layers, to be characterized.
Characterization measurements
The phase composition of multilayer TiO2/ In2O3 thin films was investigated on a Shimadzu / XRD-6000) diffractometer using CuK α radiation. Atomic force microscopy (AFM – Shimadzu - SPM-9700,) was used to obtain and reconstruct a 3D image of the surface of the sample. These images allow an accurate analysis and quantification of highly relevant parameters such as roughness and grain size. The reflectance of the films was obtained by the UV–Vis–NIR spectrophotometer (Shimadzu, UV 2600) over the spectral wavelength ranges from 200 nm to 1700 nm. All the measurements were taken at room temperature.
Photocatalytic activity measurements
The photocatalytic properties of thin films (as a catalyst agent) for the degradation of methylene blue (MB) dye with a molecular formula [[C16H18ClN3S] (99.5% purity, Mallinckrodt) in an aqueous solution were tested under UV-light illumination. The film was placed in a cylindrical quartz reactor, containing 3 ml of methylene blue dye solution (concentration 1 × 10⁻⁵ mol L-1). The cylindrical quartz reactor was then placed in a photo-reactor at controlled temperature (20 °C) and, was illuminated by six UVC lamps (TUV Philips, 15 W, with maximum intensity at 254 nm).
Within thirty-minute intervals, the 3-mL aliquot of the dye solution was monitored and analyzed by variations of the maximum absorption band of MB dye solutions by UV–vis absorbance spectra measurements using a Shimadzu (model UV- 2600) spectrophotometer.
Photoluminescence (PL) spectra were acquired with an Ash Monospec 27 monochromator (Thermal Jarrel, U.S.A.) and a R4446 photomultiplier (Hamamatsu Photonics, U.S.A.). The 350 nm beam of a krypton ion laser (Coherent Innova 90 K) was used as the excitation source while maintaining its maximum output power at 200 mW. All measurements were performed at room temperature.
X-ray powder diffraction patterns of TiO2/In2O3 films obtained by the spin-coating method and calcined at different temperatures and different numbers of layers deposited, as shown in Figure 2A 4 layers, (Figure 2B) 8 layers and (Figure 2C) 16 layers. The XRD characteristic peaks of anatase and In2O3 are clearly observed. The TiO2 phase was indexed according to the PDF No. 73-1764. The anatase oxide structure was confirmed by the diffraction peak of 2θ = 25.3 °C.7,8 The In2O3 phase was indexed according to the PDF No. 6-416, of which one can identify a cubic structure. The In2O3 phase is confirmed by the diffraction peak of 2θ = 30.3 °C.9 According to Poznyak,10 thin films of TiO2/In2O3 prepared with different crystallization temperatures did not reveal any additional phases.10 This indicates that no chemical interaction occurs from the TiO2 with In2O3. It is also observed that the increased temperature favors the increase in the intensity of the lines both for anatase and In2O3, which can be seen in Figure.8
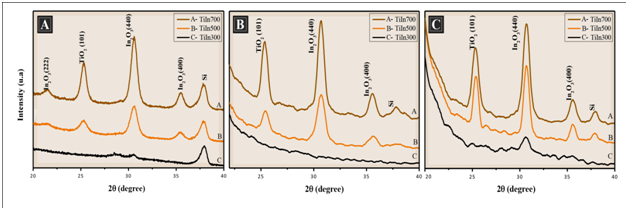
Figure 2 X-ray diffraction pattern of the films TiO2/ In2O3 with (A) 4 layers, (B) 8 layers and (C) 16 layers, calcined at 300 °C, 500 °C and 700 °C.
The crystallite sizes of all synthesized thin films were estimated from the line broadening of the correlative X-ray diffraction peak of each crystalline phase, using the most intense peak of each phase (101) and (440) according to Scherrer’s equation.11 Chuanhao Li1 reports that the width of the peak of the anatase phase increases with the formation of the composite TiO2/In2O3, indicating a reduction of the crystal size, as can be seen in Table 1. It was observed that the crystallite size of the thin films increased as the calcination temperature increased. This increase resulted in increases in both particle growth and sintering.4
Samples |
TiO2 |
In2O3 |
||
500 °C |
700 °C |
500 °C |
700 °C |
|
Ti O2/In2O3(4 layers) |
12.96±0.049 |
14.15±0.233 |
11.57±0.176 |
20.00±0.021 |
Ti O2/In2O3(8 layers) |
12.62±0.459 |
29.31±0.452 |
10.64±0.480 |
19.37±0.035 |
TiO2/In2O3(16 layers) |
11.45±0.077 |
22.98±0.042 |
14.04±0.091 |
16.17±0.190 |
Table 1 Average of crystallite size for films TiO2/In2O3 crystallized at different temperatures.
Yu et al.12 indicated that the addition of additives to titania had a suppressive effect on the crystal growth of TiO2, since the additives bared the contact between TiO2 particles and inhibited crystallite growth during the heat treatment. Similar results have been reported in other TiO2 composite materials.12
The surface morphology, particle size and, surface roughness of the thin films were characterized by atomic force microscopy (AFM) as shown in Figure 3 & Figure 4. In the images it was observed that the surface of the thin films is composed by rounded morphology particles and these particles are evenly distributed on the surface of the film whitout cracks and pores. The average particle size of the films ranged from 15 to 33 nm, which was estimated based on measurements of at least 300 microspheres in the AFM images and by fitting the resulting distribution using a Gaussian function
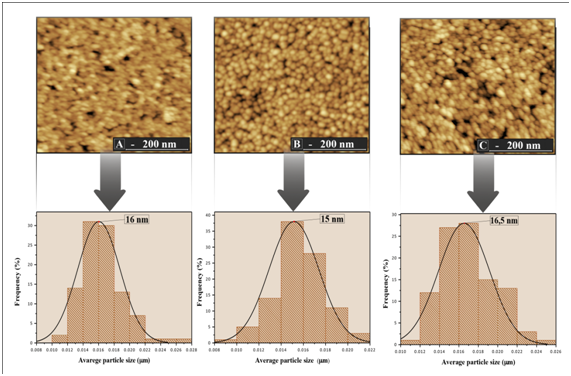
Figure 3 Histogram distribution of particle size and image of the film surface TiO2/In2O3 with (A) 4 layers. (B) 8 layers and (C) 16 layers, calcined 500 °C.
Furthermore, the variations in particle size of all synthesized thin films were similar to the variation in the crystallite size calculated from the XRD patterns using the equation of Scherrer (Table 1). The average surface roughness of the films TiO2/In2O3 crystallized at 500 °C and 700 °C are presented in Table 2. It was found that the increase of temperature increased the surface roughness. A larger film roughness value increases its specific surface, facilitating the contact of the adsorbed substances with existing crystals, thereby increasing its photocatalytic efficiency.13
N ° of Layers |
Roughness(nm) |
|
500 °C |
700 °C |
|
4 |
1.43 |
1.48 |
8 |
0.73 |
1.23 |
16 |
0.93 |
0.93 |
Table 2 Roughness of the film TiO2 / In2O3 calcined at 500 °C and 700 °C.
The FE-SEM image exemplified in Figure 5 shows the cross section of the films TiO2 /In2O3 in the silicon substrate, varying the number of layers (4, 8 and 16) with heat-treated at a 700 °C. It can be observed that, the thickness of the thin films was 262.3, 593.3 and 708.3 nm, respectively. Moreover, the FE-SEM image of the films of TiO2/In2O3 exhibit high thickness uniformity, adhesion to the substrate and good densification.
The optical band gap energy (Egap) was calculated by the Kubelka and Munk method, which is based on the transformation of diffuse reflectance measurements to estimate Egap values with good accuracy within the limits of the assumptions.14
Thus, by the Kubelka and Munk method and plotting a term chart as a function of the energy (ℎ𝜈), one can get the value of the optical gap of the samples by extrapolating the line tangent to the range in which the absorption approaches linearity in the graph.14
Figure 6 show that an increase in the heat treatment produces a decrease in the Egap values. According to Jain et al.,15 the observed decrease in band gap energy can be attributed to chemical composition, crystal structure, grain size and defects. Of all these contributing parameters, in this study the results observed in Figures 3, Figure 4 & Figure 6 shows that the optical properties of the films, such as the band gap, strongly depends on the size of the grain. The variation of the band gap with grain size due to quantum confinement has the quantitative form.16
(1)
Where 'r' is the radius of the nano-particle and 'M' is the effective mass of the system.
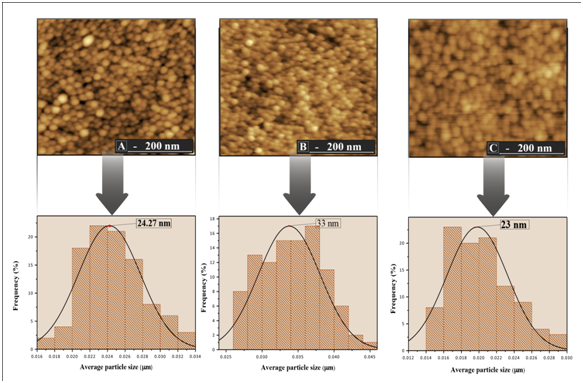
Figure 4 Histogram distribution of particle size and image of the film surface TiO2/In2O3 with (A) 4 layers. (B) 8 layers and (C) 16 layers, calcined 700 °C.
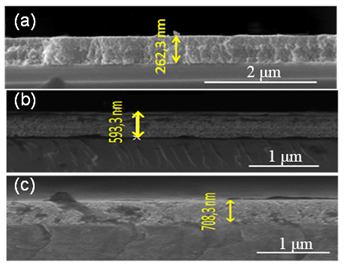
Figure 5 Morphology of the cross section of the film TiO2/In2O crystallized 700 °C, with (a) 4 layers, (b) 8 layers and (c) 16 layers.
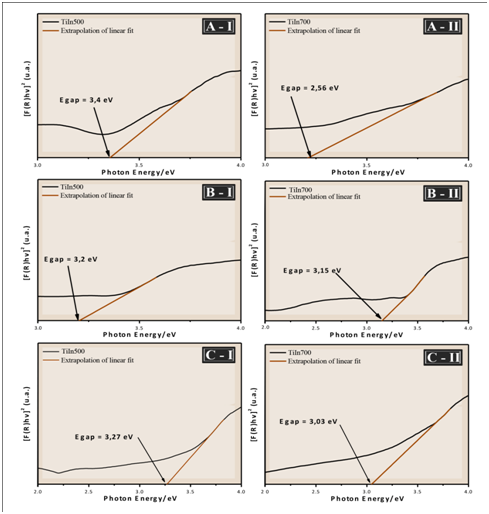
Figure 6 UV-vis spectra of the films TiO2/In2O3 with (A) 4 layers, (B) 8 layers and (C) 16 layers, calcined at (I) 500 °C and (II) 700 °C.
It is also known that the recombination time of the electron-hole pair in the TiO2 semiconductor is small and that only radiation of wavelength less than 388 nm (ultraviolet light) is sufficient to promote photoexcitation of the electrons from the valence band to the driving band. If there is a decrease in Egap between TiO2 and In2O3 films, the transfer of photogenerated electrons to In2O3, which acts as an electron trap, occurs efficiently. In addition, the presence of In2O3 promotes a shift of the absorption edge of TiO2 to the visible wavelength. This change in TiO2 bandwidth energy for the UV region has been reported in the literature for TiO2/In2O3 nanoparticles.7 It is within this context that it is believed that TiO2/In2O3 films treated at 700 °C present high technological potential to be applied in photocatalysis.
PL spectrum is a useful tool to investigate the fate of photogenerated electron and hole in a semiconductor, since PL emission results from the recombination of free charge carriers. Generally, a weaker PL intensity implies lower electron–hole recombination rate and corresponds to a higher photocatalytic activity.18 Figure 7 illustrates the photoluminescence spectra (PL) of the films TiO2/ In2O3 calcined at 300, 500 and 700 °C. All Samples were analyzed at room temperature with an excitation wavelength at 350 nm. It was possible to observe a broad and intense emission band covering a large part of the visible spectrum (400-750 nm).

Figure 7 Photoluminescence spectra of the films TiO2/In2O3 with (A) 4 layers, (B) 8 layers and (C) 16 layers, crystallized at 300 °C, 500 °C and 700 °C.
The PL emission spectra show that an increase in temperature decreases the intensity of the photoluminescence that according to Pontes,19 as this property is associated with the structural disorder of the inorganic phase, the photoluminescent spectrum is more intense when the material is submitted for a longer time to the treatment Temperature (the carbon is eliminated without crystallization). This is a strong indication that the disordered phase (amorphous phase) is responsible for photoluminescence.20 As the calcination temperature increases, the order begins to increase in the medium and long range, so the electron-hole transitions suffer a decrease, thus decreasing the intensity of the photoluminescent signal, and as a consequence a high photocatalytic activity.
The relative values of the variation in the concentration of methylene blue were used to study the degradation by UV radiation of the TiO2/In2O3 thin films; the dye concentration as a function of irradiation time is shown in Figure 8 (I). During this process, it was observed that the concentration of methylene blue in the TiO2/In2O3 films decreases when exposed to UV radiation. The degradation efficiency of Methylene Blue was calculated using (Equation 1). The photocatalysis process starts with the excitation of In2O3 under visible-light irradiation. The photogenerated electrons of In2O3 transfer to TiO2, generating electrons in the TiO2 conduction band and holes in the In2O3 valance band. The electrons in the TiO2 conduction band are of a very powerful reducing ability, thus reacting with O2 dissolved in the aqueous solution to generate HO. and O2. - Free radicals. In addition, the holes in the In2O3 valance band can also react with OH- to form HO. because its redox potential (+2.17 eV) is more positive than that of OH. /OH-(+1.99 eV). The resultant free radicals thereafter serve as the reactive species to oxidize the organic dyes. In this way the engagement of the TiO2 with In2O3 induces a more significant increase in photocatalytic activity than TiO2 and In2O3.21
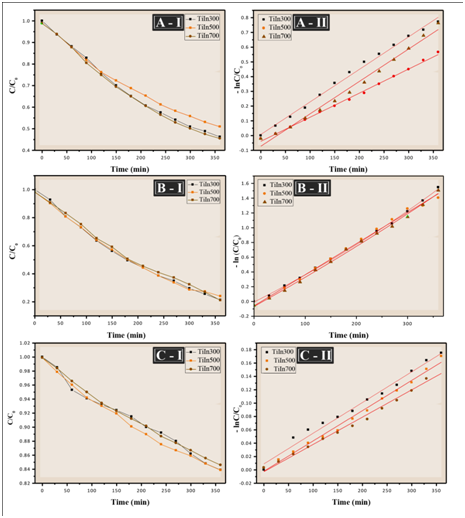
Figure 8 (I) Concentration decay curve of MB solution (II) first order reaction kinetics of the films TiO2/In with (A) 4 layers, (B) 8 layers and (C) 16 layers under UV irradiation.
Furthermore, the film of TiO2/In2O3 calcined at 700 °C shows a slightly higher degradation rate than the film of TiO2/In2O3 calcined at 300 °C to 500 °C, ie, increasing the calcination temperature favors an increase the photocatalytic activity.
(2)
Where C0 is the initial concentration and Ct is the time concentration’t’. In addition, A0 is the initial absorbance and at is the absorbance after time t of the dye solution.
Figure 8 show the kinetic studies of the degradation of the thin films. All the catalysts followed first-order kinetics and the apparent rate constant was calculated by plotting ln (C0/C) versus time (Equation 3). The slope of the plot represents the apparent rate constant.22 The linear regression value obtained in this study was 0.98 and 0.99 (Table 3). According Sanoop, for all experimental results by linear regression of ln data (C/C0) versus irradiation time, the value of R2, larger than 0.95.23
(3)
N° Layers |
Samples |
R2 |
K(min-1) |
4 |
Tiln300 |
0.99 |
0.0095 |
Tiln500 |
0.98 |
0.0138 |
|
Tiln700 |
0.99 |
0.0372 |
|
8 |
Tiln300 |
0.99 |
0.0253 |
Tiln500 |
0.99 |
0.0134 |
|
Tiln700 |
0.99 |
0.0223 |
|
16 |
Tiln300 |
0.98 |
0.0035 |
Tiln500 |
0.99 |
0.0211 |
|
Tiln700 |
0.98 |
0.023 |
Table 3 Kinetics for MB photo-degradation by various TiO2/In2O3 multilayer films.
The recyclability of the TiO2/In2O3 sample was also investigated. The photocatalytic tests were performed using the same photocatalysts three times during each cycle of 350 min and the results are compiled in Figure 9.
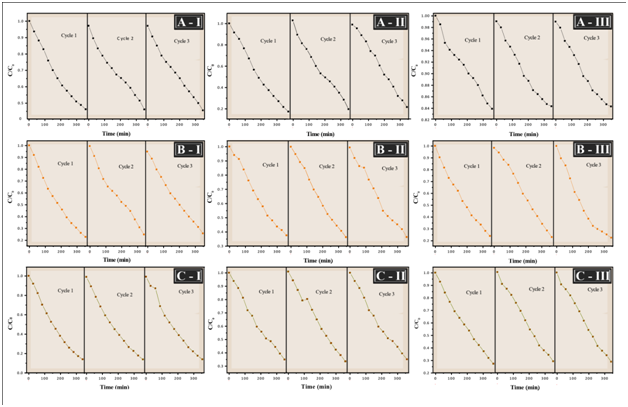
Figure 9 Photocatalytic activity of the film TiO2/In2O3 with (I) 4 layers, (II) 8 layers and (III) 16 layers in different crystallization temperatures for the degradation of methylene blue dye with three cycles used. (A) 300 °C, (B) 500 °C, (C) 700 °C.
The photocatalytic process has been widely used in the treatment of domestic and industrial wastewater and the reuse of photocatalysts becomes very important, because it indicates the ability of the material to remain active even after use. It can see that the photocatalyst retains its efficiency even when reused after three reaction cycles, it can be said that there is not a considerable loss of mass during washing. Cycling uses, as well as, maintaining high photocatalytic activity are critical issues for long-term use in practical applications of the catalyst. Therefore, two criteria are required to be considered: (i) the stability of the catalyst to maintain its high activity over time, as shown in Figure 9, and (ii) The ease with which the catalyst could be recycled from solution.18
TiO2/In2O3 composites have been prepared by the method of polymerization of complex and deposited by the spin coating method, varying the number of deposited layers and the calcination temperature. The obtained composites show a spherical morphology and high visible-light-harvesting capability. The TiO2/In2O3 thin films exhibit excellent photocatalytic performance toward the decomposition of the methylene blue. The photoluminescence of these films is strongly influenced by the temperature of crystallization; increased temperature decreases the intensity of photoluminescence. As the photoluminescence signal is the result of a combination of excited electrons and holes, the lower intensity indicates the decrease in the rate of recombination and thus the higher the photocatalytic activity. According to the obtained results, it was observed that the increase in the number of layers of TiO2 / In2O3 films did not cause large changes in the results, unlike the crystallization temperature. The films were also recycled and reused to three cycles and shown to be efficient photocatalysts for degrading dyes.
The authors thank the financial support of the Brazilian research financing institutions: CAPES/PROCAD 2013/2998/2014 and CNPq Process 402127/2013-7.
The author declares no conflict of interest.

©2017 Garcia, et al. This is an open access article distributed under the terms of the, which permits unrestricted use, distribution, and build upon your work non-commercially.