eISSN: 2574-9927


Research Article Volume 1 Issue 3
Correspondence:
Received: January 01, 1971 | Published: November 16, 2018
Citation: Odoemelam C, Achebo JI, Osa EEC. Expert optimization and prediction of bead volume of mild steel butt welded joint. MOJ Mining Met. 2018;1(3):106?115. DOI: 10.15406/mojmm.2018.01.00016
The volume of weld bead deposit on a welded joint, has a lot to say about the integrity of the weldment during its service life. Residual stresses, cracks etc can be greatly initiated with large weld bead. In this study, central composite design matrix was employed using Design Expert 7.01 software. A total of 20 sets of experiments were produced, the weld specimen was mild steel plate measuring 60mm x 40mm x 10mm. TIG welding machine with 100% Argon Shielding Gas was used for this experiment and at the end of the experiment, an optimum weld bead volume of 1105.75mm3/s was obtained with a coefficient of determination (R2) value of 0.9744 using response surface methodology (RSM) as the predictive modeling tool. This quantity of bead volume is expected to contain the adequate molten metal that is required to make the desired bead penetration at a minimum cost with appropriate weld quality and productivity.
Keywords: butt welded joints, bead volume, mild steel, shielding gas
Tungsten Inert Gas (TIG) welding technique is a metal joining process that uses an arc with a non-consumable tungsten electrode on a work piece to create a permanent joint.1,2 An inert gas (argon, helium or a mixture of both) sustains the arc and protects the molten metal from atmospheric contamination. Filler materials might sometimes be used.3,4 Huang et al.5 and Farhad and Heidari6 described the TIG welding process as one of the most popular technologies for welding thin materials in manufacturing industries because it produces high quality welds. However, these authors compared TIG welding with the metal inert gas (MIG) welding process and stick weld and came to a conclusion that TIG welding has poor joint penetration when thick materials are welded in a single pass. In a research carried out by Vasudevan,7 Marya and Edward8 were of the opinion that activated TIG welding process was observed to typically increase the penetration capability by 200-300% and thereby reducing weld time and costs for manufacturers. Leconte et al.9 also applied activated TIG welding process and noted that it improves upon conventional GTAW, by increasing the single pass joining thickness from 6 to 10mm for stainless steel which was another breakthrough in time and cost reduction during weld operation, but ignoring the volume content of bead deposited might affect the quality of the welded joint. Venkatesan and Esme et al,10 analyzed the sectional geometry of single-pass bead and the overlap of the adjacent beads to have critical effects on the dimensional accuracy and quality of metal parts. Therefore In order to find the parameter for optimization, weld bead profile study is needed
Materials
100 pieces of mild steel coupons, measuring 60mm x 40mm x10mm were used for the experiments, the experiment was performed 20 times using, 5 specimen for each run. Figure 1 shows the weld torch, Figure 2 shows the tig machine, Figure 3 shows the argon gas cylinder and regulator for varying the gas flow rate while Figure 4 shows the mild steel weld sample. The range of values of the process parameters was obtained from the open literature accessed and each parameter has two levels which comprise the high and low as expressed in Table 1 below.
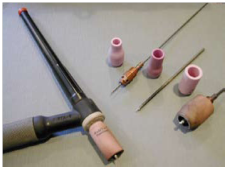
Figure 1 TIG welding torch.
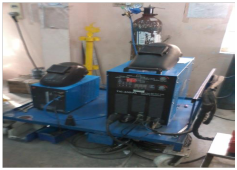
Figure 2 TIG equipment.
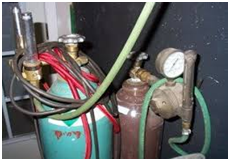
Figure 3 Shielding gas cylinder and regulator.
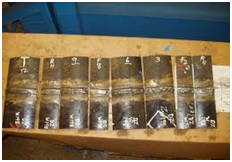
Figure 4 Weld samples.
Parameters |
Unit |
Symbol |
Coded value |
|
Low (-1) |
High (+1) |
|||
Current |
Amp |
A |
120 |
190 |
Gas flow rate |
Lit/min |
G |
10 |
17 |
Voltage |
Volt |
V |
20 |
27 |
Table 1 Welding parameters and their levels
Methods
The Central Composite Design matrix with 6 central points, 6 axial points and 8 factorial points was developed using the Design Expert 7.01 software, which produced 20 experimental runs. The input parameters and output parameters made-up the experimental matrix and the responses recorded from the weld samples were used as the data.
The optimization objective was to reduce the volume of weld metal deposit, the randomized design matrix comprising of three input variables (current, voltage and gas flow rate) and their ranges in real values is presented in Figure 5, the response variable of interest is circled in orange colour. The model summary which shows the factors and their lowest and highest values including the mean and standard deviation is presented as shown in Figure 6. Result of Figure 6 revealed that the model is of the quadratic type which requires the polynomial analysis order as depicted by a typical response surface design. The minimum value for volume of weld metal deposit was observed to be 1020.260mm3/s, maximum value of 1317.830mm3/s, mean value of 1191.888 and standard deviation of 83.228. Also indicated in circle analysis of the model standard error was employed to assess the suitability of response surface methodology using the quadratic model to maximize the electrode heat transfer coefficient, minimize the aspect ratio, minimize the volume of weld metal deposit and also minimize the rate of heat transfer from the heat source to the work piece. The computed standard errors for the selected responses are presented in Figure 7.
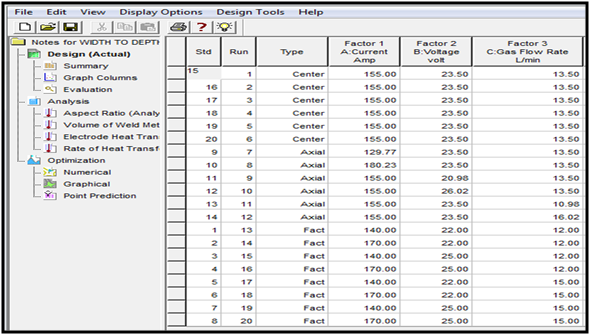
Figure 5 Central composite design matrix (ccd).
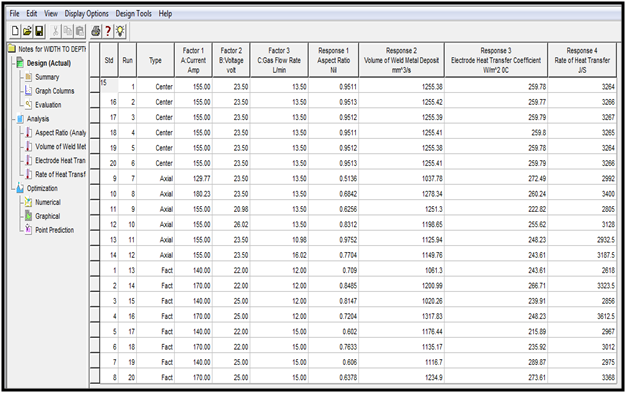
Figure 6 Design matrix showing the real values and the experimental values.
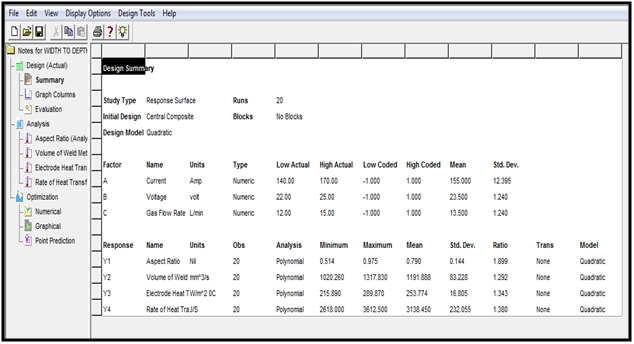
Figure 7 RSM Design summary for optimizing weld parameters.
To understand the influence of the individual design points on the model’s predicted value, the model leveages were computed as presented in Figure 8. Leverage of a point varies from 0 to 1 and indicates how much an individual design point influences the model's predicted values. Leverages of 0.6698 and 0.6073 calculated for the factorial and axial points coupled with 0.1663 for the center point as observed in Table 1 shows that the predicted values are very close to the experimental values. Hence lower residual value which shows the adequacy of the model. In assessing the strength of the quadratic model towards minimizing the volume of weld metal deposit one way analysis of variance (ANOVA) was done for each response variable and result is presented in Figure 9.
From the result of Figure 9 the Model F-value of 42.24 implies the model is significant. There is only a 0.01% chance that a "Model F-Value" this large could occur due to noise. Values of "Prob>F" less than 0.0500 indicate model terms are significant. In this case A, AB, AC, A2, B2, C2 are significant model terms. Values greater than 0.1000 indicate the model terms are not significant. To validate the adequacy of the model based on its ability optimizes the volume of weld metal deposit. the goodness of fit statistics presented in Figure 10 were employed. Coefficient of determination (R-Squared) value of 0.9744 was obtained which shows the strength of response surface methodology and its ability to minimize the volume of weld metal deposit. Adjusted (R-Squared) value of 0.9513 was also observed in Figure 10 which indicates a model with 95.13% reliability. Adeq Precision measures the signal to noise ratio. A ratio greater than 4 is desirable.
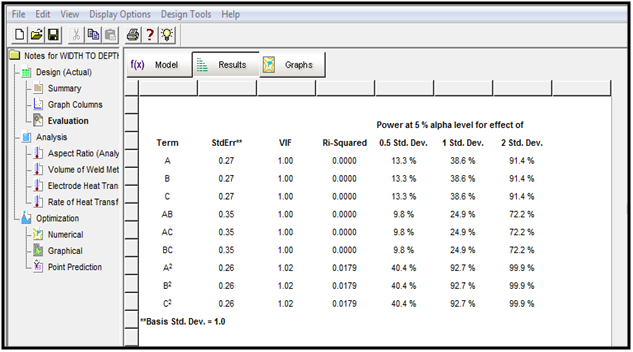
Figure 8 Result of computed standard errors.
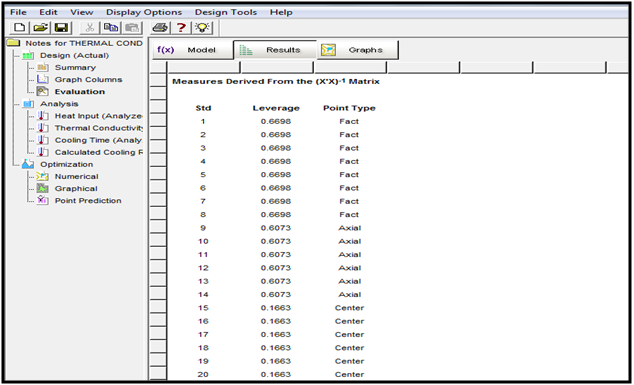
Figure 9 Computed model leverages.
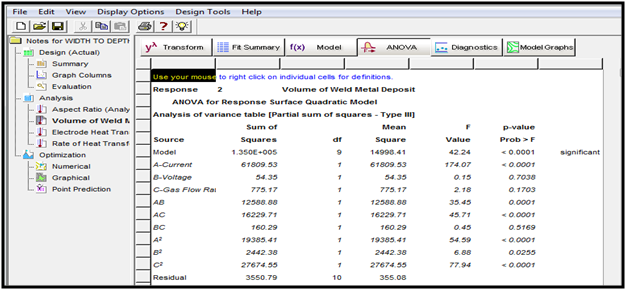
Figure 10 ANOVA table for validating the model significance towards minimizing the volume of weld metal deposit.
To obtain the optimal solution, we first consider the coefficient statistics and the corresponding standard errors. The computed standard error measures the difference between the experimental terms and the corresponding predicted terms. Coefficient statistics for bead volume is presented in Figure 11. The optimal equation which shows the individual effects and combine interactions of the selected input variables (Current, Voltage and Gas flow rate) against the mesured responses (Volume of weld metal deposit), is presented based the actual factors as shown in Figure 12. The diagnostics case statistics which shows the observed values of each respones variable (Volume of weld metal deposit,) against their predicted values is presented in Figure 13.
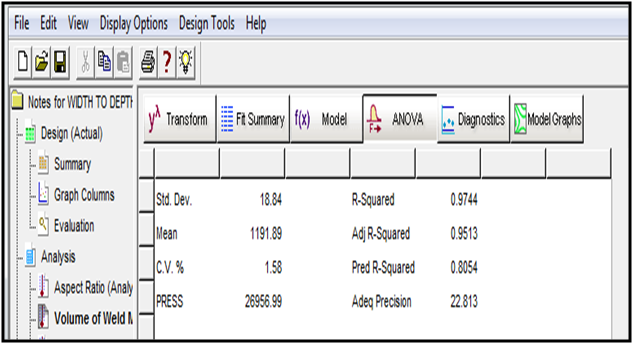
Figure 11 GOF statistics for validating model significance towards minimizing the volume of weld metal deposit.
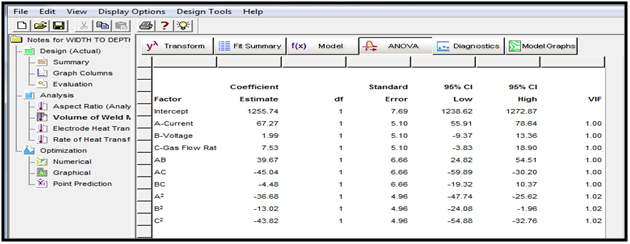
Figure 12 Coefficient estimates statistics for minimizing the weld bead volume.
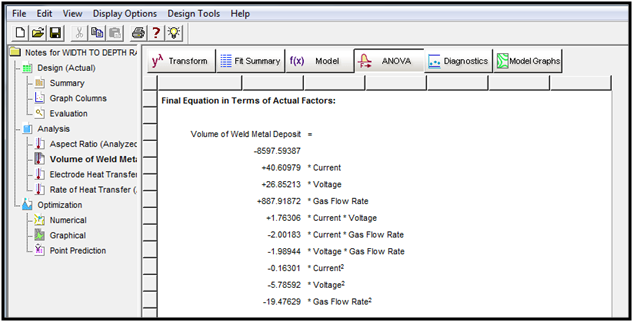
Figure 13 Optimal equation in terms of actual factors for minimizing the weld bead volume.
To asses the accuracy of prediction and established the suitability of response surface methodology using the quadratic model, a reliability plot of the observed and predicted values of bead volume is presented in Figure 14.
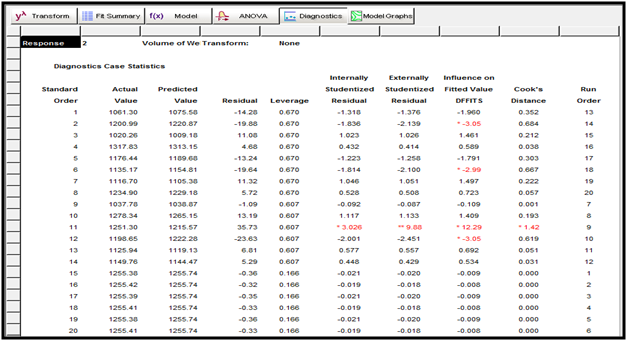
Figure 14 Diagnostics case statistics report of observed and predicted volume of weld metal deposit.
The high coefficient of determination (r2=0.9744) as observed in Figure 10 was used to established the suitability of response surface methodology in minimizing the volume of weld metal deposit on the work piece.
To accept any model, its satisfactoriness must be checked by an appropriate statistical analysis. To diagnose the statistical properties of the model, the normal probability plot of residual for bead volume is presented in Figure 15. To study the effects of combine variables on each response (Volume of weld metal deposit, 3D surface plots presented in Figure 16.
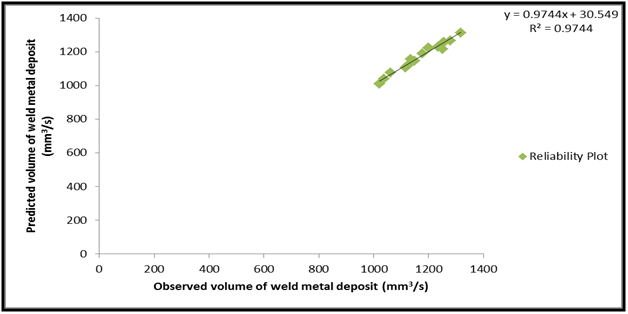
Figure 15 Reliability plot of observed versus predicted weld bead volume.
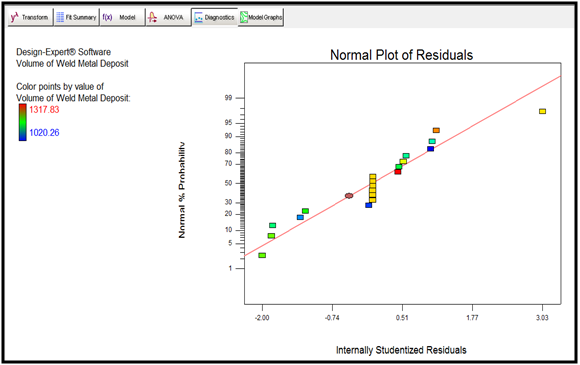
Figure 16 Normal probability plot of studentized residuals for minimizing weld bead volume.
Finally, numerical optimization was performed to ascertain the desirability of the overall model. In the numerical optimization phase, we ask Design Expert to minimize the weld bead, also determining the optimum value of current, voltage and gas flow rate. The interphase of the numerical optimization is presented as shown in Figure 17. The numerical optimization produces about twenty two (22) optimal solutions which are presented as shown in Figure 18. From the results of Figure 19 it was observed that a current of 140.00 Amp, voltage of 25.00 volt and a gas flow rate of 15.00 L/min will produce a weld material with volume of weld metal deposit (1105.57mm3/s. This solution was selected by Design Expert as the optimal solution with a desirability value of 96.70%. The contour plots showing weld bead volume response variable against the optimized value of the input variable is presented in Figure 19.
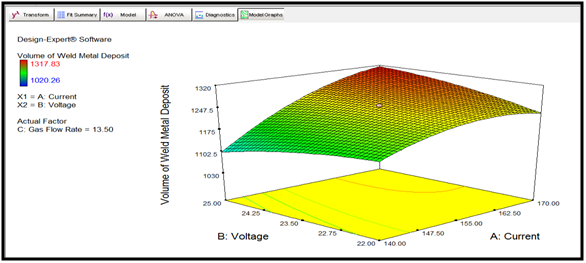
Figure 17 Effect of current and voltage on volume of weld metal deposit.
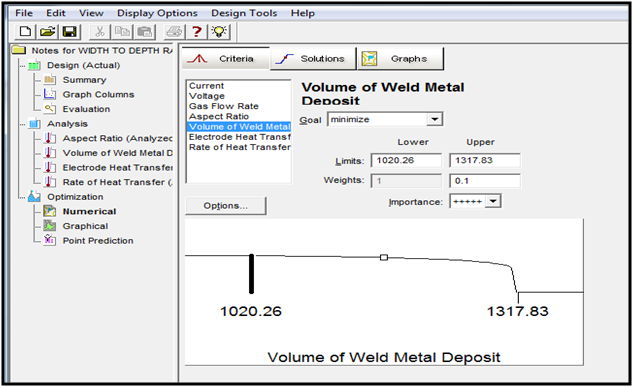
Figure 18 Interphase of numerical optimization model for optimizing the weld bead volume.
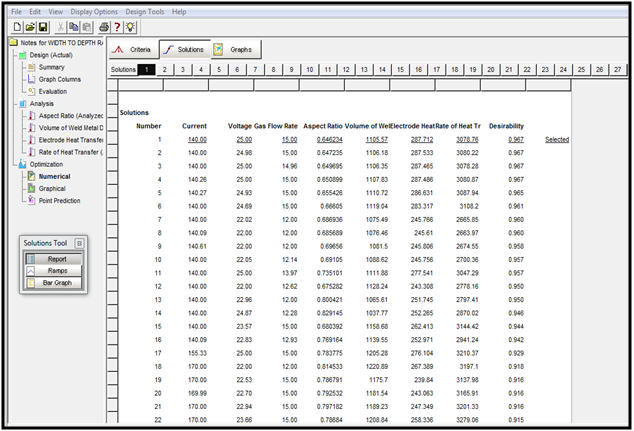
Figure 19 Optimal solutions of numerical optimization.
In this study, the response surface methodology was used to optimize the weld bead volume of tungsten inert gas mild steel welds. To validate the adequacy of the model based on its ability to optimize the weld bead volume, the goodness of fit statistics presented in Figure 10 was employed.Coefficient of determination (R2) values of 0.9744 as observed in Figure 10 for weld bead volume indicated the adequacy of the models. To asses the accuracy of the prediction and established the suitability of response surface methodology using the quadratic model, a reliability plot of the observed and predicted values of each response was obtained as presented in Figure 15. The 3D surface plot as observed in Figure 17 shows the relationship between the input variables (voltage, current and gas flow rate) and the response variable (weld bead volume). Similarly, based on the optimal solution the expert system generated contour plots as observed in Figure 20 showing several predicted responses and their respective input variables, all within the boundaries of experimental design.
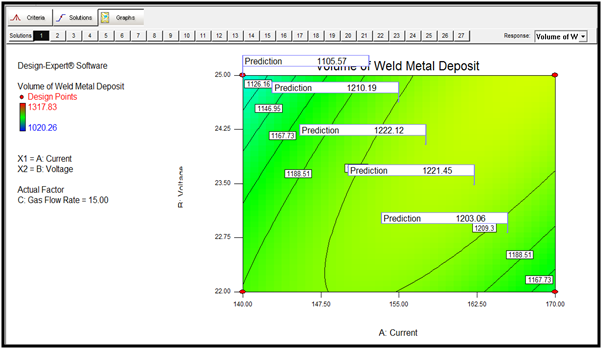
Figure 20 Predicting the weld bead volume using contour plot.
The quality of a weld is determined by the quality of the weld bead geometry and rate of heat transfer. The bead volume is a very important factor to consider in assessing the quality of weldment. Weld bead geometry is described by the bead width, bead depth and bead volume. This study has shown that current has very strong influence on the on bead volume and rate of heat transfer. The models developed possess a variance inflation factor of 1.0 and P- values <0.05 indicating that the models are significant, the models also possessed a high goodness of fit with R2 (Coefficient of determination) values of 94% for aspect ratio, 97% for bead volume. Adequate precision value of 22.813 was observed for the Bead volume. The model produced numerical optimal solution of Current 140.0Amp, Voltage of 25Volt and a Gas flow rate of 15L/min will produce a welded material having a bead volume 1105.57mm3 at a desirability value of 96.7%.
None.
There is no conflict of interest in this work.

©2018 Odoemelam. This is an open access article distributed under the terms of the, which permits unrestricted use, distribution, and build upon your work non-commercially.