eISSN: 2574-9927


Research Article Volume 2 Issue 6
Department of Testing of Materials Weldabili
Correspondence: Mirosław Lomozik, Ph.D, Department of Testing of Materials Weldability and Welded Constructions,Institute of Welding, ul. Bł. Czeslawa 16-18, 44-100 Gliwice, Poland
Received: August 18, 2018 | Published: November 16, 2018
Citation: Lomozik M. Experimental results-based estimation of cooling time during the TIG surfacing of steels performer with and without preheating. Material Sci & Eng. 2018;2(6):185–188. DOI: 10.15406/mseij.2018.02.00054
The paper shortly characterises the structure of the separate areas of the heat affected zone which occurs in the structural steels during welding and surfacing. It presents the methodology of thermal cycles measuring while argon shielded TIG surfacing of steel plates SM400A. Surfacing was conducted in two variants, i.e. without preheating and with preheating before surfacing. Research resulted in the developing of diagrams determining the value of the maximum temperature of the thermal cycle in the specific place of the element being surfaced for the given heat input Q as well as diagrams enabling the determination of cooling time of a padding weld, assuming that maximum temperature of the thermal cycle in the selected point of the component being surfaced is known for the determined heat input Q during TIG surfacing with and without preheating.
Keywords: welding thermal cycle, TIG process, heat input q, preheating, cooling time
During welding, heat supplied by the welding power source (heat source) to a work piece (element subjected to welding) is used primarily to melt the filler metal and to partly melt the base material on the edges of the weld groove as well as to heat the base material areas near the weld. The stirring of the molten filler metal and the base material results in the formation of a weld (during the process of solidification). In turn, in partially melted zones (i.e. areas adjacent to the weld), heated up to high temperatures during welding, the heat affected zone (HAZ) is formed. In welded or surfaced joints made of steels the HAZ area is not homogenous but composed of several zones differing in terms of their morphology. The aforementioned areas include the coarse-grained HAZ (CGHAZ) heated above a temperature of 1150oC, fine-grained HAZ (FGHAZ) heated above temperature AC3, inter critically reheated (within the range of AC1-AC3) coarse-grained HAZ (ICCGHAZ) and the sub critically (i.e. below AC1) reheated coarse-grained HAZ.1,2 The process of welding or that of multilayer surfacing entails the interaction of successive thermal cycles translating into specific thermal conditions during the cooling of the weld/overlay weld and of the HAZ. The welding of steel having a higher carbon content and containing chemical elements increasing harden ability, is frequently accompanied by the formation of a hard and brittle layer of marten site (e.g. in the HAZ area) requiring the subsequent heat treatment of a welded joint or an element provided with an overlay weld. In cases where, because of technological aspects, the performance of conventional post-weld treatment is limited or impossible, an effective manner enabling the improvement of plastic properties of hardened areas is the application (particularly during repair welding) of temper bead welding. The aforesaid technique makes it possible to reduce the hardness of hardening structures (marten site, upper bainite) presents in the coarse-grained HAZ (CGHAZ) areas of joints or overlay welds, and, consequently, to improve plastic properties of the above-named areas.3 The process of welding and that of surfacing vary primarily as regards accompanying thermal conditions. For this reason, it is not possible to compare the above-named processes directly. However, the methodology enabling the estimation of cooling time is similar both in terms of welding and surfacing processes. During surfacing, because of various types of joints, the testing procedure is more complicated than that applied in relation to surfacing. The foregoing is primarily related to the problematic fixing of thermocouples in the HAZ areas of welded joints in comparison with HAZ areas of surfaced elements. This paper aims to present the methodology applied to determine cooling time during surfacing performed using the TIG method.
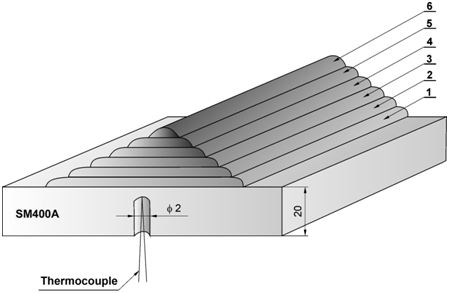
The tests involved the use of Japanese unalloyed structural steel grade SM400A. The chemical composition of the steel is presented in Table 1. The Polish equivalent of steel SM400A is steel grade S355JR. Thermal cycles were measured during the mechanised argon-shielded TIG surfacing process performed with and without preheating. The welding power source used in the tests was a TIG STAR BC 300 (model YC-300BC1) machine (Panasonic). Before surfacing, the plate made of steel SM400A (on the opposite side than that with the overlay welds) was provided with several non-passes through openings. The above-named openings were provided with Chromel-Alumel thermocouples (having a diameter of 0.25mm) subsequently used in measurements of thermal cycles (Figure 1).

Figure 1 Schematic diagram of the application of overlay welds (in cross-section): 1-6 - successive overlay weld layers.
Chemical element content, % by mass |
||||||
C |
Mn |
Si |
P |
S |
Cr |
Ni |
0.16 |
1.01 |
0.16 |
0.019 |
0.004 |
0.033 |
0.01 |
Mo |
Co |
V |
Cu |
Alsolub. |
Pb |
- |
0.002 |
0 |
0 |
0.007 |
0.019 |
<0.001 |
- |
Table 1 Chemical composition of steel SM400A (no. W. 1.0486)
The process of surfacing performed without preheating involved the use of filler metal grade TGS-70NCb (in the form of a wire) having a diameter of 1.2mm. In turn, the process of surfacing performed with preheating involved the use of filler metal grade TGS-56 (wire) having a diameter of 1.2mm. Both wire grades were manufactured by KOBELCO. The chemical compositions of the filler metal wires are presented in Table 2 & Table 3. Thermal cycles were measured using a model involving the process of surfacing performed on the surface of a steel plate. The measurements were performed in conditions of overlapping thermal cycles. The 20 mm thick plate made of steel SM400A was provided with six consecutively applied surfaced layers. The principle governing the surfacing of six layers resulted from ASME regulations,4 under which the obtainment of the desired tempering effect of hard hardening structures requires the making of a minimum of six welded (surfaced) layers. The proper effect of six surfaced layers was also demonstrated by other research works aimed to determine the possibility of the TIG repair welding of manganese-molybdenum-nickel ferric steel SQV2A TIG.5,6 The surfacing sequence involved the application of six runs in the first layer, five runs in the second layer etc. and, finally, one run in the sixth layer. The course of a thermal cycle was recorded in relation to each run. The schematic diagram of the surfacing process is presented in Figure 1. The related surfacing test variants are presented in Table 4. The adjustment of preheating temperature values was based on welding engineering practice. During the measurements of thermal cycles, signals from the thermocouples were recorded by independent measurement channels of a DA 100-11-1M recording system (YOKOGAWA, Japan) and, afterwards, converted to their digital form using the DARWIN software programme. The plates containing the overlay welds were sampled for specimens subjected to macroscopic metallographic tests. The specimens were cut out in the thermocouple fixing plane, i.e. the plane of the thermocouple which recorded the highest maximum thermal cycle temperature Tmax, in the first layer of the overlay weld (approximately 1350oC). The macrostructure of the specimens was revealed through the two-stage etching in Nital and Picral. The surfaces of the metallographic specimens related to various values of heat input Q were used in measurements of the shortest distances between the thermocouple (fixing point) and the fusion line of individual weld runs. The manner of measurement is presented in Figure 2.

Figure 2 Measurement of the shortest distances d1, d2, … dn between the thermocouple (connection) and the fusion line of individual weld runs.
Chemical element content, % by mass |
||||||||||
C |
Mn |
Si |
P |
S |
Cr |
Ni |
Cu |
Fe |
Nb+Ta |
Ti |
0.02 |
3.03 |
0.21 |
0.001 |
0.001 |
19.85 |
72.3 |
<0.01 |
1.75 |
2.4 |
0.3 |
Table 2 Chemical composition of filler metal wire TGS-70NCb
Chemical element content, % by mass |
|||||||
C |
Mn |
Si |
P |
S |
Ni |
Mo |
Cu |
0.09 |
1.58 |
0.41 |
0.007 |
0.007 |
0.66 |
0.52 |
0.16 |
Table 3 Chemical composition of filler metal wire TGS-56
Surfacing without preheating |
|
|
|
Base material |
Filler metal |
Heat input Q, kJ/cm |
Preheating temperature, oC |
SM400A |
TGS-70NCb |
5 |
20 |
8.5 |
20 |
||
12 |
20 |
||
Surfacing with preheating |
|||
Base material |
Filler metal |
Heat input Q, kJ/cm |
Preheating temperature, oC |
SM400A |
TGS-56 |
5 |
150 |
8.5 |
150 |
||
12 |
150 |
||
Table 4 Scheduled variants of thermal cycle measurements during surfacing
For each heat input Q related sets of maximum thermal cycle temperature Tmax and cooling times (CT) were obtained. The list of actual values of the experimentally-obtained data concerning the measurements of thermal cycles are presented in Table 5. The cooling time (CT) was determined in the following manner.
Surfacing without preheating |
|
|
|
Heat input Q, kJ/cm |
5.5 |
9.4 |
14.8 |
Maximum thermal cycle temperature Tmax., oC |
346÷1365 |
216÷1295 |
251÷1336 |
Cooling time (CT), s |
1.5÷4.5 |
3.0÷8.5 |
4.0÷10.0 |
Surfacing with preheating |
|
|
|
Heat input Q, kJ/cm |
5.7 |
9.7 |
13.8 |
Maximum thermal cycle temperature Tmax., oC |
383÷1312 |
399÷1363 |
356÷1293 |
Cooling time (CT), s |
3.0÷6.5 |
5.0÷11.0 |
6.0÷14.5 |
Table 5 Actual values of heat input Q, ranges of maximum temperature Tmax. and cooling time (CT) obtained in the tests

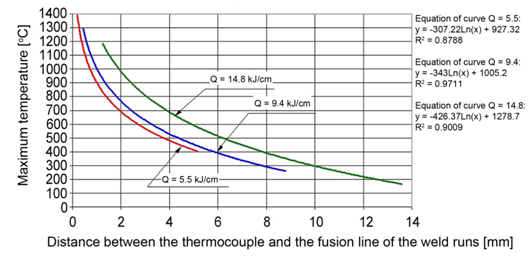
Figure 3 Correlation between the maximum thermal cycle temperature Tmax. in relation to the distance between the thermocouple and the fusion line of the weld runs in relation to various values of heat input Q provided during TIG surfacing performed without preheating.

Figure 4 Correlation between the maximum thermal cycle temperature Tmax. in relation to the distance between the thermocouple and the fusion line of the weld runs in relation to various values of heat input Q provided during TIG surfacing performed with preheating.
The performed experimental tests justified the formulation of the following practical conclusions:
Authors declare that there is no conflict of interest.

©2018 Lomozik. This is an open access article distributed under the terms of the, which permits unrestricted use, distribution, and build upon your work non-commercially.