eISSN: 2574-9927


Review Article Volume 5 Issue 4
Air Pollution Research Department, Environmental Research Division, National Research Centre, Egypt
Correspondence: Atef MF Mohammed, Air Pollution Research Department, Environmental Research Division, National Research Centre, Giza, Egypt, Tel +201151143456
Received: August 03, 2021 | Published: August 19, 2021
Citation: Mohammed AMF, Mohamed EF, Saleh IA, et al. Air Pollution and COVID-19 Lockdown. Material Sci & Eng. 2021;5(4):111-122. DOI: 10.15406/mseij.2021.05.00166
This review will shed the light on the relationship between COVID-19 infection rates and air pollution. TIt focuses broadly on the impact of lockdown on air quality over major cities across the globe during the COVID-19 pandemic lockdown. This concept will be covered via answer many open questions about the new COVID-19 problems. A quick look about the types of air pollutants and their health effects and supply a comprehensive knowledge in the air pollutants transport and multiple exposure pathways are explained. This review will elucidate the severe COVID-19 infections issues associated with different types of air pollutants. Additionally, it will discuss in details the impacts of short-term lockdown during COVID-19 and air quality in major cities around the world.
Keywords: COVID-19, infection, pandemic, air pollution, lockdown and air quality
The Corona Virus (COVID-19) has become a global public health problem. Recent studies found that air quality is a risk factor for respiratory infection by carrying microorganisms and affecting body's immunity. This review aimed to search the relationship between air quality and the infection caused by the novel corona virus. Sources of air pollution. Air pollutants were classified according to origin into (Figure 1): i) natural sources (volcans, wildfires and storms) pollutants; and ii) anthropogenic sources (vehicles emission, biomass combustion, fossil fuel combustion, power plants, shipping emissions, industrial activities, sewage treatments, home and building heating, and agricultural activities) pollutants.1 These sources do not produce pollutants directly (primary emissions) only, but they also produce secondary pollutants. People spend most of their time indoors (e.g., home, offices, shops and schools), exposure to indoors pollutants is important. Next to outdoor pollution penetrating indoors, several indoor sources exist such as cooking, smoking, woodstoves and fireplaces, and candle burning.1

Figure 1 Sources of air pollution.12
Air pollutants transport and multimedia exposure
The term environment, in general, covers the physical surroundings that are common to everybody including air, water, land, plants and wildlife. Humans are exposed, in general, to a multitude of potentially hazardous chemicals in air, food, soil and water.2 Air pollution can pose a significant health hazard to humans, and is toxic to plants and animals where concentrations exceed the tolerance of the organism. Air is the major initial recipient of air quality, from where they are then transported through to environmental media (soil, water, and food). Air pollutants can reach humans by direct inhalation and ingestion of contaminants in air, food, water, soil and dust.3,4 Post air pollutants emissions; they disperse directly into living organisms, air, water, soil and food, with variable dispersion rates and patterns pathways depending on pollutants budget. It is affected by:5
Atmospheric deposition process affects air pollutants lifetime and may lead to the contamination of other environmental media.6 Risk assessment and management can be considered as a tool for the protection of surroundings, as well as, for the protection of human health. Hazard is defined as situation that in particular circumstances could lead to risk. A risk to human health or to environment does not exist unless two criteria are met:
Atmospheric models
Multimedia mathematical models have gained growing acceptance as a powerful tool to understand complex environmental processes and to assess human exposure risk from pollutants,7 as well as for estimating exposures in situations where measurements are unavailable.2 These models are closely linked to the behaviour of pollutants and involve calculations related to the environmental distribution and fate of those pollutants.8 They consequently require information on the sources, transport, transformation and fate of the contaminants. Air pollutants transport-and-fate modeling has reached a relatively high degree of sophistication. In general, atmospheric models address the process of airborne pollutant transport, diffusion (dispersion) and deposition.9,10 Transport refers to the movement of a suspended pollutant through air currents. Diffusion refers to the motion of individual articles and molecules that tend to spread and dilute the pollutant (e.g. smoke diffusion). Deposition is the transfer of articulate matter to the ground (soil), water bodies, and vegetation. Deposition is caused by gravity (dry deposition), or by rain (wet deposition). Atmospheric transport models combine input meteorological conditions describing wind speed, wind direction, atmospheric stability and mixing layer depth with the pollutant emission and deposition rates to yield estimates of atmospheric concentrations at selected receptor. While, atmospheric concentrations determine human exposure through direct inhalation, deposition rates determine how much of the pollutant emitted to the atmosphere reaches the soil, surface water, vegetation, and groundwater.
Health effects of air pollution
Previous epidemiological studies reported that health effects on human due to exposure to air pollutants. Exposure to air quality in time series studies is usually estimated from continuous outdoor air pollution monitoring stations operating in the area of the population under study. Many of these conditions predispose to COVID-19 hospitalization, ICU admission and death. Consequently, there is a serious concern about the negative impacts of air pollution on the COVID-19 pandemic.1,11 There are three main pathways for routes of exposure by which air pollution can affect human body as shown in Figure 2: i) inhalation; ii) ingestion; and skin absorption.12 Who is especially at increased risk of respiratory infection from air pollution? Risk groups for respiratory infections due to air pollution exposure are shown in Figure 3 and specified by Liu et al. (2-17) as:
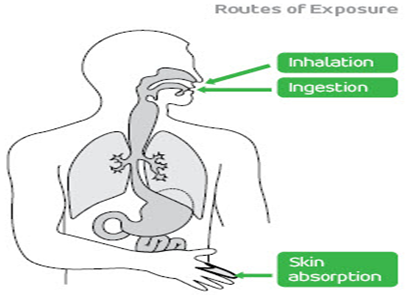
Figure 2 Main pathways by which air pollution can affect human body.12

Figure 3 Risk groups for respiratory infections from air pollution.48
Air quality short-term exposure and COVID-19 infection
Earlier studies mentioned the short-term exposure to air quality (PM10, PM2.5 SO2, NO2, and O3) were significant as the risk factors for respiratory infection, immunity and mortality rates.1,12–28
How large is a corona virus compared to the PM10 and PM5?
Corona virus particles are spherical particles between 0.06 - 0.14µm in diameter, averaging about 0.125µm, measured by electron microscope.29 This means that corona virus particles are smaller than PM2.5, but larger than some dust and gas particles (Figure 4).
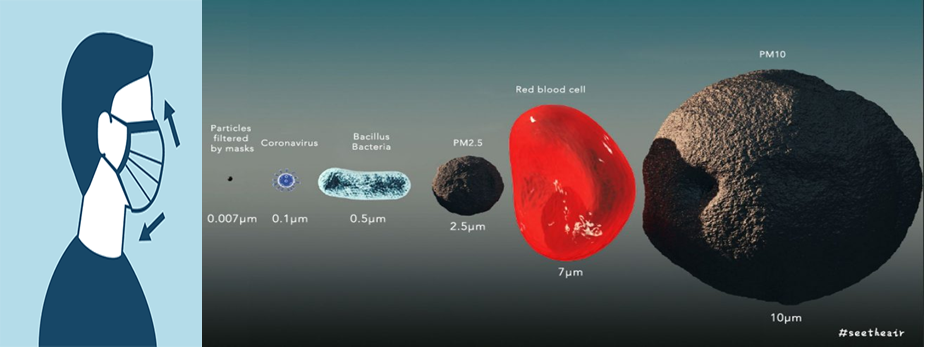
Figure 4 Corona virus compared to the PM10 and PM2.5.30
Case studies
In China: Daily confirmed cases, air quality concentration and meteorological parameters in 120 cities were recorded from January 23, 2020 to February 29, 2020 in China.29 Additive model was used to estimate the associations of air quality (PM10, PM5, CO, SO2, NO2 and O3) with COVID-19 confirmed cases (Figure 5). Zhu et al.29 found that the relationship between air quality and COVID-19 infection was significantly, NO2 and O3 seem contradictory in different cities. Study observed significantly positive associations of PM2.5, PM10, CO, NO2 and O3 with COVID-19 confirmed cases were observed. A 10-μg/m3 increase (lag0–14) in PM2.5, PM10, NO2, and O3 was associated with a 2.24% (95% CI: 1.02 to 3.46), 1.76% (95% CI: 0.89 to 2.63), 6.94% (95% CI: 2.38 to 11.51), and 4.76% (95% CI: 1.99 to 7.52) increase in the daily counts of confirmed cases, respectively. However, SO2 was negatively associated with the number of daily COVID-19 confirmed cases. A 10-μg/m3 increase (lag0–14) in SO2 was associated with a 7.79% decrease (95% CI: −14.57 to −1.01) in COVID-19 confirmed cases.29
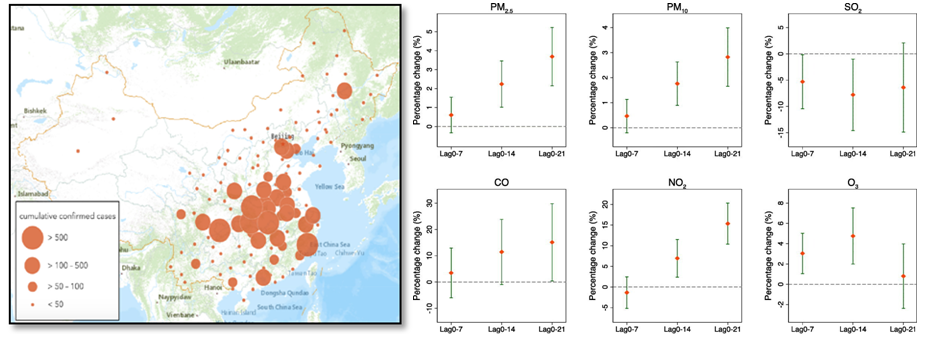
Figure 5 Relationship between air quality and COVID-19 infection in China.30
In Italy: After the appearance of COVID-19 in China last December 2019, Italy was the first European country to be severely affected by the outbreak. Filippini et al.30 investigated the association between air pollution and subsequent COVID-19 mortality rates within two Italian regions (Veneto and Emilia-Romagna). In Table 1, results estimated nitrogen dioxide from the Sentinel-5P satellites of the European Space Agency Copernicus Earth Observation Programme and COVID-19 mortality rates.30 Zoran et al.31 investigated the relationship between the high level of corona virus infection and air pollution in Milan metropolitan area Lombardy region in Italy, during January–April 2020 period. The daily average inhalable gaseous pollutants (ozone (O3) and nitrogen dioxide (NO2)) and weather parameters (air temperature, relative humidity, wind speed, precipitation rate, atmospheric pressure field and Planetary Boundary Layer) were analyzed. NO2 and O3 seem contradictory in different cities. Results showed a positive correlation with ground level O3 and air temperature. However, NO2, relative humidity and precipitation rates were inversely correlated with COVID-19 infections. Daily new cases of COVID-19 were positively related to PM. A positive significance was observed between ambient PM5 concentration and excess COVID-19 related mortality.31 Fattorini D & Regoli13 were represented the relation between air pollution and the confirmed cases of Covid-19 in Northern Italy during the last decade (2016 - 2019) (Figure 6).
|
Population at January 2019 |
Cumulative cases |
Mortality rate/per 100,000 |
NO2 (μmol/m2) |
||||
|
March |
April |
March |
April |
March |
April |
||
|
Veneto |
4,905,854 |
546 |
908 |
11.13 |
18.51 |
75 |
50 |
|
Emilia-Romagna |
4,459,477 |
1060 |
2287 |
23.77 |
51.28 |
66 |
38 |
Table 1 Cumulative COVID-19 death cases, mortality rate and nitrogen dioxide (NO2) (μmol/m2) on March - April 2019 in Veneto and Emilia-Romagna regions
(Source: Filippini et al., 2021)31
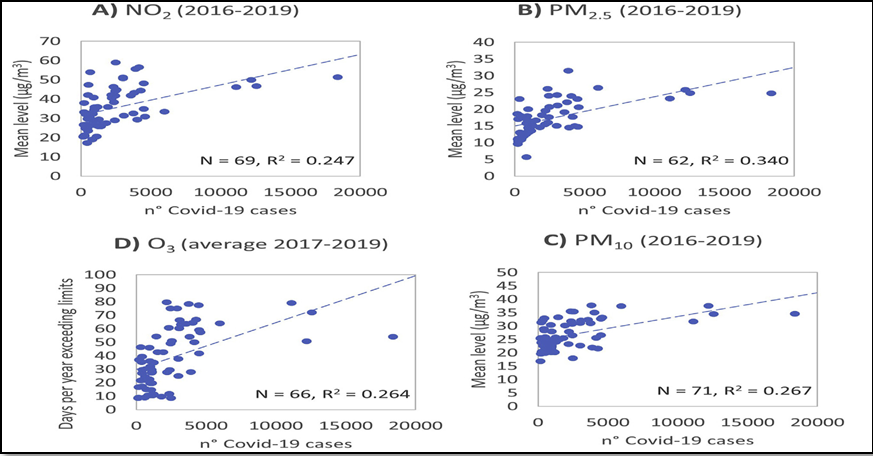
Figure 6 Statistical relation between COVID-19 cases and the air quality parameters.14
In England: Travaglio et al.32 (2021) studied the relation between COVID-19 (cases and deaths) and air pollution (ozone, nitrogen oxides, PM5, PM10, and sulphur dioxide) in England. In Figure 7, red lines indicated significant associations (p≤0.05), while grey lines showed a lack of significance (p>0.05). The figure shows that sulphur dioxide is highly significant with infection rate than other pollutants.
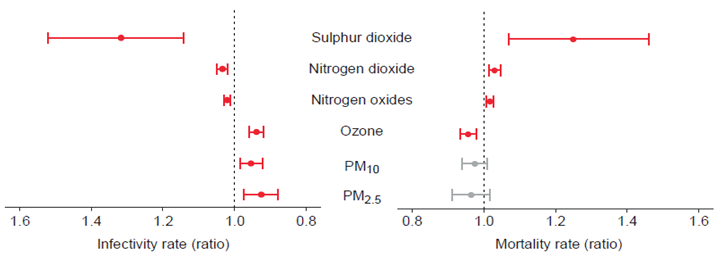
Figure 7 Relation between cases and deaths of COVID-19 and the air quality parameters in England.33
In India: Sahoo33 represented the air quality (PM10, PM5, NO2 and SO2), meteorological parameters (temperature, Relative Humidity, Rainfall and Wind Speed), and COVID-19 infected cases for Delhi, Karnataka, Kerala, and Madhya Pradesh (Table 2). Table shows there is significant relation between air pollutant concentration, meterological parameters and COVID-19 infected cases for Delhi, Karnataka, Kerala, and Madhya Pradesh.
|
Variable |
Descriptive Statistics |
Kerala |
Karnataka |
Delhi |
Madhya Pradesh |
|
|
Air Pollutants |
PM2.5 |
Mean |
80.09 |
74.36 |
144.21 |
75.31 |
|
Std. Deviation |
61.21 |
55.68 |
76.86 |
50.65 |
||
|
PM10 |
Mean |
27.37 |
30.00 |
90.68 |
113.21 |
|
|
Std. Deviation |
7.21 |
6.48 |
41.66 |
19.40 |
||
|
NO2 |
Mean |
99.09 |
28.80 |
48.78 |
31.62 |
|
|
Std. Deviation |
37.75 |
22.26 |
28.61 |
22.85 |
||
|
SO2 |
Mean |
7.07 |
3.03 |
11.69 |
18.44 |
|
|
Std. Deviation |
1.65 |
3.17 |
8.30 |
6.26 |
||
|
Meteorological Factors |
Wind Speed |
Mean |
1.82 |
3.15 |
2.16 |
2.03 |
|
Std. Deviation |
1.30 |
1.18 |
1.07 |
0.96 |
||
|
Temp |
Mean |
28.24 |
27.47 |
24.26 |
29.65 |
|
|
Std. Deviation |
0.52 |
0.85 |
4.24 |
2.39 |
||
|
Relative Humidity |
Mean |
68.93 |
40.32 |
37.56 |
22.79 |
|
|
Std. Deviation |
5.89 |
8.03 |
11.80 |
12.63 |
||
|
Rainfall |
Mean |
1.38 |
0.40 |
0.44 |
0.20 |
|
|
Std. Deviation |
2.31 |
0.92 |
1.01 |
0.65 |
||
|
COVID 19 Cases |
Infected cases |
Mean |
5.15 |
9.44 |
42.42 |
48.24 |
|
Std. Deviation |
8.00 |
9.62 |
72.37 |
65.11 |
||
Table 2 Daily air pollutant levels, meteorological parameters, and daily infected cases from COVID19 in India
(Source: Sahoo, 2021)34
In USA: The Center for Disease Control and the Environmental Pollution Agency (EPA) studied the relation between PM10, PM5, CO, Pb, SO2, NO2 and VOC with COVID-19 cases in California, USA. Results observed that PM10, PM2.5, Pb, VOC, SO2, NO2 and CO have a positive significant for total cases and total mortality. By increase 1μg/m3 in long-term PM2.5 exposure was associated with increase 8% in the COVID-19 rate.34
In Austria: relation between air quality (PM10 and NO2) and COVID-19 hazard rate per 100,000 people during 2019 in Austria were studied (Figure 8). Results observed that NO2 and PM10 were positive significantly with risk of a COVID-19 cases (hazard ratio (HR) = 1.16 and 1.44, respectively).35
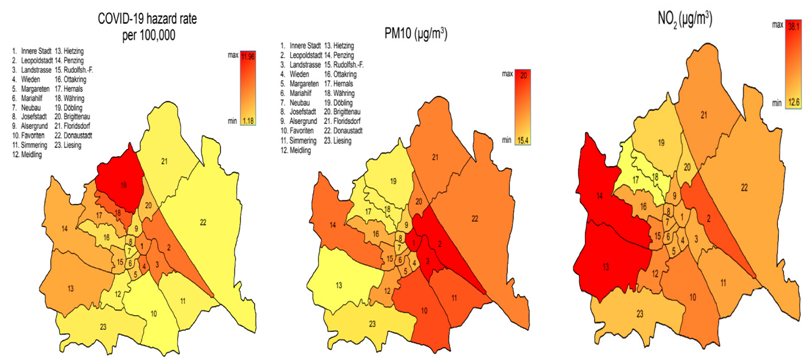
Figure 8 Relation between air pollution levels of PM10 and NO2 and COVID-19 hazard rate per 100,000 people during 2019 in Austria.36
How has the Covid-19 lockdown affected air quality?
Many governments imposed partial lockdown at the beginning of March 2020, which turned into the complete lockdown as the virus spread exponentially across the countries. During March–April 2020, labeled the ‘lockdown’ period, the most human activities were frozen such as many business sectors were shut down, transportation, factories, and social and economic activities. Therefore, it can reasonably expect a reduction in levels of primary pollutants during lockdown when compared with the times of business as usual. Many international and national studies have regarded the two-way impacts between these both crises.29,36–40 Table 3 and Figure 9 show the two-way impacts between these both crises. Some studies regarding the two-way impacts between these both crises are summarized in Table 3.
|
Study area |
Key findings |
Source |
|
China (120 cities) |
Positive significant correlations were found between air quality levels (PM10, PM2.5, NO2 and O3) and COVID-19 confirmed cases. Increase 10 μg/m3 in (PM10, PM2.5, NO2 and O3) would be cause increase in daily confirmed cases by 1.76%, 2.24%, 6.94%, and 4.76%, respectively. Conversely, increase in SO2 by 10 μg/m3 was linked to a 7.79% decrease in COVID-19 confirmed cases. |
Zhu et al.30 |
|
Iran
|
Population density and intra-provincial movement showed a direct correlation with the infection outbreak, while regions with comparatively low wind speed, humidity and solar radiation exposure showed higher rates of infection due to suitable conditions for virus survival. |
Ahmadi et al.37 |
|
India (Delhi) |
Air quality significantly improved during lockdown, with reductions of 39% (PM2.5), 60% (PM10), 53% (NO2) and 30% (CO) compared to 2019. |
Mahato et al.40 |
|
Spain (Barcelona) |
The authors found a reduction in NO2 (-51%) after two weeks of lockdown, mostly related to traffic emissions. PM10 also decreased from -28 to -31%, whereas levels of O3 increased from +33 to +57%. |
Tobías et al.41 |
|
Italy (Milan) |
A significant reduction of PM2.5, PM10, SO2, CO and NOx was observed due to reduced vehicular traffic. O3 increased due to reduction in NO and benzene concentration. |
Collivignarelli et al.39 |
|
USA (New York) |
Meteorological parameters and air quality showed strong correlation with the COVID-19 pandemic. |
Bashir etal.35 |
Table 3 Studies regarding the relation between COVID-19 and air pollution concentrations
Many open questions will be discussed in this review as
Question1: What are the reasons for the reduction in the concentration of pollutant level?
Question2: What are the reasons for the different reduction levels between cities?
Question3: How much reduction of air pollution in quantitative terms due to lockdown?
Question4: What additional factors may affect the pollution level?
The concentration level of air pollutants (Figure 10), including PM10, PM2.5, NO2, SO2 and O3, has been studied by several researchers to study a comparison of air quality before and after the lockdown.
Question1: What are the reasons for the pollutant level reduction?
First reason: Drastically reduce in the anthropogenic activities was performed such as industrial activities, transportation, traveling which are the primary sources of such pollutants.29,40,41
Second reason: Meteorological parameters such as temperature, wind speed, rainfall, solar radiation are factors that highly affect the pollutant concentrations.37
Question2: What are the reasons for the different reduction levels between cities?
Despite the overall average decline in air pollution during the lockdown, there was substantial variation between countries, in terms of both the direction and magnitude of change. The decline in NO2 was relatively ubiquitous over space, however, O3 and PM 2.5 anomalies were more variable.29,38,41 Variation is likely caused by country-specific differences in the major pollution emission sources across different sectors, meteorological factors such as temperature, humidity, and precipitation, and finally the regulations of lockdown. Indeed, the air pollutant concentrations during lockdown vary according to the distribution of emission sources, meteorological conditions, and population densities around sites (Figure 11).

Figure 11 Lockdown comparative response of European cities and highly polluted cities for pollution reduction levels.
Question3: How much reduction of air pollution in quantitative terms due to lockdown?
According to ‘stay-at-home order’, our sky converted from gray to clear blue indicating to the reduction of atmospheric pollution levels. 0The quantitative terms of air quality reduction and the reduction direction of air pollutant levels due to the lockdown will be discussed in this section. Several researchers compared the concentration level of air pollutants (NO2, O3, and PM 2.5) before and after the lockdown. After several studies of the atmospheric emissions data in 2020 after COVID-19, these studies presented different scenarios for air quality due to the lockdown: Significant decreasing scenario (positive effect), significant increasing (negative effect); and/or irregular trends.
Nitrogen dioxide levels during lockdown
A large limitation in the circulation of vehicles as road traffic is the principal outdoor source of NO2 and CO, which reduced significantly over major cities across the globe as shown in Figure 12 & Figure 13. In addition, Figure 13 reveals comparison between NO2 concentrations pre-lockdown and during the lockdown 2020 over the world, East Asia, Europe and North America. It’s obvious from the Figure that NO2 concentration was significantly decreased in all continents under investigation.42 Traffic reduction is likely the main explanation for the fall in NO2 pollution levels during lockdown. Many studies were carried out to interpret the reasons for the different reduction levels between cities.29,41,43 Figure 14 represents the relation between the traffic and NO2 reduction levels.
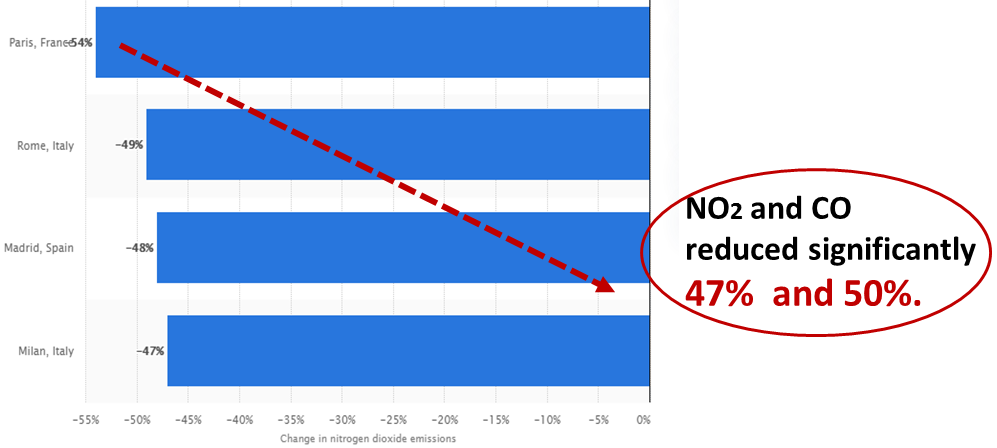
Figure 12 Quantitative estimation of NO2 reduction during COVID-19 lockdown over major cities across the globe.
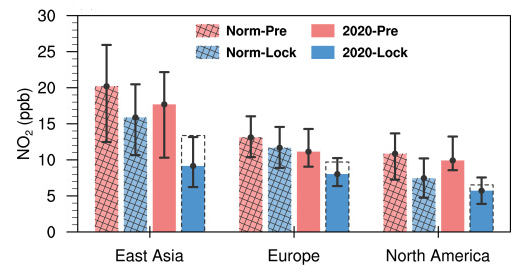
Figure 13 Comparison between the average concentrations of NO2 before and during the lockdown 2020 in Asia, Europe and North America, and the climatological levels for five years (2015–19) at the same time in Ground-based station.43
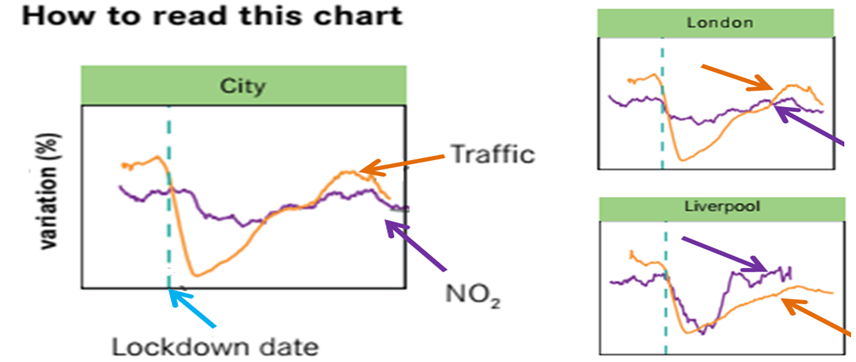
Figure 14 Schematic illustration showed the overall change of NO2 levels with traffic variation during the lockdown.44
Ozone levels during lockdown
Ozone is known as a secondary pollutant produced from solar radiation and its precursors (NO2, CO, and VOCs). O3 reaches its annual maximum level in the spring season (March, April, and May). Figure 15 shows the ozone formation pathway.
Ozone has shown a conflict of irregular trends during the lockdown period with the reduction in NO2 emission. The concentration was increased in several cities (Business area) like, Delhi, Madrid, London, Moscow, Rome, Wuhan and Sao Paulo, while it was reduced in other cities like, Bengaluru and Mumbai.O3 dependent on the local availability of its precursors (NOx and (VOCs). Thus, there are two limited regimes for the ozone formation; the NOx regime and VOCs limited regime. When there was NOx-limited regime (Road site): a reduction in the emission of its main precursor NOx was carried out, leading to a decrease in the O3 levels in atmosphere. However, with VOCs-limited regime (Business area), a decrease in NOx was performed, resulting in either lowering O3 titration or/and more -OH radical, which was able to react with the VOCs, leading to an increase in the O3 formation.44 Additionally, meteorological conditions play an important role in measuring O3 concentration levels. Generally, ozone increases with increase temperature and decrease in high relative humidity. Its production is limited during cold or rainy seasons.45 Figure 16 shows the conflict behaviors of ozone during the lockdown period with the reduction in NO2 emission.46 Here, does this pattern be observed for ozone due to the annual natural processes rather than the effect of COVID-19 lockdown? Several investigators tried to answer this question via comparing the ozone levels during the lockdown and its level in the same months in preceding years. Figure 17 compares the ozone levels during the lockdown and its level pre-lockdown in 2019.
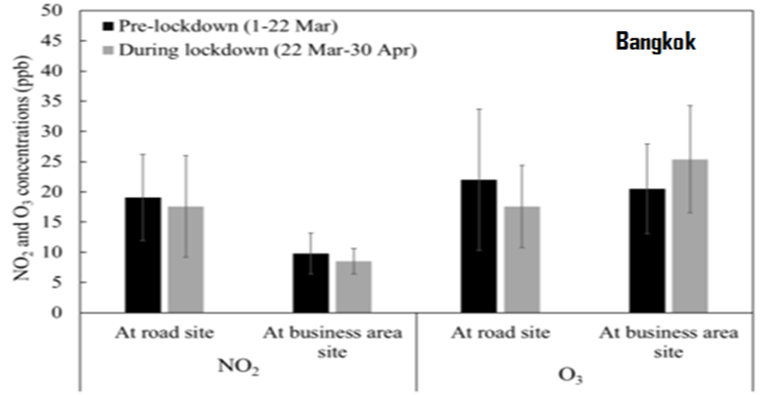
Figure 16 The conflict behaviors of ozone pre- and during the lockdown period with reduction of NO2 emission.47
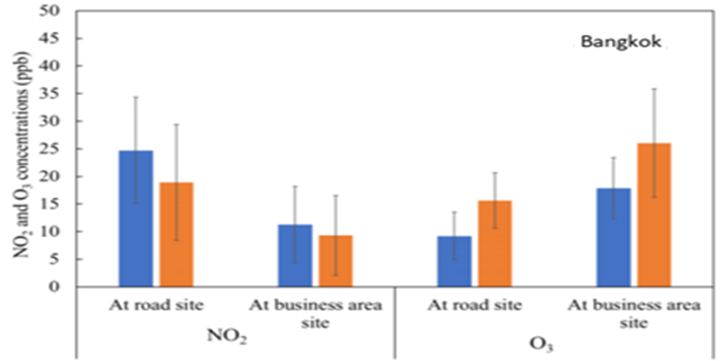
Figure 17 Comparison of ozone levels during the lockdown and its level in pre-lockdown 2019 in Bangkok (Source:.47
5 levels during lockdown
Lockdown revealed a significant decrease in PM2.5 concentrations in different cities around the world during Feb-May 2020 compared to the non-lockdown period in 2019. Unexpectedly, an increase in the PM2.5 concentration was observed (Figure 18). It is very likely that the environmental response, measured as a reduction or increase in the PM concentrations, varies according to not only the dominant source of emission in each country; PM2.5 is more strongly linked to residential energy use, power generation, and agriculture, but also the specific meteorological conditions. Actually, the frozen of activity strongly affect the air quality during the lockdown. Daily trends of the air quality parameters and the mobility levels since the start of lockdown were measured on 20 March 2020; they were summarized and represented in Figure 19.18 Figure 19: Representation of daily trends of the air quality parameters and the mobility levels measured in lockdown (20 Mar 2020).18
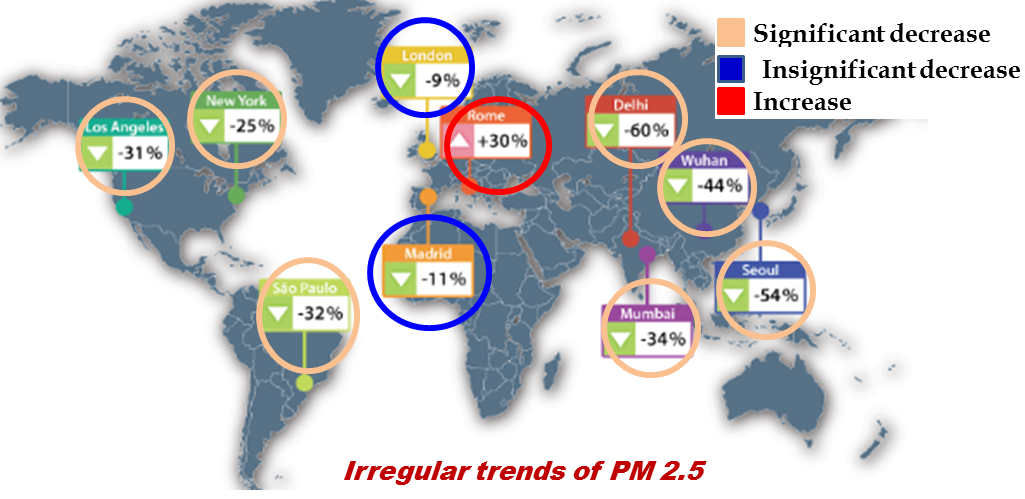
Figure 18 Map illustrates the overall irregular change of PM2.5 during the lockdown.50
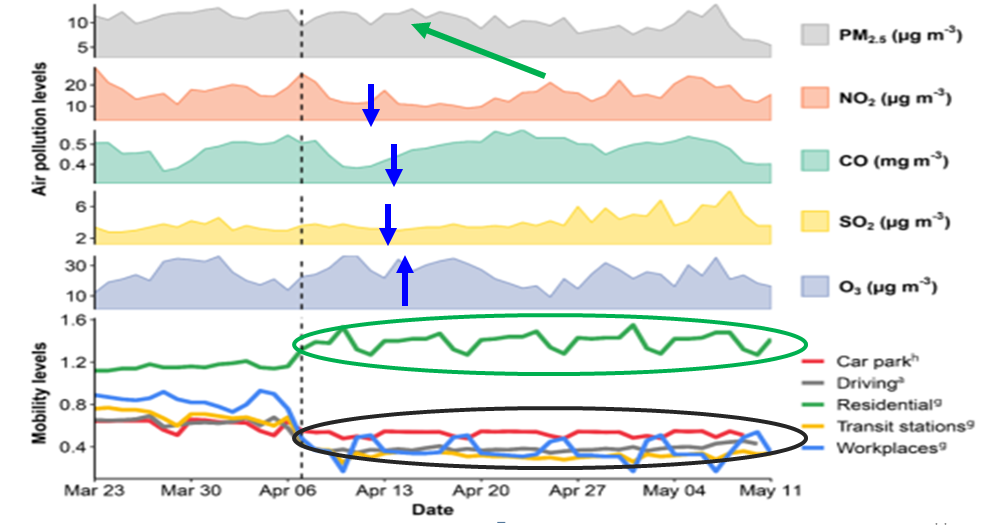
Figure 19 Representation of daily trends of the air quality parameters and the mobility levels measured in lockdown (20 Mar 2020).19
Question 4: weather air pollution would be as serious crisis as COVID-19 in the long term?
Indeed, Air pollution is a silent killer. Hence, we need to fight for better air quality. Figure 20 depicts the increase in the number of deaths each year due to poor air quality, hence these render all to cooperate to reduce the air pollutants and augment the air quality.
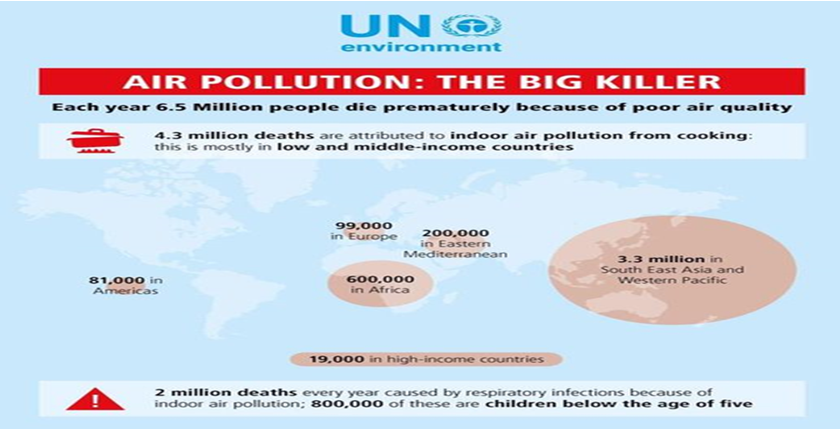
Figure 20 The image represents the number of deaths each year caused by the poor air quality.54
Short-term exposure to condensed and higher concentrations of air pollutants (PM2.5, PM10, NO2 and O3) increases the level of risk for COVID-19 infections. In addition, the meteorological factors such as temperature and relative humidity affected the daily infected cases. There was positive association between temperature range and COVID-19-infected cases but negatively correlated with relative humidity. On other hand, the exposure to high concentration of SO2 may not be related to COVID-19-infected cases and its increased risk.
Consequently, actions towards air quality should be launched from now, through managing competing interests and giving priority to different country sectors. That is, a synergy must be found between three key points; community health, environmental protection, and economic benefits.47–53
None.
The authors declare that there is no conflict of interest.

©2021 Mohammed, et al. This is an open access article distributed under the terms of the, which permits unrestricted use, distribution, and build upon your work non-commercially.