Submit manuscript...
eISSN: 2574-9927

Material Science & Engineering International Journal

Research Article Volume 3 Issue 2

A finite element analysis of fractured sandwich composite structures under small scale yielding 

Ilias Tourlomousiss, Efstathios E Theotokoglou

Department of Mechanics Laboratory of Testing and Materials, National Technical University of Athens, Greece

Correspondence: Ilias Tourlomousiss, Department of Mechanics Laboratory of Testing and Materials, School of Applied Mathematical and Physical Science, National Technical University of Athens, Zografou Campus 15773, Athens, Greece

Received: December 27, 2018 | Published: March 22, 2019

Citation: Tourlomousiss I, Theotokoglou EE. A finite element analysis of fractured sandwich composite structures under small scale yielding. Material Sci & Eng. 2019;3(2):45-49. DOI: 10.15406/mseij.2019.03.00088

Download PDF

Abstract

In this paper a sandwich composite beam under three point bending. In the core material of the beam an initially small crack is considered. In this study a computational analysis is developed based on the extension of Elastic Fracture Mechanics to the Elasto-plastic Fracture Mechanics. The plastic zone length and the distribution of the stress field around the crack tip are evaluated. Furthermore an analysis of the cracking propagation path utilizing concepts of the Elastoplastic Fracture Mechanics Theory is performed. A finite element analysis code has been developed in order to predict the position of the direction and the length of the plastic zone ahead of the crack tip.

Keywords: composite structure, computational analysis, fiber reinforced plastics, fracture mechanics, von mises and tresca yielding criteria, stress intensity factors

Introduction

The fracture behavior in sandwich composite structures has been directed toward the understanding of crack propagation, and at the same time toward improving the durability of composites against fracture [1-4]. A crack flaw may be introduced during processing or subsequent service conditions. It may result from low velocity impact, from eccentricities in the structural load path, or from discontinuities in structures, which induce a significant out-of-plane stress. Generally for a state of plane stress the stresses normal to the plane of interest are negligibly small. On the other hand plane strain is assumed to occur where the strains to the normal plane are negligibly small. In our study both these cases will be studied. The sandwich beam considered is shown in Figure 1. Material properties and geometrical data are shown in Tables 1 & Tables 2 respectively. Additional information regarding material properties as shear and tensile strength, are given in Table 3. In this study combining the elastoplastic concepts approach with the step by step crack propagation inside the core of a sandwich beam very close to the upper skin interface, a numerical solution is proposed via the finite element analysis.1‒4 An initial crack length is assumed. Methods of evaluating the plastic zone under mixed mode loading conditions and small scale yielding ARE presented. In the presence of plastic zone at the crack tip the stiffness of the component decreases and the compliance increases. To incorporate the effect of plasticity in Fracture analysis the crack is mathematically modeled to be longer than the actual length. In the finite element model this is incorporated by taking into account the radius of singular elements around the crack tip. This radius is at the same order of magnitude with the crack tip plastic zone confronted in our analysis. The relations which relate the fracture parameters and the radius of the plastic as well as the direction of the propagation zone under the three point bending are presented. The extension of the plastic zone along the crack axis is succeeded by finding the point at which one of the yield criteria is satisfied. It is quite difficult to give a proper description of plastic zone shape and size. In all the models to simplify the analysis the material is assumed to be elastic-perfectly plastic. In this study considering that the plastic zones are created around the tips of the cracks under small scale yielding, the stress fields are determined in terms of the stress intensity factors using the asymptotic solutions.

Figure 1 The model of the fractured sandwich beam and the applied loading.

Material

Ε ( MPa)

Poisson ratio ν

Upper and Lower material Layers (isotropic glass reinforced)

16300

0.3

Core material (PVC foam , R75 by DIAB)2

80

0.4

Table 1 Material data of the beam2)

Length, L(mm)

228.6

Width,b(mm)

63.5

Width of the upper and lower layer t1,t2 (mm)

2.28

Distance of support from edges L΄ (mm)

5

Crack length a (mm)

2,5,10,20,25,27,30

Distance of crack from the upper face sheet ,d (mm)

1

Table 2 Geometrical data of the beam

Density: (kg/m3)

75.3

Compressive strength (Mpa)

1.1

Compressive modulus (Mpa)

38

Tensile Strength (Mpa)

2

Tensile modulus(Mpa)

62

Shear strength (Mpa)

0.9

Shear modulus (Mpa)

29

Table 3 Mechanical properties of R-752

Theoretical background

Methods of evaluating plastic zone

At first our intention is to compare the plastic zone size in plane stress and plane strain conditions inside the core material of the sandwich beam. The stress field (Mode-I) close to the crack tip is given in terms of stress intensity factors at the polar coordinate system (r, θ) by: 4‒8

( σ x σ y τ xy )= K I 2πr cos(θ/2){ 1sin(θ/2)sin(3θ/2) 1+sin(θ/2)sin(3θ/2) sin(θ/2)cos(3θ/2) } MathType@MTEF@5@5@+= feaagKart1ev2aaatCvAUfeBSjuyZL2yd9gzLbvyNv2CaerbuLwBLn hiov2DGi1BTfMBaeXatLxBI9gBaerbd9wDYLwzYbItLDharqqtubsr 4rNCHbGeaGqiVu0Je9sqqrpepC0xbbL8F4rqqrFfpeea0xe9Lq=Jc9 vqaqpepm0xbba9pwe9Q8fs0=yqaqpepae9pg0FirpepeKkFr0xfr=x fr=xb9adbaqaaeGaciGaaiaabeqaamaabaabaaGcbaqcfayaamaabm aabaqcLbsafaaaaaWabaaajuaGbaacciGae83Wdm3aaSbaaeaajugW aiaadIhaaKqbagqaaaqaaKqzGeGae83Wdmxcfa4aaSbaaeaajugWai aadMhaaKqbagqaaaqaaKqzGeGae8hXdqxcfa4aaSbaaeaajugWaiaa dIhacaWG5baajuaGbeaaaaaacaGL9baajugibiaad2dajuaGdaWcaa qaaKqzGeGaam4saKqbaoaaBaaabaqcLbsacaWGjbaajuaGbeaaaeaa daGcaaqaaKqzGeGaaeOmaiaabc8acaqGYbaajuaGbeaaaaqcLbsaca qGJbGaae4BaiaabohacaWGOaGae8hUdeNaai4laiaabkdacaWGPaqc fa4aaiWaaeaajugibuaaaaaadeaaaKqbagaajugibiaabgdacqGHsi slcaqGZbGaaeyAaiaab6gacaWGOaGae8hUdeNaai4laiaabkdacaWG PaGaae4CaiaabMgacaqGUbGaamikaiaabodacqWF4oqCcaGGVaGaae OmaiaadMcaaKqbagaajugibiaabgdacaWGRaGaae4CaiaabMgacaqG UbGaamikaiab=H7aXjaac+cacaqGYaGaamykaiaabohacaqGPbGaae OBaiaadIcacaqGZaGae8hUdeNaai4laiaabkdacaWGPaaajuaGbaqc LbsacaqGZbGaaeyAaiaab6gacaWGOaGae8hUdeNaai4laiaabkdaca WGPaGaae4yaiaab+gacaqGZbGaamikaiaabodacqWF4oqCcaGGVaGa aeOmaiaadMcaaaaajuaGcaGL7baaaaaa@92A6@    (1)

The corresponding principal stresses (Mode-I) are given as:

σ Ι σ ΙΙ σ ΙΙΙ }= Κ Ι 2πr cos θ 2 { 1+sin θ 2 1sin θ 2 0 for plane stress 2νcos θ 2 for plane strain MathType@MTEF@5@5@+= feaagKart1ev2aaatCvAUfeBSjuyZL2yd9gzLbvyNv2CaerbuLwBLn hiov2DGi1BTfMBaeXatLxBI9gBaerbd9wDYLwzYbItLDharqqtubsr 4rNCHbGeaGqiVu0Je9sqqrpepC0xbbL8F4rqqrFfpeea0xe9Lq=Jc9 vqaqpepm0xbba9pwe9Q8fs0=yqaqpepae9pg0FirpepeKkFr0xfr=x fr=xb9adbaqaaeGaciGaaiaabeqaamaabaabaaGcbaqcfa4aaiGaae aafaqabeWabaaabaacciGae83Wdm3cdaWgaaqcfayaaKqzadGaeuyM dKeajuaGbeaaaeaacqWFdpWCdaWgaaqaaKqzadGaeuyMdKKaeuyMdK eajuaGbeaaaeaacqWFdpWCdaWgaaqaaKqzadGaeuyMdKKaeuyMdKKa euyMdKeajuaGbeaaaaaacaGL9baacqGH9aqpdaWcaaqaaiabfQ5aln aaBaaabaGaeuyMdKeabeaaaeaadaGcaaqaaiaaikdacqWFapaCcaWG YbaabeaaaaGaci4yaiaac+gacaGGZbWaaSaaaeaacqWF4oqCaeaaca aIYaaaamaaceaabaqbaeqabqqaaaaabaGaaGymaiabgUcaRiGacoha caGGPbGaaiOBamaalaaabaGae8hUdehabaGaaGOmaaaaaeaacaaIXa GaeyOeI0Iaci4CaiaacMgacaGGUbWaaSaaaeaacqWF4oqCaeaacaaI YaaaaaqaaiaaicdafaqabeqacaaabaGaamOzaiaad+gacaWGYbaaba GaamiCaiaadYgacaWGHbGaamOBaiaadwgacaqGGaGaam4Caiaadsha caWGYbGaamyzaiaadohacaWGZbaaaaqaaiaaikdacqaH9oGBciGGJb Gaai4BaiaacohadaWcaaqaaiab=H7aXbqaaiaaikdaaaqbaeqabeGa aaqaaiaadAgacaWGVbGaamOCaaqaaiaadchacaWGSbGaamyyaiaad6 gacaWGLbGaaeiiaiaadohacaWG0bGaamOCaiaadggacaWGPbGaamOB aaaaaaaacaGL7baaaaa@8C12@    (2)

The following Yield criteria will be used in our study:5‒8

Von Mises Criterion:

( σ I σ II ) 2 + ( σ II σ III ) 2 + ( σ III σ I ) 2 2 σ ys 2 MathType@MTEF@5@5@+= feaagKart1ev2aaatCvAUfeBSjuyZL2yd9gzLbvyNv2CaerbuLwBLn hiov2DGi1BTfMBaeXatLxBI9gBaerbd9wDYLwzYbItLDharqqtubsr 4rNCHbGeaGqiVu0Je9sqqrpepC0xbbL8F4rqqrFfpeea0xe9Lq=Jc9 vqaqpepm0xbba9pwe9Q8fs0=yqaqpepae9pg0FirpepeKkFr0xfr=x fr=xb9adbaqaaeGaciGaaiaabeqaamaabaabaaGcbaqcfayaaKqzGe GaamikaGGaciab=n8aZLqbaoaaBaaabaqcLbsacaWGjbaajuaGbeaa jugibiabgkHiTiab=n8aZLqbaoaaBaaabaqcLbsacaWGjbGaamysaa qcfayabaqcLbsacaWGPaqcfa4aaWbaaeqabaqcLbmacaqGYaaaaKqz GeGaam4kaiaadIcacqWFdpWCjuaGdaWgaaqaaKqzGeGaamysaiaadM eaaKqbagqaaKqzGeGaeyOeI0Iae83Wdmxcfa4aaSbaaeaajugibiaa dMeacaWGjbGaamysaaqcfayabaqcLbsacaWGPaWcdaahaaqcfayabe aajugWaiaabkdaaaqcLbsacaWGRaGaamikaiab=n8aZLqbaoaaBaaa baqcLbsacaWGjbGaamysaiaadMeaaKqbagqaaKqzGeGaeyOeI0Iae8 3Wdmxcfa4aaSbaaeaajugibiaadMeaaKqbagqaaKqzGeGaamykaSWa aWbaaKqbagqabaqcLbmacaqGYaaaaKqzGeGaeyyzImRaaeOmaiab=n 8aZTWaa0baaKqbagaalmaaBaaajuaGbaqcLbmacaWG5bGaam4Caaqc fayabaaabaqcLbmacaqGYaaaaaaaaa@7655@    (3)

Where the yield strength in uniaxial tension.

Tresca Criterion:

( σ I σ II ) 2 2 σ ys 2 MathType@MTEF@5@5@+= feaagKart1ev2aaatCvAUfeBSjuyZL2yd9gzLbvyNv2CaerbuLwBLn hiov2DGi1BTfMBaeXatLxBI9gBaerbd9wDYLwzYbItLDharqqtubsr 4rNCHbGeaGqiVu0Je9sqqrpepC0xbbL8F4rqqrFfpeea0xe9Lq=Jc9 vqaqpepm0xbba9pwe9Q8fs0=yqaqpepae9pg0FirpepeKkFr0xfr=x fr=xb9adbaqaaeGaciGaaiaabeqaamaabaabaaGcbaqcfayaamaala aabaGaamikaGGaciab=n8aZnaaBaaabaGaamysaaqabaGaeyOeI0Ia e83Wdm3aaSbaaeaacaWGjbGaamysaaqabaGaamykaSWaaWbaaKqbag qabaqcLbmacaqGYaaaaaqcfayaaiaabkdaaaGaeyyzIm7aaSaaaeaa cqWFdpWCdaWgaaqaaiaadMhacaWGZbaabeaaaeaacaqGYaaaaaaaaa@4952@    (4)

 Where  is the yield stress in pure shearing.

Substituting, σI and σII from (2) in the above equations, the plastic zone size is obtained. The plastic zone length using Mises yield criterion is given by:7,8,11

For plane strain (θ=0, v=1/3):

r p = 1 18π ( K I σ ys ) 2 MathType@MTEF@5@5@+= feaagKart1ev2aaatCvAUfeBSjuyZL2yd9gzLbvyNv2CaerbuLwBLn hiov2DGi1BTfMBaeXatLxBI9gBaerbd9wDYLwzYbItLDharqqtubsr 4rNCHbGeaGqiVu0Je9sqqrpepC0xbbL8F4rqqrFfpeea0xe9Lq=Jc9 vqaqpepm0xbba9pwe9Q8fs0=yqaqpepae9pg0FirpepeKkFr0xfr=x fr=xb9adbaqaaeGaciGaaiaabeqaamaabaabaaGcbaqcfayaaiaadk halmaaBaaajuaGbaqcLbmacaWGWbaajuaGbeaacaWG9aWaaSaaaeaa caqGXaaabaGaaeymaiaabIdaiiGacqWFapaCaaGaamikamaalaaaba Gaam4samaaBaaabaGaamysaaqabaaabaGae83Wdm3aaSbaaeaajugW aiaadMhacaWGZbaajuaGbeaaaaGaamykamaaCaaabeqaaKqzadGaae Omaaaaaaaa@4A60@    (5)

For plane stress (θ=0,ν=1/3):

r p = 1 2π ( K I σ ys ) 2 MathType@MTEF@5@5@+= feaagKart1ev2aaatCvAUfeBSjuyZL2yd9gzLbvyNv2CaerbuLwBLn hiov2DGi1BTfMBaeXatLxBI9gBaerbd9wDYLwzYbItLDharqqtubsr 4rNCHbGeaGqiVu0Je9sqqrpepC0xbbL8F4rqqrFfpeea0xe9Lq=Jc9 vqaqpepm0xbba9pwe9Q8fs0=yqaqpepae9pg0FirpepeKkFr0xfr=x fr=xb9adbaqaaeGaciGaaiaabeqaamaabaabaaGcbaqcfayaaiaadk hadaWgaaqaaiaadchaaeqaaiaad2dadaWcaaqaaiaabgdaaeaacaaI YaacciGae8hWdahaaiaadIcadaWcaaqaaiaadUeadaWgaaqaaiaadM eaaeqaaaqaaiab=n8aZnaaBaaabaGaamyEaiaadohaaeqaaaaacaWG PaWcdaahaaqcfayabeaajugWaiaabkdaaaaaaaa@4635@    (6)

The plastic zones magnitude (rp1,rp2) for plane strain and plane stress conditions according to relations (5) and (6) respectively are plotted in Figure 2. It can also be shown the variation of the σyy along the crack axis (x) and ahead of the crack tip. It is observed from Figure 2 that the plastic zone length (rp1) for plane strain is lower than that the plastic zone length in plane stress (rp2). Taking the Poisson ratio as ν=1/3 and using the Tresca yield criterion the maximum yield stress in plane strain is three times higher than the maximum yield stress in plane stress conditions.
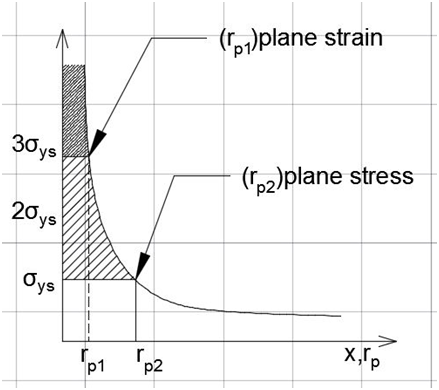
Figure 2 The plastic zone length11 under plane stress and plane strain conditions.

The plastic zone shape

In this part of our study the shape of the plastic zone will be determined from a polar plot. We can find  for the same. It is useful to compare relatively the plastic zones for plane stress and plane strain conditions. This gives the first order approximation of the shape. The relationships involving the angle theta (θ) of the polar coordinate system (r,θ) at the crack tip and the plastic zone length for Mode-I and Mode -II conditions are:7,8,11

For Mode-I plane stress:

r P = 1 ( Κ Ι σ ys ) 2 ( 1+ 3 2 sin 2 θ+cosθ ) for VonMises MathType@MTEF@5@5@+= feaagKart1ev2aaatCvAUfeBSjuyZL2yd9gzLbvyNv2CaerbuLwBLn hiov2DGi1BTfMBaeXatLxBI9gBaerbd9wDYLwzYbItLDharqqtubsr 4rNCHbGeaGqiVu0Je9sqqrpepC0xbbL8F4rqqrFfpeea0xe9Lq=Jc9 vqaqpepm0xbba9pwe9Q8fs0=yqaqpepae9pg0FirpepeKkFr0xfr=x fr=xb9adbaqaaeGaciGaaiaabeqaamaabaabaaGcbaqcfayaaKqzGe GaamOCaKqbaoaaBaaabaqcLbmacaWGqbaajuaGbeaajugibiaad2da juaGdaWcaaqaaKqzGeGaaeymaaqcfayaaKqzGeGaaeinaiaabc8aaa qcfa4aaeWaaeaadaWcaaqaaKqzGeGaamOMdKqbaoaaBaaabaqcLbsa caWGzoaajuaGbeaaaeaaiiGajugibiab=n8aZLqbaoaaBaaabaqcLb sacaWG5bGaam4CaaqcfayabaaaaaGaayjkaiaawMcaamaaCaaabeqa aKqzadGaaeOmaaaajuaGdaqadaqaaKqzGeGaaeymaiaadUcajuaGda WcaaqaaKqzGeGaae4maaqcfayaaKqzGeGaaeOmaaaacaqGZbGaaeyA aiaab6galmaaCaaajuaGbeqaaKqzadGaaeOmaaaajugibiab=H7aXj aadUcacaqGJbGaae4BaiaabohacqWF4oqCaKqbakaawIcacaGLPaaa jugibuaaaaaabiaaaKqbagaajugibiaadAgacaWGVbGaamOCaaqcfa yaaKqzGeGaamOvaiaad+gacaWGUbGaamytaiaadMgacaWGZbGaamyz aiaadohaaaaaaaa@72AE@    (7)

r P = 1 2π ( Κ Ι σ ys ) 2 ( cos θ 2 ( 1+sin θ 2 ) ) 2 for Tresca MathType@MTEF@5@5@+= feaagKart1ev2aaatCvAUfeBSjuyZL2yd9gzLbvyNv2CaerbuLwBLn hiov2DGi1BTfMBaeXatLxBI9gBaerbd9wDYLwzYbItLDharqqtubsr 4rNCHbGeaGqiVu0Je9sqqrpepC0xbbL8F4rqqrFfpeea0xe9Lq=Jc9 vqaqpepm0xbba9pwe9Q8fs0=yqaqpepae9pg0FirpepeKkFr0xfr=x fr=xb9adbaqaaeGaciGaaiaabeqaamaabaabaaGcbaqcfayaaiaadk hadaWgaaqaaiaadcfaaeqaaiaad2dadaWcaaqaaiaabgdaaeaacaqG YaacciGae8hWdahaamaabmaabaWaaSaaaeaacaWGAoWaaSbaaeaaca WGzoaabeaaaeaacqWFdpWCdaWgaaqaaiaadMhacaWGZbaabeaaaaaa caGLOaGaayzkaaWaaWbaaeqabaqcLbmacaqGYaaaaKqbaoaabmaaba Gaae4yaiaab+gacaqGZbWaaSaaaeaacqWF4oqCaeaacaqGYaaaaiab =DHiQmaabmaabaGaaeymaiaadUcacaqGZbGaaeyAaiaab6gadaWcaa qaaiab=H7aXbqaaiaabkdaaaaacaGLOaGaayzkaaaacaGLOaGaayzk aaWaaWbaaeqabaqcLbmacaqGYaaaaKqbawaaaaaabiaaaeaacaWGMb Gaam4BaiaadkhaaeaacaWGubGaamOCaiaadwgacaWGZbGaam4yaiaa dggaaaaaaaa@61B4@    (8)

For Mode I plane strain:

r P = 1 4π ( Κ Ι σ ys ) 2 ( 3 2 sin 2 θ+ (1) 2 ( 1+cosθ ) ) for VonMises MathType@MTEF@5@5@+= feaagKart1ev2aaatCvAUfeBSjuyZL2yd9gzLbvyNv2CaerbuLwBLn hiov2DGi1BTfMBaeXatLxBI9gBaerbd9wDYLwzYbItLDharqqtubsr 4rNCHbGeaGqiVu0Je9sqqrpepC0xbbL8F4rqqrFfpeea0xe9Lq=Jc9 vqaqpepm0xbba9pwe9Q8fs0=yqaqpepae9pg0FirpepeKkFr0xfr=x fr=xb9adbaqaaeGaciGaaiaabeqaamaabaabaaGcbaqcfayaaiaadk hadaWgaaqaaiaadcfaaeqaaiaad2dadaWcaaqaaiaabgdaaeaacaqG 0aacciGae8hWdahaamaabmaabaWaaSaaaeaacaWGAoWaaSbaaeaaca WGzoaabeaaaeaacqWFdpWCdaWgaaqaaiaadMhacaWGZbaabeaaaaaa caGLOaGaayzkaaWaaWbaaeqabaqcLbmacaqGYaaaaKqbaoaabmaaba WaaSaaaeaacaqGZaaabaGaaeOmaaaacaqGZbGaaeyAaiaab6gadaah aaqabeaajugWaiaabkdaaaqcfaOaamiUdiaadUcacaWGOaGaaeymai abgkHiTiaabkdacaqG9oGaamykaSWaaWbaaKqbagqabaqcLbmacaqG YaaaaKqbaoaabmaabaGaaeymaiaadUcacaqGJbGaae4Baiaabohacq WF4oqCaiaawIcacaGLPaaaaiaawIcacaGLPaaafaaaaaqacaaabaGa amOzaiaad+gacaWGYbaabaGaamOvaiaad+gacaWGUbGaamytaiaadM gacaWGZbGaamyzaiaadohaaaaaaaa@6AFA@    (9)

r P = 1 2π ( Κ Ι σ ys ) 2 ( cos θ 2 ( 1+sin θ 2 ) ) 2 for Tresca MathType@MTEF@5@5@+= feaagKart1ev2aaatCvAUfeBSjuyZL2yd9gzLbvyNv2CaerbuLwBLn hiov2DGi1BTfMBaeXatLxBI9gBaerbd9wDYLwzYbItLDharqqtubsr 4rNCHbGeaGqiVu0Je9sqqrpepC0xbbL8F4rqqrFfpeea0xe9Lq=Jc9 vqaqpepm0xbba9pwe9Q8fs0=yqaqpepae9pg0FirpepeKkFr0xfr=x fr=xb9adbaqaaeGaciGaaiaabeqaamaabaabaaGcbaqcfayaaiaadk hadaWgaaqaaiaadcfaaeqaaiaad2dadaWcaaqaaiaabgdaaeaacaqG YaacciGae8hWdahaamaabmaabaWaaSaaaeaacaWGAoWaaSbaaeaaca WGzoaabeaaaeaacaWGdpWaaSbaaeaacaWG5bGaam4CaaqabaaaaaGa ayjkaiaawMcaaSWaaWbaaKqbagqabaqcLbmacaqGYaaaaKqbaoaabm aabaGaae4yaiaab+gacaqGZbWaaSaaaeaacqWF4oqCaeaacaqGYaaa aiab=DHiQmaabmaabaGaaeymaiaadUcacaqGZbGaaeyAaiaab6gada Wcaaqaaiab=H7aXbqaaiaabkdaaaaacaGLOaGaayzkaaaacaGLOaGa ayzkaaWcdaahaaqcfayabeaajugWaiaabkdaaaqcfaybaaaaaeGaaa qaaiaadAgacaWGVbGaamOCaaqaaiaadsfacaWGYbGaamyzaiaadoha caWGJbGaamyyaaaaaaaa@6273@    (10)

For Mode II plane stress:

r P = 1 8π ( Κ II σ ys ) 2 ( 149 sin 2 θ2cosθ ) for VonMises MathType@MTEF@5@5@+= feaagKart1ev2aaatCvAUfeBSjuyZL2yd9gzLbvyNv2CaerbuLwBLn hiov2DGi1BTfMBaeXatLxBI9gBaerbd9wDYLwzYbItLDharqqtubsr 4rNCHbGeaGqiVu0Je9sqqrpepC0xbbL8F4rqqrFfpeea0xe9Lq=Jc9 vqaqpepm0xbba9pwe9Q8fs0=yqaqpepae9pg0FirpepeKkFr0xfr=x fr=xb9adbaqaaeGaciGaaiaabeqaamaabaabaaGcbaqcfayaaKqzGe GaamOCaKqbaoaaBaaabaqcLbsacaWGqbaajuaGbeaajugibiaad2da juaGdaWcaaqaaKqzGeGaaeymaaqcfayaaKqzGeGaaeioaGGaciab=b 8aWbaajuaGdaqadaqaamaalaaabaqcLbsacaWGAoqcfa4aaSbaaeaa jugibiaadMeacaWGjbaajuaGbeaaaeaajugibiab=n8aZLqbaoaaBa aabaqcLbsacaWG5bGaam4CaaqcfayabaaaaaGaayjkaiaawMcaaSWa aWbaaKqbagqabaqcLbmacaqGYaaaaKqbaoaabmaabaqcLbsacaaIXa GaaGinaiabgkHiTiaaiMdaciGGZbGaaiyAaiaac6gajuaGdaahaaqa beaajugWaiaaikdaaaqcLbsacqWF4oqCcqGHsislcaaIYaGaci4yai aac+gacaGGZbGae8hUdehajuaGcaGLOaGaayzkaaqcLbsafaaaaaqa caaajuaGbaqcLbsacaWGMbGaam4BaiaadkhaaKqbagaajugibiaadA facaWGVbGaamOBaiaad2eacaWGPbGaam4CaiaadwgacaWGZbaaaaaa aa@72A8@    (11)

For Mode II plane strain:

r P = 1 8π ( Κ II σ ys ) 2 ( 12+2(1cosθ) (12ν) 2 9 sin 2 θ ) for VonMises MathType@MTEF@5@5@+= feaagKart1ev2aaatCvAUfeBSjuyZL2yd9gzLbvyNv2CaerbuLwBLn hiov2DGi1BTfMBaeXatLxBI9gBaerbd9wDYLwzYbItLDharqqtubsr 4rNCHbGeaGqiVu0Je9sqqrpepC0xbbL8F4rqqrFfpeea0xe9Lq=Jc9 vqaqpepm0xbba9pwe9Q8fs0=yqaqpepae9pg0FirpepeKkFr0xfr=x fr=xb9adbaqaaeGaciGaaiaabeqaamaabaabaaGcbaqcfayaaiaadk hadaWgaaqaaiaadcfaaeqaaiaad2dadaWcaaqaaiaabgdaaeaacaqG 4aacciGae8hWdahaamaabmaabaWaaSaaaeaacaWGAoWaaSbaaeaaca WGjbGaamysaaqabaaabaGae83Wdm3aaSbaaeaacaWG5bGaam4Caaqa baaaaaGaayjkaiaawMcaaSWaaWbaaKqbagqabaqcLbmacaqGYaaaaK qbaoaabmaabaGaaGymaiaaikdacqGHRaWkcaaIYaGaaiikaiaaigda cqGHsislciGGJbGaai4BaiaacohacqWF4oqCcaGGPaGaaiikaiaaig dacqGHsislcaaIYaGaeqyVd4MaaiykaSWaaWbaaKqbagqabaqcLbma caaIYaaaaKqbakabgkHiTiaaiMdaciGGZbGaaiyAaiaac6gadaahaa qabeaajugWaiaaikdaaaqcfaOae8hUdehacaGLOaGaayzkaaqbaaaa aeGaaaqaaiaadAgacaWGVbGaamOCaaqaaiaadAfacaWGVbGaamOBai aad2eacaWGPbGaam4CaiaadwgacaWGZbaaaaaaaa@6FCA@    (12)

The shape of the plastic zone for plane strain and plane stress conditions and the considered yield criteria are shown at the following polar plots. The stress intensity factors Κa (a=I, II) for the relationships (7-12) in the general case of the infinite body with a crack may be obtained from Figure 3 & Figure 4 & Figure 5:

Figure 3 Polar plot for Mode-I, Tresca yield criterion.

Figure 4 Polar plot for Mode-I, Von Mises yield criterion.

Figure 5 Polar plot for Mode-II, Von Mises yield criterion.

K II = τ yy πa MathType@MTEF@5@5@+= feaagKart1ev2aaatCvAUfeBSjuyZL2yd9gzLbvyNv2CaerbuLwBLn hiov2DGi1BTfMBaeXatLxBI9gBaerbd9wDYLwzYbItLDharqqtubsr 4rNCHbGeaGqiVu0Je9sqqrpepC0xbbL8F4rqqrFfpeea0xe9Lq=Jc9 vqaqpepm0xbba9pwe9Q8fs0=yqaqpepae9pg0FirpepeKkFr0xfr=x fr=xb9adbaqaaeGaciGaaiaabeqaamaabaabaaGcbaqcfayaaiaadU eadaWgaaqaaKqzadGaamysaiaadMeaaKqbagqaaiaad2daiiGacqWF epaDlmaaBaaajuaGbaqcLbmacaWG5bGaamyEaaqcfayabaaadaGcaa qaaiab=b8aWjaadggaaeqaaaaa@447C@    (13)

for Mode I where σyy is the remotely applied normal stress (Figure 6B) and:

K II = τ yy πa MathType@MTEF@5@5@+= feaagKart1ev2aaatCvAUfeBSjuyZL2yd9gzLbvyNv2CaerbuLwBLn hiov2DGi1BTfMBaeXatLxBI9gBaerbd9wDYLwzYbItLDharqqtubsr 4rNCHbGeaGqiVu0Je9sqqrpepC0xbbL8F4rqqrFfpeea0xe9Lq=Jc9 vqaqpepm0xbba9pwe9Q8fs0=yqaqpepae9pg0FirpepeKkFr0xfr=x fr=xb9adbaqaaeGaciGaaiaabeqaamaabaabaaGcbaqcfayaaiaadU eadaWgaaqaaKqzadGaamysaiaadMeaaKqbagqaaiaad2daiiGacqWF epaDlmaaBaaajuaGbaqcLbmacaWG5bGaamyEaaqcfayabaaadaGcaa qaaiab=b8aWjaadggaaeqaaaaa@447C@    (14)

for Mode II where τxy is the remotely applied shear stress Figure 6A.

Solution of the problem

Crack propagation procedure

First a finite element model is introduced Figure 6. Contact analysis is assumed at the neighbor of the applied load and the supports. The ultimate load is kept constant during all steps of analyses. An initial crack with length 2mm is considered under the central load introduction and close to the upper skin interface. This crack is considering propagate under the interface to the left in accordance with the experimental verification.9 Furthermore between the upper and lower crack flanks we introduce contact elements and a self-contact nonlinear analysis in order to prevent the interpenetration between the crack lips. This model was solved in Abaqus.9 A number of twelve models have been solved. From every run we retrieve the stress intensity factors (KI,KII), the stress tensor at the crack tip and the principal stresses, the principal planes and the planes of maximum shear stress. Finally it is calculated the direction where the plastic deformation will take place. Then another model is built with a new crack length (the plastic zone length, relations (7)-(12)) and the direction of the angle “theta”. This occurs several times for a number of twelve models (Figure 7). The interaction between the Mode I and Mode II situation dictates the way which the crack propagates for a value of. That means that we proceed either along the principal plane or the maximum shear stress plane. The magnitude of the angle “theta” for the determination of the principal plane according to solid mechanics, is given by:7,8

Figure 6 Remotely applied stresses for mode II (a) and mode I (b).

Figure 7 The finite element model.

tan2 θ p = 2 τ xy σ x σ y MathType@MTEF@5@5@+= feaagKart1ev2aaatCvAUfeBSjuyZL2yd9gzLbvyNv2CaerbuLwBLn hiov2DGi1BTfMBaeXatLxBI9gBaerbd9wDYLwzYbItLDharqqtubsr 4rNCHbGeaGqiVu0Je9sqqrpepC0xbbL8F4rqqrFfpeea0xe9Lq=Jc9 vqaqpepm0xbba9pwe9Q8fs0=yqaqpepae9pg0FirpepeKkFr0xfr=x fr=xb9adbaqaaeGaciGaaiaabeqaamaabaabaaGcbaqcfayaaiaabs hacaqGHbGaaeOBaiaabkdaiiGacqWF4oqClmaaBaaajuaGbaqcLbma caWGWbaajuaGbeaacaWG9aWaaSaaaeaacaqGYaGae8hXdq3cdaWgaa qcfayaaKqzadGaamiEaiaadMhaaKqbagqaaaqaaiab=n8aZnaaBaaa baqcLbmacaWG4baajuaGbeaacqGHsislcqWFdpWCdaWgaaqaaKqzad GaamyEaaqcfayabaaaaaaaaa@5104@    (8)

We add to the value of derived from (8) “forty five degrees” if the Mode II dominates. Then for this value of “theta”, is estimated from relations (7)-(12) (Figure 8).
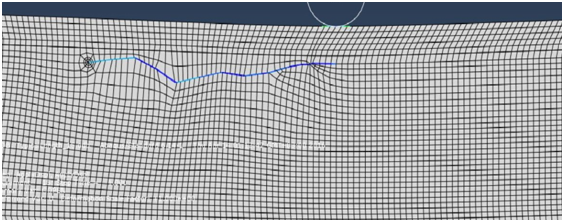
Figure 8 The crack propagation after twelve runs.

Numerical results

The stress intensity factors Ki and Kii for opening and sliding modes respectively can be computed directly from the nodal displacements on opposite sides of the crack lips by:10

K I K II }=G 2π r 0 { u y ( r 0 ,θ=π) u y ( r 0 ,θ=π) (k+1) u x ( r 0 ,θ=π) u x ( r 0 ,θ=π) (k+1) MathType@MTEF@5@5@+= feaagKart1ev2aaatCvAUfeBSjuyZL2yd9gzLbvyNv2CaerbuLwBLn hiov2DGi1BTfMBaeXatLxBI9gBaerbd9wDYLwzYbItLDharqqtubsr 4rNCHbGeaGqiVu0Je9sqqrpepC0xbbL8F4rqqrFfpeea0xe9Lq=Jc9 vqaqpepm0xbba9pwe9Q8fs0=yqaqpepae9pg0FirpepeKkFr0xfr=x fr=xb9adbaqaaeGaciGaaiaabeqaamaabaabaaGcbiqaaq1ajuaGda GacaqaaKqzGeqbaeqabiqaaaqcfayaaKqzGeGaam4saKqbaoaaBaaa baqcLbmacaWGjbaajuaGbeaaaeaajugibiaadUeajuaGdaWgaaqaaK qzadGaamysaiaadMeaaKqbagqaaaaaaiaaw2haaKqzGeGaeyypa0Ja am4raKqbaoaakaaabaWaaSaaaeaajugibiaaikdaiiGacqWFapaCaK qbagaajugibiaadkhalmaaBaaajuaGbaqcLbmacaaIWaaajuaGbeaa aaaabeaadaGabaqaaKqzGeqbaeqabiqaaaqcfayaamaalaaabaqcLb sacaWG1bWcdaWgaaqcfayaaKqzadGaamyEaaqcfayabaqcLbsacaGG OaGaamOCaKqbaoaaBaaabaqcLbmacaaIWaaajuaGbeaajugibiaacY cacqWF4oqCcqGH9aqpcqWFapaCcaGGPaGaeyOeI0IaamyDaKqbaoaa BaaabaqcLbsacaWG5baajuaGbeaajugibiaacIcacaWGYbqcfa4aaS baaeaajugWaiaaicdaaKqbagqaaKqzGeGaaiilaiab=H7aXjabg2da 9iabgkHiTiab=b8aWjaacMcaaKqbagaajugibiaacIcacaWGRbGaey 4kaSIaaGymaiaacMcaaaaajuaGbaWaaSaaaeaajugibiaadwhalmaa BaaajuaGbaqcLbmacaWG4baajuaGbeaajugibiaacIcacaWGYbqcfa 4aaSbaaeaajugWaiaaicdaaKqbagqaaKqzGeGaaiilaiab=H7aXjab g2da9iab=b8aWjaacMcacqGHsislcaWG1bqcfa4aaSbaaeaajugibi aadIhaaKqbagqaaKqzGeGaaiikaiaadkhajuaGdaWgaaqaaKqzadGa aGimaaqcfayabaqcLbsacaGGSaGae8hUdeNaeyypa0JaeyOeI0Iae8 hWdaNaaiykaaqcfayaaKqzGeGaaiikaiaadUgacqGHRaWkcaaIXaGa aiykaaaaaaaajuaGcaGL7baaaaa@A007@    (9)

where k=3-ν/(1+ν) ,k=3-4ν for plane stress and plane strain respectively and G is the shear modulus

The values of KI and KII versus the crack length are shown in Figure 9 under plane stain conditions. It is observed that as the crack length increases the values of become greater comparing from those of. The variation of the principal planes direction and the maximum shear stress planes direction are shown in Figure 10. It is observed that as crack length increases the “-maximum shear stress” increases. Finally the variation of the radius of the plastic zone for principal stress plane or maximum shear plane, are shown in Figure 11 for different crack lengths. It is observed that as the crack length increases the -maximum shear stress dominates. From Figure 9 & Figure 10 & Figure 11 it is observed a peak value at a crack length about 15mm.This is due to the fact either that KII mode begins to dominate on KI or it may be a numerical fault due to the tolerances of the solver regarding the interpenetration allowance among the contact elements.
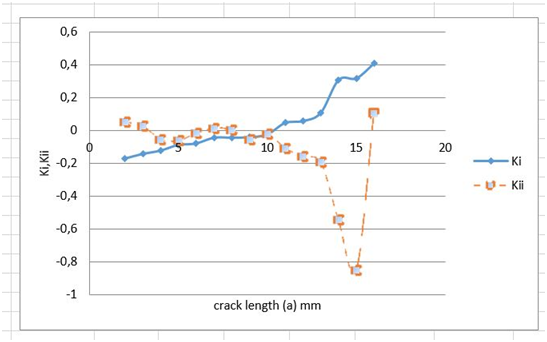
Figure 9 The Stress Intensity Factors versus the crack length.

Figure 8 The angle of principal stress planes and the maximum shear stress planes versus the crack length.

Figure 11 The variation of the plastic zone magnitude.

Conclusion

In this paper the crack propagation of a crack inside the core material of a sandwich beam very close to the upper skin was investigated under small scale yielding conditions. In order to predict the crack propagation in plane stress or plane strain conditions a quasi static loading was considered. At first the K I , K II MathType@MTEF@5@5@+= feaagKart1ev2aaatuuDJXwAK1uy0Hwmaerbfv3ySLgzG0uy0Hgip5 wzamXvP5wqSXMqHnxAJn0BKvguHDwzZbqegqvATv2CG4uz3bIuV1wy UbqedmvETj2BSbqee0evGueE0jxyaibaieYlf9irVeeu0dXdh9vqqj =hEeeu0xXdbba9frFj0=OqFfea0dXdd9vqaq=JfrVkFHe9pgea0dXd ar=Jb9hs0dXdbPYxe9vr0=vr0=vqpWqabiaaciWacmGadaGabiaaba GaaqaaaOqaceaaunqcfaOaam4samaaBaaabaqcLbmacaWGjbaajuaG beaacaGGSaGaaGjbVlaadUeadaWgaaqaaKqzadGaamysaiaadMeaaK qbagqaaaaa@462C@ stress intensity factors were calculated via the Finite Element Method using the linear fracture mechanics approach. Due to the high nonlinear problem since the stress field under consideration lays at the compression zone of the specimen, a self-contact analysis was taken in order to succeed the solution of the problem. From the finite element analyses the principal planes and the planes of maximum shear stress were also calculated for every crack length and consequently the direction where the plastic deformation would appear. In the sequel, The Mises and Tresca yield criteria, were used in order to calculate the plastic zone length. Having determined the direction another crack length was considered in order to proceed with the crack propagation inside the core. The crack-tip plastic zones derived from Mises and Tresca yield criteria were about the same. The plastic zones predicted in plane stress conditions were greater than those in plane strain conditions.

Acknowledgements

None.

Conflict of interest

Author declares that there is no conflicts of interest.

References

Creative Commons Attribution License

©2019 Tourlomousiss, et al. This is an open access article distributed under the terms of the, which permits unrestricted use, distribution, and build upon your work non-commercially.