MOJ
eISSN: 2374-6920


Short Communication Volume 1 Issue 1
Department of Pathology, Johns Hopkins University School of Medicine, USA
Correspondence: Paul Aiyetan, Department of Pathology, Johns Hopkins University School of Medicine, 1550 Orleans Street, CRBII, Room 3M 01 - 07, Baltimore, MD 21231, USA, Tel +4432874306, Fax +4432876388
Received: May 08, 2014 | Published: June 2, 2014
Citation: Aiyetan P, Zhang B, Zhang Z, et al. XGlycScan: an open-source software for n-linked glycosite assignment, quantification and quality assessment of data from mass spectrometry-based glycoproteomic analysis. MOJ Proteomics Bioinform. 2014;1(1):11-16. DOI: 10.15406/mojpb.2014.01.00004
Mass spectrometry based glycoproteomics has become a major means of identifying and characterizing previously N-linked glycan attached loci (glycosites). In the bottom-up approach, several factors which include but not limited to sample preparation, mass spectrometry analyses, and protein sequence database searches result in previously N-linked peptide spectrum matches (PSMs) of varying lengths. Given that multiple PSMs map to a glycosite, we reason that identified PSMs are varying length peptide species of a unique set of glycosites. Because associated spectra of these PSMs are typically summed separately, true glycosite associated spectra counts are lost or complicated. Also, these varying length peptide species complicate protein inference as smaller sized peptide sequences are more likely to map to more proteins than larger sized peptides or actual glycosite sequences. Here, we present XGlycScan. XGlycScan maps varying length peptide species to glycosites to facilitate an accurate quantification of glycosite associated spectra counts. We observed that this reduced the variability in reported identifications of mass spectrometry technical replicates of our sample dataset. We also observed that mapping identified peptides to glycosites provided an assessment of search-engine identification. Inherently, XGlycScan reported glycosites reduce the complexity in protein inference. We implemented XGlycScan in the platform independent Java programming language and have made it available as open source. XGlycScan's source code is freely available at https://bitbucket.org/paiyetan/xglycscan/src and its compiled binaries and documentation can be freely downloaded at https://bitbucket.org/paiyetan/xglycscan/downloads. The graphical user interface version can also be found at https://bitbucket.org/paiyetan/xglycscangui/src and https://bitbucket.org/paiyetan/xglycscangui/downloads respectively.
Keywords: bioinformatics, peptide, glycopeptides, glycosite, protein identification, proteomics, quality assessment
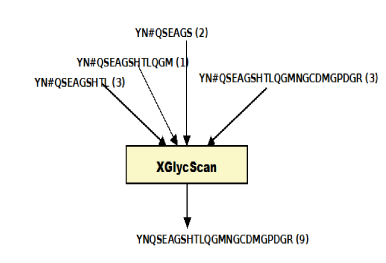
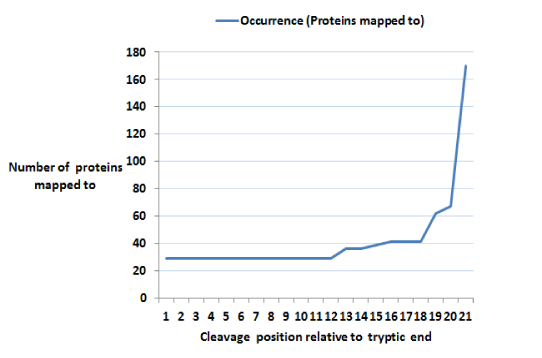
Glycoproteins play major roles in many biological systems.1–4 They are synthesized as products of co-translational and posttranslational modification processes known as glycosylation.5 Of the major glycosylation processes observed in humans, the N-linked type is the most predominant.5 N-linked glycosylation is the transfer of oligosaccharides onto an Asparagine (N) residue in an N-x-(ST) sequence motif of nascent polypeptides.6 Characterizing the sequences of these polypeptides (or peptides), glycopeptides and glycoproteins in complex biological mixtures has evolved to primarily entail shotgun approaches.7–13 This involves, but not limited to, sample preparation, mass spectrometry, protein database search, and protein inference.14 The shotgun approach is of the premise that the presence of a protein in a complex biological mixture can be inferred from mass spectrometry identified peptide sequences. The effects of these processes in addition to physicochemical properties of peptides and proteins on reported identifications are well noted and documented. As a significant consequence, Peptide Spectrum Matches (PSMs) of varying length about specific glycosites are typically reported as identified. Given the fact that varying length PSM species map to a glycosite, we reason that identified PSMs are peptide species of a unique set of glycosites. With multiple peptides of varying length mapping to a glycosite is the fact that the actual spectra count of such a glycosite is distributed across these peptide species (Figure 1B). This complicates true quantification of referenced glycosite. Also, with varying length peptide species of a glycosite is the attending increase in the number of possibly mapped proteins. This as well complicates protein inference (Figure 1C).15,16
XGlycScan focuses on the identified peptide sequences of attached glycans as opposed to other yet inadequate tools for automated glycopeptide analysis.17 Many of these predominantly focus on the structural composition of attached glycans.17–27 Although some others tend to characterize the peptide sequence with attach glycans together,28–44 very few to none of these tools describe glycopeptide sequences (which typically are peptide species of varying lengths) within the context of ‘peptide species of a set of unique glycosites'.
XGlycScan Implementation
We first introduced a concept of XGlycScan in Unipep45 as non-redundant N-linked glycopeptide generation. Here, we present XGlycScan as a platform independent, open-source, and freely available (recommended attributes of an ideal automated glycopeptide analysis tool17) analytical tool to resolve the glycosites to which mass spectrometry identified PSMs map and to accurately quantify the abundance of such.
Algorithmically, for every input mzIdentML46 peptide identification report file,
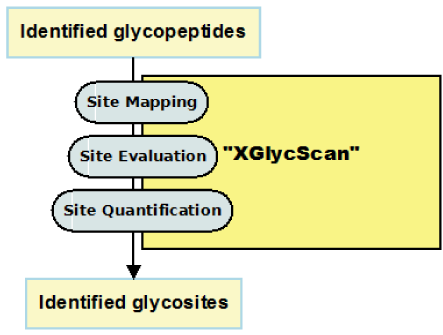
We have used SEQUEST XCorr in this implementation of XGlycScan as a place-holder for one of the many possible scoring metric options we plan to incorporate with subsequent software iteration. In anticipation of foreseen situations where input mzIdentML files are generated from different search engines, we did implement the Elias and Gygi's FDR computation to provide a uniform method for FDR estimation across input files. However, to allow for some flexibility, users are presented with an option of specifying whether to compute FDR or not on input PSM identifications. We shall possibly consider presenting the option of using the specific search-engine derived FDR or not in subsequent software iteration. XGlycScan's computation results are reported in the xGlycScan.tables sub-directory in a user specified output location. These include:
spectraCount.matrix: In this tab-delimited file is reported the re-computed and actual spectra count for mapped glycosites in each input file. The rows in this spectra count table represent unique glycosites identified and the columns represent individual input file.
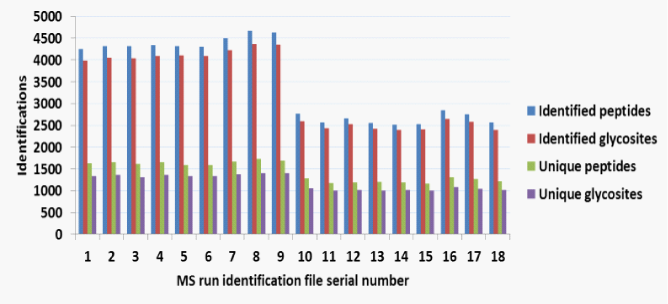
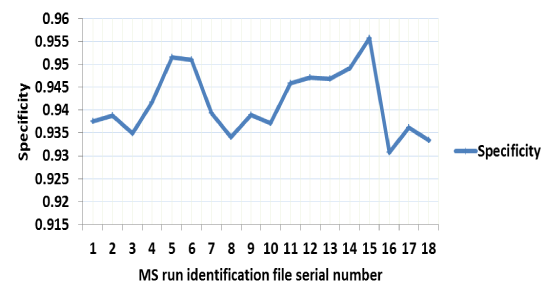
identification.indeces: Within this tab-delimited file is reported the total (Identified peptides) and unique (Unique peptides) number of peptide spectrum matches; total (Identified glycosites) and unique (Unique glycosites) glycosites for each input file. The specificity of identification in each input file is also reported in this file. By mapping back to reference glycosites, XGlycScan performs a quality assurance function as unsuccessfully mapped PSMs reported by database search-engine should raise the suspicion of spurious peptide to spectrum assignments or questionable antecedent processes. XGlycScan defines its search engine identified PSM quality metric (specificity) as a function of the ratio of mapped glycosites to total PSMs reported (Figure 2C) from database searches.
identification.coef: Within this tab-delimited file is reported the number of glycosites unique to each input file and the ratio of this to the total unique glycosites identified in all input files.
iDOverlapCount.matrix: In this tab-delimited square matrix file is reported the number of glycosites found in common in absolute number for all possible pair-wise comparison of input files.
iDOverlapPercent.matrix: Similar to the iDOverlapCount.matrix, in this tab-delimited square matrix file is reported all possible pair-wise comparison of input files. Herein is reported the number of glycosites found in common as a percentage of unique glycosites' union between the paired inputs.
Other computation results are reported in the following sub-subdirectories:
We implemented XGlycScan entirely in the Java programming language to ensure a wide range of operating system platform compatibility. Also to ensure compatibility with a wide range of search engine outputs, XGlycScan, by default, receives the proteomics community (PSI, Proteomics Standard Initiative) defined mzIdentML data format46,49 files as input Table 1. XGlycScan utilizes the jmzIdentML Java API50 in reading and accessing defined objects in input file (s). Result outputs are written to a tables' directory in user-specified output location. See documentation in the README file or at https://bitbucket.org/paiyetan/xglycscan/wiki/Home for details
S. no |
File name |
Sample group |
Sample |
Instrument |
1 |
061413_TCGA_G11_1.mzid |
QEXACT_G11 |
G11 |
QExactiveTM |
2 |
061413_TCGA_G11_2.mzid |
QEXACT_G11 |
G11 |
QExactiveTM |
3 |
061413_TCGA_G11_3.mzid |
QEXACT_G11 |
G11 |
QExactiveTM |
4 |
061413_TCGA_G14_1.mzid |
QEXACT_G14 |
G14 |
QExactiveTM |
5 |
061413_TCGA_G14_2.mzid |
QEXACT_G14 |
G14 |
QExactiveTM |
6 |
061413_TCGA_G14_3.mzid |
QEXACT_G14 |
G14 |
QExactiveTM |
7 |
061413_TCGA_G5_1.mzid |
QEXACT_G05 |
G05 |
QExactiveTM |
8 |
061413_TCGA_G5_2.mzid |
QEXACT_G05 |
G05 |
QExactiveTM |
9 |
061413_TCGA_G5_3.mzid |
QEXACT_G05 |
G05 |
QExactiveTM |
10 |
TCGA_114C_24-1436-01A-01_13-2061-01A-02_36-2537-01A-01_G_ JHUZ_20130228_RUN1_NOFRACTION_130408174702.mzid |
ORBIT_G11 |
G11 |
Orbitrap VelosTM |
11 |
TCGA_114C_24-1436-01A-01_13-2061-01A-02_36-2537-01A-01_G_ JHUZ_20130228_RUN2_NOFRACTION_130408192810.mzid |
ORBIT_G11 |
G11 |
Orbitrap VelosTM |
12 |
TCGA_114C_24-1436-01A-01_13-2061-01A-02_36-2537-01A-01_G_ JHUZ_20130228_RUN3_NOFRACTION_130408210853.mzid |
ORBIT_G11 |
G11 |
Orbitrap VelosTM |
13 |
TCGA_114C_29-1696-01A-01_29-1771-01A-01_13-2066-01A-02_G_ JHUZ_20130228_RUN1_NOFRACTION.mzid |
ORBIT_G14 |
G14 |
Orbitrap VelosTM |
14 |
TCGA_114C_29-1696-01A-01_29-1771-01A-01_13-2066-01A-02_G_ JHUZ_20130228_RUN2_NOFRACTION.mzid |
ORBIT_G14 |
G14 |
Orbitrap VelosTM |
15 |
TCGA_114C_29-1696-01A-01_29-1771-01A-01_13-2066-01A-02_G_ JHUZ_20130228_RUN3_NOFRACTION.mzid |
ORBIT_G14 |
G14 |
Orbitrap VelosTM |
16 |
TCGA_114C_OVARIAN-CONTROL_25-2396-01A-01_36-2545-01A-01_G_ JHUZ_20130228_RUN1_NOFRACTION_130408112404.mzid |
ORBIT_G05 |
G05 |
Orbitrap VelosTM |
17 |
TCGA_114C_OVARIAN-CONTROL_25-2396-01A-01_36-2545-01A-01_G_ JHUZ_20130228_RUN2_NOFRACTION_130408130450.mzid |
ORBIT_G05 |
G05 |
Orbitrap VelosTM |
18 |
TCGA_114C_OVARIAN-CONTROL_25-2396-01A-01_36-2545-01A-01_G_ JHUZ_20130228_RUN3_NOFRACTION_130408144538.mzid |
ORBIT_G05 |
G05 |
Orbitrap VelosTM |
Table 1 Samples group information
XGlycScan's current implementation define reference glycosites as peptide sequences about the canonical N-x-[ST] motif [6] bounded within the immediate up and downstream trypsin cleavage sites. Given that some recent studies are beginning to provide evidences for glycosites not containing the canonical motif,11 as part of future maintenance of XGlycScan and as evidences for such non-canonical motifs become stronger, we plan to integrate such information in defining reference glycosites.
Demonstrating functionality
To demonstrate XGlycScan's functionalities, we searched sample tandem mass spectrometry derived glycoproteome profile RAW files from two Thermo Scientific mass spectrometry instruments in Proteome Discoverer version 1.3. The mass spectrometers were Orbitrap Velos™ and Q Exactive™. The MSMS data were generated as part of the National Cancer Institute's (NCI), Clinical Proteomics Tumor Analysis Consortium (CPTAC), proteome characterization study. A full description of sample preparation and mass spectrometry protocols is publicly available and may be downloaded at the CPTAC data portal (https://cptac-data-portal.georgetown.edu/cptacPublic/) Also available for download are the sampled. RAW files from the Orbitrap Velos™ instrument. The Q Exactive™ instrument derived. RAW files are available on request.
We searched using Proteome Discoverer embedded SEQUEST48 search engine. We searched against the NCBI RefSeq protein database (September 16, 2013 version). We specified the following search parameters – a full tryptic digestion and a maximum missed cleavage of 1, a precursor mass tolerance of 10ppm and a fragment mass tolerance of 0.06Da (Daltons), and ions series weight on b and y ions. We specified deamidation (+0.984016Da) of Asparagine (N) as dynamic modification and oxidation (+15.994915Da) of Methionine (M), modifications of peptide N-terminus with iTRAQ 4plex (+144.102Da) of any residue, iTRAQ 4plex modification (+144.102Da) of Lysine (K) and carbamidomethylation (+57.021Da) of Cysteine (C) as a static modifications. We allowed a maximum of 6 modifications per peptide. We converted our search result MSF files to the proteomics community defined mzIdentML standard format files using M2Lite51 Respective files and associated sample group information are listed in.
As input parameters in XGlycScan's configuration file, we specified our input file type as “MZIDENTML”, quantification type as “SPECTRA_COUNT”, protein sequence search database type as “REFSEQ”, compute false discovery rate (FDR) as “TRUE”, FDR filter or cutoff as “0.01”, evaluation value type as “SEQUESTXCORR”, and use top ranked as “FALSE”. Please see documentation at https://bitbucket.org/paiyetan/xglycscan/wiki/Home for more details.
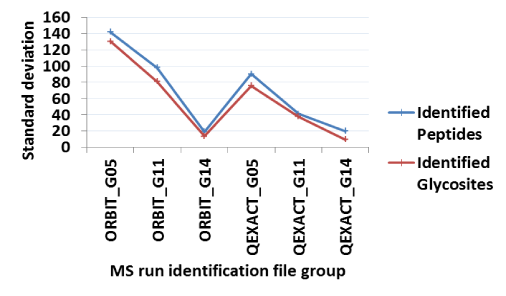
(Figure 2A) summarizes the glycosite identifications reported by XGlycScan. Interestingly, XGlycScan evaluation appears to reduce the variability in the number of PSMs identified across mass-spectrometry technical replicates (Figure 2B). We observed specificities between 93 and 96 percent across all input identification files (Figure 2C). Significantly low specificity in identifications should raise a concern in possibly any of the preceding steps – sample preparation, mass spectrometry analysis or database peptide assignment.
Ultimately, by reducing redundancy in N-linked glycan attached loci, XGlycScan is expected to reduce the complexity in protein identification as fewer and more precise glycopeptide sequences should map to fewer proteins as illustrated in (Figure 1B).
(Figure 3A) shows a typical XGlycScan command-line session. (Figure 3B) shows a graphical user interface program initiation session.
Software availability
XGlycScan's source codes are available as open-source at https://bitbucket.org/paiyetan/xglycscan/src and its compiled binaries and documentation can be freely downloaded at
https://bitbucket.org/paiyetan/xglycscan/downloads. The user-friendly graphical user interface version can be found at https://bitbucket.org/paiyetan/xglycscangui/src and https://bitbucket.org/paiyetan/xglycscangui/downloads
respectively. These are made available under the BSD 3-Clause open source license.
XGlycScan's development was supported by the National Institutes of Health, National Cancer Institute, Clinical Proteomic Tumor Analysis Consortium (CPTAC, U24CA160036) and the Early Detection Research Network (EDRN, U01CA152813), National Heart, Lung, and Blood Institute, Programs of Excellence in Glycosciences (PEG, P01HL107153). We do acknowledge members of the Center for Biomarker Discovery and Translation, Department of Pathology, Clinical Chemistry Division at the Johns Hopkins University School of Medicine.
The author declares no conflict of interest.

©2014 Aiyetan, et al. This is an open access article distributed under the terms of the, which permits unrestricted use, distribution, and build upon your work non-commercially.