Submit manuscript...
MOJ
eISSN: 2374-6920

Proteomics & Bioinformatics

Review Article Volume 4 Issue 1

Factors affecting bacterial propagation towards tumor microenvironments

Anand S,1 Sujatha P Koduvayur,2 R Chandramouli2

1Department of Electrical Engineering, New York Institute of Technology, USA
2Department of Electrical and Computer Engineering, Stevens Institute of Technology, USA

Correspondence: Sujatha P Koduvayur, Department of Electrical and Computer Engineering, Stevens Institute of Technology, NJ 07030, USA

Received: September 09, 2016 | Published: September 29, 2016

Citation: Anand S, Koduvayur SP, Chandramouli R. Factors affecting bacterial propagation towards tumor microenvironments. MOJ Proteomics Bioinform. 2016;4(1):179-185. DOI: 10.15406/mojpb.2016.04.00112

Download PDF

Abstrat

This paper provides a detailed analysis to identify factors that improve bacterial targeting times to tumor microenvironments. We utilize the “active flagellar” motion characteristic of the bacterial movement to present a continuous time Markov model and a first passage time analysis to determine the factors that affect the mean time taken for injected bacteria to reach a tumor micro environment. We have determined 3 major factors that play a role in determining mean targeting times: (i) the population of the injected bacteria, (ii) the distance between the region of injection and the tumor microenvironment and (iii) the directional efficiency of the injected bacteria. Of these 3 factors our results show that the directional efficiency is the most significant factor that affects the time taken by different bacterial species to reach the tumor micro environment. While distance between the tumor micro environment and the region of injection also plays an important role, population of bacteria is most ineffective, especially for large directional efficiency. Our model matches well with some existing experimental results.

Keywords: targeting time, tumor microenvironment engineered bacteria, markov model, first passage time

Abbreviations

DDS, drug delivery systems; EPR, enhanced permeability and retention; CTMC, continuous time markov chain

Introduction

Drug delivery systems (DDS) directly affect the effectiveness of a drug's pharmacokinetics, absorption, metabolism, duration of effect and toxicity.1 DDS can be broadly classified into passive and active targeting. Passive targeting is solely dependent on Enhanced Permeability and Retention (EPR) effect2,3 Active targeting on the other hand can be of two types; (i) homing to disease sites by loading targeting agents with ligands or antibodies that bind specifically to biomarkers uniquely expressed/secreted in diseased regions4 or (ii) self-propelling drug carriers.5 EPR is a direct effect of poor and leaky vasculature that is normally seen in disease sites (e.g., tumor microenvironments) and is only effective for upto 10% retention of therapeutics at these sites.6 While antibody and ligand directed nanoparticles show high levels of specific uptake by diseased cells, their targeting rates were still found to be low, as their accumulation in target sites (< 10%) is still dependent on the EPR effect.7,8 Recently, molecular communication based models were developed to optimize antibody based drug delivery systems.9,10 The current state of the art investigates various remote-controlled delivery strategies to overcome poor lo­calization of drug carriers to disease sites. Ultrasonic waves and light directed targeting of nanoparticles to disease sites have been recently investigated and show great promise for remote-controlled DDS.11-15 Despite these promising advances, self-propelling/autonomous swimmers remain the most encouraging active DDS platforms.

Bacteria, the classic example of self-propelling/autonomous swimmers, move towards or away from external/environmental signals by a process called cheomotaxis.16,17 Anaerobic bacteria (bacteria that grow in low/no oxygen sites e.g. tumors) have been used as anti-cancer agents since Coley's experiments in 1890s.18 Since then great strides have been taken to improve and adapt bacterial DDS to a great many diseases. Currently more than 50 patents have been issued to use different strains of bacteria as anti-cancer agents.19 Bacteria are idea active targeting DDS as they can actively penetrate tissues, home in to disease sites in response to disease-specific biomarkers extruded into the extra-cellular space, and controllably induce cytotoxicity.20 More significantly, bacteria can grow selectively in disease tissue thereby compensating for poor targeting.21 Bacteria have been used to deliver anti-cancer drugs or nanoparticles and to deliver genes intracellular.22,23 Successful tumor regression studies in mice24 and other laboratory animals have led to recent FDA approved clinical trials of bacterial targeted anti­cancer treatments.25-27 These trials showed that patients tolerated upto 108 c.f.u/m2 of bacteria in the system without any adverse effects by either intravenous injection or intra-tumoral injection respectively. Nemunaitis27 further showed that these bacteria were able to specifically target an enzyme that could catalyze the conversion of a well known anti-cancer pro-drug to its active, killing state. However, these trials showed very poor colonization of the tumors in situ with the best-case scenario being one colony per tumor. Thus, recent research has focused on improving bacterial targeting strategies to tumor sites. Thornlow et al.28 show that increasing the motility of anerobic bacteria, Salmonella and generating homogeneous population of highly motile Salmonella, enhanced tumor penetration in vitro.

The chemo taxis capability and their effectiveness in DDS motivated the study of diffusion models for bacteria. A continuous diffusion model was developed29 to characterize the diffusion of bacterial colonies. Recent research has focused on improving bacterial targeting strategies to tumor sites. Thornlow et al.28 show that increasing the motility of anerobic bacteria, Salmonella and generating homogeneous population of highly motile Salmonella, enhanced tumor penetration in vitro. Okaie et al.30 developed a microsensor network equivalent of bacterial chemotaxis. They exploited the model in31 (later extended in32) where bacteria were modeled as microsensors and base stations were placed to monitor the different sensors.

The fact that tumor targeting bacteria not just diffuse but demonstrate sensing based motility towards the tumor33 (called "active flagellar" motion) gives rise to the need to develop stochastic models for bacterial propagation towards tumors. Some key researches on stochastic modeling of bacteria for chemotherapy are very recent34,35 and.36 Charteris & Khain34 developed a discrete stochastic lattice model to model the cells in the body as a combination of discrete lattices and the velocity of bacteria between successive lattices. The model was verified with experiments and it was shown that bacteria typically propagate only unidirectional to neighboring lattices. Lavrentovich & Nelson35 and Deng36 separately studied the time for survival of bacteria in any geographic region using diffusion model35 and by colonial communication model36,37 and showed that the time spent in any geographical region is exponentially distributed. Therefore, the propagation of engineered bacteria can be modeled as a stochastic random walk.36,37 However, the nature of these findings has not yet been exploited to analyze the time taken for bacteria to reach tumor microenvironments and determine the factors that impact this time. Wei et al37 presented simulations on first passage time to tumors. A diffusion equation was formulated that used spatial extensions to Gillespei's algorithm.38

Motivated by the findings in,34-36 we divide the region of propagation of the bacteria1 into a 3-dimensional lattice and develop a three-dimensional Markov Chain model to characterize the random walk behavior of the bacteria between the grids in the lattice. We use first passage time analysis of Markov processes2 to provide closed form expressions for the mean time taken for the bacteria to reach a desired proximity to the tumor, from the region (i.e., grid) of injection. From the first passage time analysis of Markov processes, we derive the following key results:

1While the concept of Markov models and first pass time was introduced and discussed in,36 the first pass times discussed were very crude approximations that took only the speed of the bacteria into account.

2Henceforth, throughout the paper, whenever we refer to "'bacteria", we mean "injected engineered bacteria", unless explicitly mentioned otherwise.

• The main factors that affect the tumor targeting time (time taken for the bacteria to reach the tumor microenvironment from the point of injection) are (a) the population of the injected bacteria, (b) the distance between the tumor and the region of injection and (c) the directional efficiency, defined as the ratio of the rate at which bacteria move towards the tumor microenvironment to the rate at which they move away from the tumor microenvironment.

The directional efficiency is the most significant factor that impacts time taken to reach the tumor microenvironment. While the distance between the tumor microenvironment and the region of injec­tion also play a significant role, the population is the least effective parameter, particularly beyond a certain threshold value (called the saturation threshold of population). The results obtained from out model matches well with existing experimental results28 that measure the time taken by control bacteria to reach the tumor microenvironment. To the best of our knowledge, this is the first research that characterizes the first passage times of injected bacteria reaching the tumor microenvironment, to clearly bring out the dependencies on the population, directional efficiency of the bacteria and the distance between the region of injection and the tumor. Our analysis can be extended to these scenarios at the cost of additional computational complexity.

The rest of the paper is organized as follows. Section 5 defines the objective of this research and builds the Markov model. Numerical results are described in Section 6 and conclusions are drawn in Section 7.

Problem description

Consider a finite population of engineered bacteria injected into a medium (e.g., blood stream), bound for a tumor. Initially, at the point of injection, the bacteria are unaware of the exact location of the tumor thus they propagate according to a random walk model.34-37 Once the bacteria reach the tumor microenvironment, they then move towards the tumor, by active chemotaxis in response to chemical signal from the tumor17,29 and grow according to the model discussed in.33 The objective is to estimate the mean time taken by the bacteria to reach the tumor microenvironment from the point of injection. For this, we develop a Markov model that characterizes the random walk behavior from the point of injection to the tumor microenvironment. We first describe the basic system model and the assumptions we make, in Section 5.1 and the Markov model in Section 5.2.

System model

We divide the medium into set of rectangular lattices in three-dimension based on the lattice model in.34 For simplicity, a two dimensional equivalent is shown in Figure 1. The lattice division shown in Figure 1 is only notional and does not depict a real-life representation of the medium. The grids shown in Figure 1 only represent a region where a bacterium might be present at any instant of time3 Later, from . We make the following model description to facilitate the problem definition and the related analysis.

3Later, from Theorem 2.1, it will be observed that the dimensions of the gird and the number if such grids do not affect the time taken to reach the tumour microenvironment.

Figure 1 A grid representation of the bacterial propagation region. For simplicity a two-dimensional picture is shown. In our model we use 3-dimensional lattice.

Bacteria can move only to one of four neighbouring cells (either in the vertical or horizontal direction but not diagonally.34 The region, (0; 0), represents the point at which the bacteria is injected and (m;m) represents the tumor microenvironment.

  • The bacteria is injected in a region labeled by the gird (0, 0, 0) in three dimensions (the gird, (0, 0) in the two-dimensional representation shown in Figure 1). Irrespective of where the bacteria are physically injected into the body, we consider the region of injection to be represented by the gird, (0, 0, 0).
  • The negative indices for the grids represent regions that are opposite in direction from the region of injection with respect to the tumor microenvironment. In general, the negative indices can go up to -of, but for purposes of computation and tractability, we limit them to -m. It is noted that since the negative indices represent propagation away from the desired target region, the values of negative indices are not relevant for our analysis, as will be observed later from (8).
  • The grid, (m, m, m) (or the grid, (m, m) in the two dimensional representation shown in Fig. 1) depicts the tumor microenvironment. This does not represent the actual tumor. It only represents the outer bounds of the of the region surrounding the tumor beyond which chemical signals from the tumor do not reach. Within the bounds of the tumor microenvironment (past grid (m, m, m) or (m, m) in Figure 1) the bacteria propagate to the tumor by chemotaxis.17,29
  • Note that although we have shown the regions to be of uniform size, they are not so in practice. However, the variations in the sizes of the individual regions can be easily incorporated by suitably changing the number of regions, m.
  • Until the bacteria reach the grid (m, m, m) (or (m, m) in the two-dimensional representation shown in Figure 1), they follow a random walk behavior.34-36
  • The objective is to develop a stochastic model that can be applied to determine the mean time taken to reach the tumor microenvironment from the region of injection, i.e., the time taken to reach grid (m, m, m) starting from grid, (0, 0, 0). This model should provide: the parameters that affect the mean time taken to reach (m, m, m) starting from (0, 0, 0) and - the factors that are more dominant, i.e., that have more significant effect on the mean time, compared to other factors.

Markov model

Until, the bacteria injected in region depicted by the grid (0, 0, 0) reach the tumor microenvironment, i.e., until the bacteria reach the region, (m, m, m), they move according to a random walk process36,37 by spending a random time in each of the regions shown in Figure 1. The random time is exponentially distributed.35 Therefore, we model the random walk behavior of the bacteria from the region of injection (0, 0, 0) until it reaches (m, m, m) as a three-dimensional continuous time Markov chain (3D-CTMC). In general, a bacteria in grid (n,k, l) (m,n,k,lm) MathType@MTEF@5@5@+= feaagKart1ev2aaatCvAUfeBSjuyZL2yd9gzLbvyNv2CaerbuLwBLn hiov2DGi1BTfMBaeXatLxBI9gBaerbd9wDYLwzYbItLDharqqtubsr 4rNCHbGeaGqiVu0Je9sqqrpepC0xbbL8F4rqqrFfpeea0xe9Lq=Jc9 vqaqpepm0xbba9pwe9Q8fs0=yqaqpepae9pg0FirpepeKkFr0xfr=x fr=xb9adbaqaaeGaciGaaiaabeqaamaabaabaaGcbaqcfaOaaiikai abgkHiTiaad2gacaGGSaGaeyizImQaaiOBaiaacYcacaGGRbGaaiil aiaacYgacqGHKjYOcaGGTbGaaiykaaaa@42F8@ , can move to a grid (n,k, l), where

max(m,n1) n ˜ min(m,n+1) MathType@MTEF@5@5@+= feaagKart1ev2aaatCvAUfeBSjuyZL2yd9gzLbvyNv2CaerbuLwBLn hiov2DGi1BTfMBaeXatLxBI9gBaerbd9wDYLwzYbItLDharqqtubsr 4rNCHbGeaGqiVu0Je9sqqrpepC0xbbL8F4rqqrFfpeea0xe9Lq=Jc9 vqaqpepm0xbba9pwe9Q8fs0=yqaqpepae9pg0FirpepeKkFr0xfr=x fr=xb9adbaqaaeGaciGaaiaabeqaamaabaabaaGcbaqcLbsaciGGTb GaaiyyaiaacIhacaGGOaGaeyOeI0IaamyBaiaacYcacaWGUbGaeyOe I0IaaGymaiaacMcacqGHKjYOjuaGdaaiaaqaaKqzGeGaamOBaaqcfa Oaay5adaqcLbsacqGHKjYOciGGTbGaaiyAaiaac6gacaGGOaGaaiyB aiaacYcacaGGUbGaey4kaSIaaGymaiaacMcaaaa@4F90@

max(m,k1) k ˜ min(m,k+1) MathType@MTEF@5@5@+= feaagKart1ev2aaatCvAUfeBSjuyZL2yd9gzLbvyNv2CaerbuLwBLn hiov2DGi1BTfMBaeXatLxBI9gBaerbd9wDYLwzYbItLDharqqtubsr 4rNCHbGeaGqiVu0Je9sqqrpepC0xbbL8F4rqqrFfpeea0xe9Lq=Jc9 vqaqpepm0xbba9pwe9Q8fs0=yqaqpepae9pg0FirpepeKkFr0xfr=x fr=xb9adbaqaaeGaciGaaiaabeqaamaabaabaaGcbaqcfaOaciyBai aacggacaGG4bGaaiikaiabgkHiTiaad2gacaGGSaGaai4AaiabgkHi TiaaigdacaGGPaGaeyizIm6aaacaaeaacaWGRbaacaGLdmaacqGHKj YOciGGTbGaaiyAaiaac6gacaGGOaGaaiyBaiaacYcacaGGRbGaey4k aSIaaGymaiaacMcaaaa@4D4B@

max(m,l1) l ˜ min(m,l+1) MathType@MTEF@5@5@+= feaagKart1ev2aaatCvAUfeBSjuyZL2yd9gzLbvyNv2CaerbuLwBLn hiov2DGi1BTfMBaeXatLxBI9gBaerbd9wDYLwzYbItLDharqqtubsr 4rNCHbGeaGqiVu0Je9sqqrpepC0xbbL8F4rqqrFfpeea0xe9Lq=Jc9 vqaqpepm0xbba9pwe9Q8fs0=yqaqpepae9pg0FirpepeKkFr0xfr=x fr=xb9adbaqaaeGaciGaaiaabeqaamaabaabaaGcbaqcfaOaciyBai aacggacaGG4bGaaiikaiabgkHiTiaad2gacaGGSaGaaiiBaiabgkHi TiaaigdacaGGPaGaeyizIm6aaacaaeaacaWGSbaacaGLdmaacqGHKj YOciGGTbGaaiyAaiaac6gacaGGOaGaaiyBaiaacYcacaGGSbGaey4k aSIaaGymaiaacMcaaaa@4D4E@

Based on the finding in,34 the velocity or motility in the diagonal directions (i.e., when i '   =     i±1 MathType@MTEF@5@5@+= feaagKart1ev2aaatCvAUfeBSjuyZL2yd9gzLbvyNv2CaerbuLwBLn hiov2DGi1BTfMBaeXatLxBI9gBaerbd9wDYLwzYbItLDharqqtubsr 4rNCHbGeaGqiVCI8FfYJH8YrFfeuY=Hhbbf9v8qqaqFr0xc9pk0xbb a9q8WqFfeaY=biLkVcLq=JHqpepeea0=as0Fb9pgeaYRXxe9vr0=vr 0=vqpWqaaeaabiGaciaacaqabeaadaqaaqaaaOqaaKqbakaadMgada ahaaqcfasabeaacaGGNaaaaKqbaoaaBaaabaaeaaaaaaaaa8qacaGG GcaapaqabaGaeyypa0ZaaSbaaeaapeGaaiiOaaWdaeqaamaaBaaaba Wdbiaacckaa8aabeaacaWGPbGaeyySaeRaaGPaVlaaigdaaaa@4354@  and j '   =     j±1 MathType@MTEF@5@5@+= feaagKart1ev2aaatCvAUfeBSjuyZL2yd9gzLbvyNv2CaerbuLwBLn hiov2DGi1BTfMBaeXatLxBI9gBaerbd9wDYLwzYbItLDharqqtubsr 4rNCHbGeaGqiVCI8FfYJH8YrFfeuY=Hhbbf9v8qqaqFr0xc9pk0xbb a9q8WqFfeaY=biLkVcLq=JHqpepeea0=as0Fb9pgeaYRXxe9vr0=vr 0=vqpWqaaeaabiGaciaacaqabeaadaqaaqaaaOqaaKqbakaadQgada ahaaqcfasabeaacaGGNaaaaKqbaoaaBaaabaaeaaaaaaaaa8qacaGG GcaapaqabaGaeyypa0ZaaSbaaeaapeGaaiiOaaWdaeqaamaaBaaaba Wdbiaacckaa8aabeaacaWGQbGaeyySaeRaaGPaVlaaigdaaaa@4356@ was zero. Hence, bacteria can only move to the regions to the left, right, up or down. In a three dimensional lattice, the six possible directions a bacteria can move to would be left, right, front, back, up and down. For simplicity, in Figure 2, we show the state diagram for a 2D-CTMC assuming that the region is split into an m x m grid in two-dimensions as shown in Figure 1. Let (n; k; l) represent any state of a CTMC, i.e., represents the region at which a bacteria is present. The transition rate, q nkl n ˜ k ˜ l ˜    MathType@MTEF@5@5@+= feaagKart1ev2aaatCvAUfeBSjuyZL2yd9gzLbvyNv2CaerbuLwBLn hiov2DGi1BTfMBaeXatLxBI9gBaerbd9wDYLwzYbItLDharqqtubsr 4rNCHbGeaGqiVCI8FfYJH8YrFfeuY=Hhbbf9v8qqaqFr0xc9pk0xbb a9q8WqFfeaY=biLkVcLq=JHqpepeea0=as0Fb9pgeaYRXxe9vr0=vr 0=vqpWqaaeaabiGaciaacaqabeaadaqaaqaaaOqaaKqbacbaaaaaaa aapeGaaiyCamaaBaaajuaibaGaamOBaiaadUgacaWGSbGabmOBayaa iaGabm4AayaaiaGabmiBayaaiaaabeaacaGGGcqcfaOaaiiOaaaa@4088@ represents that rate at which the CTMC transits from state, (n, k, l) to state, π n ˜ k ˜ l ˜ MathType@MTEF@5@5@+= feaagKart1ev2aaatCvAUfeBSjuyZL2yd9gzLbvyNv2CaerbuLwBLn hiov2DGi1BTfMBaeXatLxBI9gBaerbd9wDYLwzYbItLDharqqtubsr 4rNCHbGeaGqiVCI8FfYJH8YrFfeuY=Hhbbf9v8qqaqFr0xc9pk0xbb a9q8WqFfeaY=biLkVcLq=JHqpepeea0=as0Fb9pgeaYRXxe9vr0=vr 0=vqpWqaaeaabiGaciaacaqabeaadaqaaqaaaOqaaKqbakqad6gaga acaiqadUgagaacaiqadYgagaacaaaa@397A@  Then.

q nkl n ˜ k ˜ l ˜  ={ λ  n ˜ =n+1, k ˜ =k, l ˜ =1  m  n, k, l < m λ  n ˜ =n, k ˜ =k+1,  l ˜ =l m  n, k, l < m λ  n ˜ =n,  k ˜ =k,  l ˜ =l+1 m  n, k, l < m μ  n ˜ =n1,  k ˜ =k,  l ˜ =l m < n, k, l  m μ  n ˜ =n,  k ˜ =k1,   l ˜ =l m < n, k, l  m μ  n ˜ =n, k=k,  l ˜ =l1 m < n, k, l  m 0 MathType@MTEF@5@5@+= feaagKart1ev2aaatCvAUfeBSjuyZL2yd9gzLbvyNv2CaerbuLwBLn hiov2DGi1BTfMBaeXatLxBI9gBaerbd9wDYLwzYbItLDharqqtubsr 4rNCHbGeaGqiVCI8FfYJH8YrFfeuY=Hhbbf9v8qqaqFr0xc9pk0xbb a9q8WqFfeaY=biLkVcLq=JHqpepeea0=as0Fb9pgeaYRXxe9vr0=vr 0=vqpWqaaeaabiGaciaacaqabeaadaqaaqaaaOqaaKqbacbaaaaaaa aapeGaaiyCamaaBaaajuaibaGaamOBaiaadUgacaWGSbGabmOBayaa iaGabm4AayaaiaGabmiBayaaiaaajuaGbeaacaGGGcGaeyypa0Zaai qaaqaabeqaaiabeU7aSjaacckaceWGUbGbaGaacqGH9aqpcaWGUbGa ey4kaSIaaGymaiaacYcaceWGRbGbaGaacqGH9aqpcaWGRbGaaiilai qadYgagaacaiabg2da9iaaigdacaGGGcGaaiiOaiabgkHiTiaad2ga caGGGcGaeyizImQaaiiOaiaad6gacaGGSaGaaiiOaiaadUgacaGGSa GaaiiOaiaadYgacaGGGcGaeyipaWJaaiiOaiaad2gaaeaacqaH7oaB caGGGcGabmOBayaaiaGaeyypa0JaamOBaiaacYcaceWGRbGbaGaacq GH9aqpcaWGRbGaey4kaSIaaGymaiaacYcacaGGGcGabmiBayaaiaGa eyypa0JaamiBaiaacckacqGHsislcaWGTbGaaiiOaiabgsMiJkaacc kacaWGUbGaaiilaiaacckacaWGRbGaaiilaiaacckacaWGSbGaaiiO aiabgYda8iaacckacaWGTbaabaGaeq4UdWMaaiiOaiqad6gagaacai abg2da9iaad6gacaGGSaGaaiiOaiqadUgagaacaiabg2da9iaadUga caGGSaGaaiiOaiqadYgagaacaiabg2da9iaadYgacqGHRaWkcaaIXa GaaiiOaiabgkHiTiaad2gacaGGGcGaeyizImQaaiiOaiaad6gacaGG SaGaaiiOaiaadUgacaGGSaGaaiiOaiaadYgacaGGGcGaeyipaWJaai iOaiaad2gaaeaacqaH8oqBcaGGGcGabmOBayaaiaGaeyypa0JaamOB aiabgkHiTiaaigdacaGGSaGaaiiOaiqadUgagaacaiabg2da9iaadU gacaGGSaGaaiiOaiqadYgagaacaiabg2da9iaadYgacaGGGcGaeyOe I0IaamyBaiaacckacqGH8aapcaGGGcGaamOBaiaacYcacaGGGcGaam 4AaiaacYcacaGGGcGaamiBaiaacckacqGHKjYOcaGGGcGaamyBaaqa aiabeY7aTjaacckaceWGUbGbaGaacqGH9aqpcaWGUbGaaiilaiaacc kaceWGRbGbaGaacqGH9aqpcaWGRbGaeyOeI0IaaGymaiaacYcacaGG GcGaaiiOaiqadYgagaacaiabg2da9iaadYgacaGGGcGaeyOeI0Iaam yBaiaacckacqGH8aapcaGGGcGaamOBaiaacYcacaGGGcGaam4Aaiaa cYcacaGGGcGaamiBaiaacckacqGHKjYOcaGGGcGaamyBaaqaaiabeY 7aTjaacckaceWGUbGbaGaacqGH9aqpcaWGUbGaaiilaiaacckacaWG RbGaeyypa0Jaam4AaiaacYcacaGGGcGabmiBayaaiaGaeyypa0Jaam iBaiabgkHiTiaaigdacaGGGcGaeyOeI0IaamyBaiaacckacqGH8aap caGGGcGaamOBaiaacYcacaGGGcGaam4AaiaacYcacaGGGcGaamiBai aacckacqGHKjYOcaGGGcGaamyBaaqaaiaaicdaaaGaay5Eaaaaaa@117C@  (1)

otherwise

Figure 2 Two dimensional equivalent of the 3D CTMC model for random walk behavior of bacterial propagation.

The negative signs indicate grids away from the direction of the tumor, relative to the region of injection. .

This constitutes a three dimensional birth-death process. Since the movement of the bacteria follows a random walk, the direction of transition from any state to its neighboring state is independent of the direction of the previous transition. Therefore, the steady state probability of being in state (n,k,1), 7rnki, is obtained by applying the analysis in39 as

π nkl =G  n ˜ =  m n1 k ˜ = m k1 l ˜ = m l1 Δ n ˜ Δ k ˜ Δ l ˜ MathType@MTEF@5@5@+= feaagKart1ev2aaatCvAUfeBSjuyZL2yd9gzLbvyNv2CaerbuLwBLn hiov2DGi1BTfMBaeXatLxBI9gBaerbd9wDYLwzYbItLDharqqtubsr 4rNCHbGeaGqiVCI8FfYJH8YrFfeuY=Hhbbf9v8qqaqFr0xc9pk0xbb a9q8WqFfeaY=biLkVcLq=JHqpepeea0=as0Fb9pgeaYRXxe9vr0=vr 0=vqpWqaaeaabiGaciaacaqabeaadaqaaqaaaOqaaKqbakabec8aWn aaBaaajuaibaGaamOBaiaadUgacaWGSbaajuaGbeaacqGH9aqpcaWG hbaeaaaaaaaaa8qacaGGGcWaaebCaeaadaqeWbqaamaarahabaGaey iLdq0aaSbaaKqbGeaaceWGUbGbaGaaaKqbagqaaaqcfasaaiqadYga gaacaiabg2da9iaacckacqGHsislcaWGTbaabaGaamiBaiabgkHiTi aaigdaaKqbakabg+GivdaajuaibaGabm4AayaaiaGaeyypa0JaaiiO aiabgkHiTiaad2gaaeaacaWGRbGaeyOeI0IaaGymaaqcfaOaey4dIu naaKqbGeaaceWGUbGbaGaacqGH9aqpcaGGGcGaaiiOaiabgkHiTiaa d2gaaeaacaWGUbGaeyOeI0IaaGymaaqcfaOaey4dIunacqGHuoarda WgaaqcfasaaiqadUgagaacaaqcfayabaGaeyiLdq0aaSbaaKqbGeaa ceWGSbGbaGaaaKqbagqaaaaa@6955@ (2)

Where Δ n ˜ =  λ n ˜ μ n ˜  + 1 ;   λ n ˜ MathType@MTEF@5@5@+= feaagKart1ev2aaatCvAUfeBSjuyZL2yd9gzLbvyNv2CaerbuLwBLn hiov2DGi1BTfMBaeXatLxBI9gBaerbd9wDYLwzYbItLDharqqtubsr 4rNCHbGeaGqiVCI8FfYJH8YrFfeuY=Hhbbf9v8qqaqFr0xc9pk0xbb a9q8WqFfeaY=biLkVcLq=JHqpepeea0=as0Fb9pgeaYRXxe9vr0=vr 0=vqpWqaaeaabiGaciaacaqabeaadaqaaqaaaOqaaKqbakabgs5aen aaBaaajuaibaGabmOBayaaiaaajuaGbeaacqGH9aqpqaaaaaaaaaWd biaacckadaWcaaqaaiabeU7aSnaaBaaajuaibaGabmOBayaaiaaabe aaaKqbagaacqaH8oqBdaWgaaqaaKqbGiqad6gagaacaKqbakaaccka cqGHRaWkcaGGGcGaaGymaaqabaaaaiaacUdacaGGGcGaaiiOaiabeU 7aSnaaBaaajuaibaGabmOBayaaiaaajuaGbeaaaaa@4DC0@  is the rate of transiting from state n ˜ k ˜ l ˜ MathType@MTEF@5@5@+= feaagKart1ev2aaatCvAUfeBSjuyZL2yd9gzLbvyNv2CaerbuLwBLn hiov2DGi1BTfMBaeXatLxBI9gBaerbd9wDYLwzYbItLDharqqtubsr 4rNCHbGeaGqiVCI8FfYJH8YrFfeuY=Hhbbf9v8qqaqFr0xc9pk0xbb a9q8WqFfeaY=biLkVcLq=JHqpepeea0=as0Fb9pgeaYRXxe9vr0=vr 0=vqpWqaaeaabiGaciaacaqabeaadaqaaqaaaOqaaKqbacbaaaaaaa aapeGabmOBayaaiaGabm4AayaaiaGabmiBayaaiaaaaa@399A@ to ( n ˜  + 1,  k ˜   l ˜   ) MathType@MTEF@5@5@+= feaagKart1ev2aaatCvAUfeBSjuyZL2yd9gzLbvyNv2CaerbuLwBLn hiov2DGi1BTfMBaeXatLxBI9gBaerbd9wDYLwzYbItLDharqqtubsr 4rNCHbGeaGqiVCI8FfYJH8YrFfeuY=Hhbbf9v8qqaqFr0xc9pk0xbb a9q8WqFfeaY=biLkVcLq=JHqpepeea0=as0Fb9pgeaYRXxe9vr0=vr 0=vqpWqaaeaabiGaciaacaqabeaadaqaaqaaaOqaaKqbaoaabmaaba GabmOBayaaiaaeaaaaaaaaa8qacaGGGcGaey4kaSIaaiiOaiaaigda caGGSaGaaiiOaiqadUgagaacaiaacckaceWGSbGbaGaacaGGGcaapa GaayjkaiaawMcaaaaa@4333@ and μ n ˜ +1 MathType@MTEF@5@5@+= feaagKart1ev2aaatCvAUfeBSjuyZL2yd9gzLbvyNv2CaerbuLwBLn hiov2DGi1BTfMBaeXatLxBI9gBaerbd9wDYLwzYbItLDharqqtubsr 4rNCHbGeaGqiVCI8FfYJH8YrFfeuY=Hhbbf9v8qqaqFr0xc9pk0xbb a9q8WqFfeaY=biLkVcLq=JHqpepeea0=as0Fb9pgeaYRXxe9vr0=vr 0=vqpWqaaeaabiGaciaacaqabeaadaqaaqaaaOqaaKqbakabeY7aTn aaBaaajuaibaGabmOBayaaiaGaey4kaSIaaGymaaqcfayabaaaaa@3BAB@  is the rate of transiting from ( n ˜  + 1,  k ˜   l ˜   ) MathType@MTEF@5@5@+= feaagKart1ev2aaatCvAUfeBSjuyZL2yd9gzLbvyNv2CaerbuLwBLn hiov2DGi1BTfMBaeXatLxBI9gBaerbd9wDYLwzYbItLDharqqtubsr 4rNCHbGeaGqiVCI8FfYJH8YrFfeuY=Hhbbf9v8qqaqFr0xc9pk0xbb a9q8WqFfeaY=biLkVcLq=JHqpepeea0=as0Fb9pgeaYRXxe9vr0=vr 0=vqpWqaaeaabiGaciaacaqabeaadaqaaqaaaOqaaKqbaoaabmaaba GabmOBayaaiaaeaaaaaaaaa8qacaGGGcGaey4kaSIaaiiOaiaaigda caGGSaGaaiiOaiqadUgagaacaiaacckaceWGSbGbaGaacaGGGcaapa GaayjkaiaawMcaaaaa@4333@ to n ˜ , k ˜ , l ˜ MathType@MTEF@5@5@+= feaagKart1ev2aaatCvAUfeBSjuyZL2yd9gzLbvyNv2CaerbuLwBLn hiov2DGi1BTfMBaeXatLxBI9gBaerbd9wDYLwzYbItLDharqqtubsr 4rNCHbGeaGqiVCI8FfYJH8YrFfeuY=Hhbbf9v8qqaqFr0xc9pk0xbb a9q8WqFfeaY=biLkVcLq=JHqpepeea0=as0Fb9pgeaYRXxe9vr0=vr 0=vqpWqaaeaabiGaciaacaqabeaadaqaaqaaaOqaaKqbakqad6gaga acaiaacYcaceWGRbGbaGaacaGGSaGabmiBayaaiaaaaa@3ADA@ ( Δ k ¯ MathType@MTEF@5@5@+= feaagKart1ev2aaatCvAUfeBSjuyZL2yd9gzLbvyNv2CaerbuLwBLn hiov2DGi1BTfMBaeXatLxBI9gBaerbd9wDYLwzYbItLDharqqtubsr 4rNCHbGeaGqiVCI8FfYJH8YrFfeuY=Hhbbf9v8qqaqFr0xc9pk0xbb a9q8WqFfeaY=biLkVcLq=JHqpepeea0=as0Fb9pgeaYRXxe9vr0=vr 0=vqpWqaaeaabiGaciaacaqabeaadaqaaqaaaOqaaKqbakabgs5aen aaBaaajuaibaGabm4AayaaraaajuaGbeaaaaa@39C5@ and Δ k ¯ MathType@MTEF@5@5@+= feaagKart1ev2aaatCvAUfeBSjuyZL2yd9gzLbvyNv2CaerbuLwBLn hiov2DGi1BTfMBaeXatLxBI9gBaerbd9wDYLwzYbItLDharqqtubsr 4rNCHbGeaGqiVCI8FfYJH8YrFfeuY=Hhbbf9v8qqaqFr0xc9pk0xbb a9q8WqFfeaY=biLkVcLq=JHqpepeea0=as0Fb9pgeaYRXxe9vr0=vr 0=vqpWqaaeaabiGaciaacaqabeaadaqaaqaaaOqaaKqbakabgs5aen aaBaaajuaibaGabm4AayaaraaajuaGbeaaaaa@39C5@ are also defined similarly). The factor, G, in (2) is a normalization factor, so that n,k,l π nkl=1 MathType@MTEF@5@5@+= feaagKart1ev2aaatCvAUfeBSjuyZL2yd9gzLbvyNv2CaerbuLwBLn hiov2DGi1BTfMBaeXatLxBI9gBaerbd9wDYLwzYbItLDharqqtubsr 4rNCHbGeaGqiVCI8FfYJH8YrFfeuY=Hhbbf9v8qqaqFr0xc9pk0xbb a9q8WqFfeaY=biLkVcLq=JHqpepeea0=as0Fb9pgeaYRXxe9vr0=vr 0=vqpWqaaeaabiGaciaacaqabeaadaqaaqaaaOqaaKqbaoaaqaeaba WaaSbaaKqbGeaacaWGUbGaaiilaiaadUgacaGGSaGaamiBaaqcfaya baaabeqabiabggHiLdGaeqiWda3aaSbaaeaajuaicaWGUbGaam4Aai aadYgajuaGcqGH9aqpcaaIXaaabeaaaaa@44B5@  . For 3-D equivalent of the transition diagram shown in Figure 2,

Δ n ˜  =  Δ k ˜  =    Δ l ˜  = ρ =  λ μ MathType@MTEF@5@5@+= feaagKart1ev2aaatCvAUfeBSjuyZL2yd9gzLbvyNv2CaerbuLwBLn hiov2DGi1BTfMBaeXatLxBI9gBaerbd9wDYLwzYbItLDharqqtubsr 4rNCHbGeaGqiVCI8FfYJH8YrFfeuY=Hhbbf9v8qqaqFr0xc9pk0xbb a9q8WqFfeaY=biLkVcLq=JHqpepeea0=as0Fb9pgeaYRXxe9vr0=vr 0=vqpWqaaeaabiGaciaacaqabeaadaqaaqaaaOqaaKqbakabgs5aen aaBaaabaqcfaIabmOBayaaiaqcfaieaaaaaaaaa8qacaGGGcGaeyyp a0JaaiiOaiabgs5aenaaBaaabaqcfaIabm4AayaaiaqcfaOaaiiOai abg2da9iaacckaaeqaaiaacckacqGHuoardaWgaaqaaKqbGiqadYga gaacaKqbakaacckacqGH9aqpcaGGGcGaeqyWdiNaaiiOaiabg2da9i aacckadaWcaaqaaiabeU7aSbqaaiabeY7aTbaaaeqaaaWdaeqaaaaa @540B@  i.e.,

π nkl  =  ρ n+k+l   ( 1ρ 1 ρ 2m+1 ) 3  m  n, k, l m MathType@MTEF@5@5@+= feaagKart1ev2aaatCvAUfeBSjuyZL2yd9gzLbvyNv2CaerbuLwBLn hiov2DGi1BTfMBaeXatLxBI9gBaerbd9wDYLwzYbItLDharqqtubsr 4rNCHbGeaGqiVCI8FfYJH8YrFfeuY=Hhbbf9v8qqaqFr0xc9pk0xbb a9q8WqFfeaY=biLkVcLq=JHqpepeea0=as0Fb9pgeaYRXxe9vr0=vr 0=vqpWqaaeaabiGaciaacaqabeaadaqaaqaaaOqaaKqbakabec8aWn aaBaaabaqcfaIaamOBaiaadUgacaWGSbqcfaieaaaaaaaaa8qacaGG GcaapaqabaGaeyypa0ZdbiaacckacqaHbpGCdaahaaqcfasabeaaca WGUbGaey4kaSIaam4AaiabgUcaRiaadYgaaaqcfaOaaiiOamaabmaa baWaaSaaaeaacaaIXaGaeyOeI0IaeqyWdihabaGaaGymaiabgkHiTi abeg8aYnaaCaaajuaibeqaaiaaikdacaWGTbGaey4kaSIaaGymaaaa aaaajuaGcaGLOaGaayzkaaWaaWbaaKqbGeqabaGaaG4maaaacaGGGc qcfaOaeyOeI0IaamyBaiaacckacqGHKjYOcaGGGcGaamOBaiaacYca caGGGcGaam4AaiaacYcacaGGGcGaamiBaiabgsMiJkaacckacaWGTb aaaa@6742@  (3)

The ratio, ρ λ μ MathType@MTEF@5@5@+= feaagKart1ev2aaatCvAUfeBSjuyZL2yd9gzLbvyNv2CaerbuLwBLn hiov2DGi1BTfMBaeXatLxBI9gBaerbd9wDYLwzYbItLDharqqtubsr 4rNCHbGeaGqiVCI8FfYJH8YrFfeuY=Hhbbf9v8qqaqFr0xc9pk0xbb a9q8WqFfeaY=biLkVcLq=JHqpepeea0=as0Fb9pgeaYRXxe9vr0=vr 0=vqpWqaaeaabiGaciaacaqabeaadaqaaqaaaOqaaKqbakabeg8aYn aalaaajuaibaGaeq4UdWgabaGaeqiVd0gaaaaa@3BE1@  is the ratio of the rate at which the bacteria move towards the tumor to that at which they move away from the tumor, i.e., the directional efficiency of the bacteria. The average time taken to reach the region (m, m, m) starting from state, (0, 0, 0) is obtained by first-pass time analysis of a birth-death process. Let U ˜ MathType@MTEF@5@5@+= feaagKart1ev2aaatCvAUfeBSjuyZL2yd9gzLbvyNv2CaerbuLwBLn hiov2DGi1BTfMBaeXatLxBI9gBaerbd9wDYLwzYbItLDharqqtubsr 4rNCHbGeaGqiVCI8FfYJH8YrFfeuY=Hhbbf9v8qqaqFr0xc9pk0xbb a9q8WqFfeaY=biLkVcLq=JHqpepeea0=as0Fb9pgeaYRXxe9vr0=vr 0=vqpWqaaeaabiGaciaacaqabeaadaqaaqaaaOqaaiqadwfagaacaa aa@36D4@ (m) represent the average time taken for the CTMC to reach (m, m, m) starting from state, (0, 0, 0). Let U ˜ MathType@MTEF@5@5@+= feaagKart1ev2aaatCvAUfeBSjuyZL2yd9gzLbvyNv2CaerbuLwBLn hiov2DGi1BTfMBaeXatLxBI9gBaerbd9wDYLwzYbItLDharqqtubsr 4rNCHbGeaGqiVCI8FfYJH8YrFfeuY=Hhbbf9v8qqaqFr0xc9pk0xbb a9q8WqFfeaY=biLkVcLq=JHqpepeea0=as0Fb9pgeaYRXxe9vr0=vr 0=vqpWqaaeaabiGaciaacaqabeaadaqaaqaaaOqaaKqbakqadwfaga acaaaa@3762@  (m, 0, 0)4 represents the average first pass time to reach state (m, 0, 0) from state (0, 0, 0) in a one dimensional birth-death process. Formally, U ˜ MathType@MTEF@5@5@+= feaagKart1ev2aaatCvAUfeBSjuyZL2yd9gzLbvyNv2CaerbuLwBLn hiov2DGi1BTfMBaeXatLxBI9gBaerbd9wDYLwzYbItLDharqqtubsr 4rNCHbGeaGqiVCI8FfYJH8YrFfeuY=Hhbbf9v8qqaqFr0xc9pk0xbb a9q8WqFfeaY=biLkVcLq=JHqpepeea0=as0Fb9pgeaYRXxe9vr0=vr 0=vqpWqaaeaabiGaciaacaqabeaadaqaaqaaaOqaaKqbakqadwfaga acaaaa@3762@ (m, 0, 0) can be written as

u ˜ ( m,0,0) ) =E [ inf s0 X ˜ ( s ) = ( m,0,0 ) | X ˜ ( 0 ) = ( 0,0,0, ) ] MathType@MTEF@5@5@+= feaagKart1ev2aaatCvAUfeBSjuyZL2yd9gzLbvyNv2CaerbuLwBLn hiov2DGi1BTfMBaeXatLxBI9gBaerbd9wDYLwzYbItLDharqqtubsr 4rNCHbGeaGqiVCI8FfYJH8YrFfeuY=Hhbbf9v8qqaqFr0xc9pk0xbb a9q8WqFfeaY=biLkVcLq=JHqpepeea0=as0Fb9pgeaYRXxe9vr0=vr 0=vqpWqaaeaabiGaciaacaqabeaadaqaaqaaaOqaaKqbakqadwhaga acamaabmaabaGaamyBaiaacYcacaaIWaGaaiilaiaaicdacaGGPaaa caGLOaGaayzkaaaeaaaaaaaaa8qacaGGGcGaeyypa0Jaamyraiaacc kadaWadaqaamaaxababaWaaCbeaeaaciGGPbGaaiOBaiaacAgaaKqb GeaacaWGZbGaeyyzImRaaGimaaqcfayabaGabmiwayaaiaWaaeWaae aacaWGZbaacaGLOaGaayzkaaGaaiiOaiabg2da9iaacckadaqadaqa aiaad2gacaGGSaGaaGimaiaacYcacaaIWaaacaGLOaGaayzkaaGaai iOaiaacYhaceGGybGbaGaadaqadaqaaiaaicdaaiaawIcacaGLPaaa caGGGcGaeyypa0JaaiiOamaabmaabaGaaGimaiaacYcacaaIWaGaai ilaiaaicdacaGGSaaacaGLOaGaayzkaaaabaaabeaaaiaawUfacaGL Dbaaaaa@6574@  (4)

where X ¯ MathType@MTEF@5@5@+= feaagKart1ev2aaatCvAUfeBSjuyZL2yd9gzLbvyNv2CaerbuLwBLn hiov2DGi1BTfMBaeXatLxBI9gBaerbd9wDYLwzYbItLDharqqtubsr 4rNCHbGeaGqiVCI8FfYJH8YrFfeuY=Hhbbf9v8qqaqFr0xc9pk0xbb a9q8WqFfeaY=biLkVcLq=JHqpepeea0=as0Fb9pgeaYRXxe9vr0=vr 0=vqpWqaaeaabiGaciaacaqabeaadaqaaqaaaOqaaKqbakqadIfaga qeaaaa@376E@  (t) is the grid in which the bacteria are present at time, t. The Laplace transform of U ˜ MathType@MTEF@5@5@+= feaagKart1ev2aaatCvAUfeBSjuyZL2yd9gzLbvyNv2CaerbuLwBLn hiov2DGi1BTfMBaeXatLxBI9gBaerbd9wDYLwzYbItLDharqqtubsr 4rNCHbGeaGqiVCI8FfYJH8YrFfeuY=Hhbbf9v8qqaqFr0xc9pk0xbb a9q8WqFfeaY=biLkVcLq=JHqpepeea0=as0Fb9pgeaYRXxe9vr0=vr 0=vqpWqaaeaabiGaciaacaqabeaadaqaaqaaaOqaaKqbakqadwfaga acaaaa@3762@ (1; 0; 0)

is denoted by f ˜ 1  ( s ) MathType@MTEF@5@5@+= feaagKart1ev2aaatCvAUfeBSjuyZL2yd9gzLbvyNv2CaerbuLwBLn hiov2DGi1BTfMBaeXatLxBI9gBaerbd9wDYLwzYbItLDharqqtubsr 4rNCHbGeaGqiVCI8FfYJH8YrFfeuY=Hhbbf9v8qqaqFr0xc9pk0xbb a9q8WqFfeaY=biLkVcLq=JHqpepeea0=as0Fb9pgeaYRXxe9vr0=vr 0=vqpWqaaeaabiGaciaacaqabeaadaqaaqaaaOqaaKqbakqadAgaga acamaaBaaajuaibaGaaGymaaqcfayabaaeaaaaaaaaa8qacaGGGcWa aeWaaeaacaWGZbaacaGLOaGaayzkaaaaaa@3CD0@ , given by40

f ˜ 1  ( s ) =  μ s + λ + μ + λ s + λ + μ   f ˜ 2  ( s )  f ˜ 1  ( s ), MathType@MTEF@5@5@+= feaagKart1ev2aaatCvAUfeBSjuyZL2yd9gzLbvyNv2CaerbuLwBLn hiov2DGi1BTfMBaeXatLxBI9gBaerbd9wDYLwzYbItLDharqqtubsr 4rNCHbGeaGqiVCI8FfYJH8YrFfeuY=Hhbbf9v8qqaqFr0xc9pk0xbb a9q8WqFfeaY=biLkVcLq=JHqpepeea0=as0Fb9pgeaYRXxe9vr0=vr 0=vqpWqaaeaabiGaciaacaqabeaadaqaaqaaaOqaaKqbakqadAgaga acamaaBaaabaGaaGymaaqabaaeaaaaaaaaa8qacaGGGcWaaeWaaeaa caWGZbaacaGLOaGaayzkaaGaaiiOaiabg2da9iaacckadaWcaaqaai abeY7aTbqaaiaadohacaGGGcGaey4kaSIaaiiOaiabeU7aSjaaccka cqGHRaWkcaGGGcGaeqiVd0gaaiabgUcaRmaalaaabaGaeq4UdWgaba Gaam4CaiaacckacqGHRaWkcaGGGcGaeq4UdWMaaiiOaiabgUcaRiaa cckacqaH8oqBaaGaaiiOaiqadAgagaacamaaBaaajuaibaGaaGOmaa qcfayabaGaaiiOamaabmaabaGaam4CaaGaayjkaiaawMcaaiaaccka ceWGMbGbaGaadaWgaaqcfasaaiaaigdaaeqaaiaacckajuaGdaqada qaaiaadohaaiaawIcacaGLPaaacaGGSaaaaa@68A1@ (5), which can be solved recursively. Then,

u ˜  ( m,0,0 ) =  lim s 0    d  f ˜ 1  ( s ) ds . MathType@MTEF@5@5@+= feaagKart1ev2aaatCvAUfeBSjuyZL2yd9gzLbvyNv2CaerbuLwBLn hiov2DGi1BTfMBaeXatLxBI9gBaerbd9wDYLwzYbItLDharqqtubsr 4rNCHbGeaGqiVCI8FfYJH8YrFfeuY=Hhbbf9v8qqaqFr0xc9pk0xbb a9q8WqFfeaY=biLkVcLq=JHqpepeea0=as0Fb9pgeaYRXxe9vr0=vr 0=vqpWqaaeaabiGaciaacaqabeaadaqaaqaaaOqaaKqbakqadwhaga acaabaaaaaaaaapeGaaiiOamaabmaabaGaamyBaiaacYcacaaIWaGa aiilaiaaicdaaiaawIcacaGLPaaacaGGGcGaeyypa0JaaiiOamaaxa babaGaciiBaiaacMgacaGGTbaajuaibaGaam4CaiaacckacqGHsgIR caaIWaaajuaGbeaacaGGGcGaeyOeI0IaaiiOamaalaaabaGaamizai aacckaceWGMbGbaGaadaWgaaqcfasaaiaaigdaaeqaaKqbakaaccka daqadaqaaiaadohaaiaawIcacaGLPaaaaeaacaWGKbGaam4Caaaaca GGUaaaaa@57FC@ (6)

Since the transition rates from any state, (n, k, l) to (n+1, k, l), (n, k+1, l) and (n, k, l+1) are all equal to λ MathType@MTEF@5@5@+= feaagKart1ev2aaatCvAUfeBSjuyZL2yd9gzLbvyNv2CaerbuLwBLn hiov2DGi1BTfMBaeXatLxBI9gBaerbd9wDYLwzYbItLDharqqtubsr 4rNCHbGeaGqiVCI8FfYJH8YrFfeuY=Hhbbf9v8qqaqFr0xc9pk0xbb a9q8WqFfeaY=biLkVcLq=JHqpepeea0=as0Fb9pgeaYRXxe9vr0=vr 0=vqpWqaaeaabiGaciaacaqabeaadaqaaqaaaOqaaKqbakabeU7aSb aa@382D@ 5

U ˜  ( 0,m,0 ) =  U ˜  ( 0,0,m ) =  U ˜  ( m,0,0 ) MathType@MTEF@5@5@+= feaagKart1ev2aaatCvAUfeBSjuyZL2yd9gzLbvyNv2CaerbuLwBLn hiov2DGi1BTfMBaeXatLxBI9gBaerbd9wDYLwzYbItLDharqqtubsr 4rNCHbGeaGqiVCI8FfYJH8YrFfeuY=Hhbbf9v8qqaqFr0xc9pk0xbb a9q8WqFfeaY=biLkVcLq=JHqpepeea0=as0Fb9pgeaYRXxe9vr0=vr 0=vqpWqaaeaabiGaciaacaqabeaadaqaaqaaaOqaaKqbakqadwfaga acaabaaaaaaaaapeGaaiiOamaabmaabaGaaGimaiaacYcacaWGTbGa aiilaiaaicdaaiaawIcacaGLPaaacaGGGcGaeyypa0JaaiiOaiqadw fagaacaiaacckadaqadaqaaiaaicdacaGGSaGaaGimaiaacYcacaWG TbaacaGLOaGaayzkaaGaaiiOaiabg2da9iaacckaceWGvbGbaGaaca GGGcWaaeWaaeaacaWGTbGaaiilaiaaicdacaGGSaGaaGimaaGaayjk aiaawMcaaaaa@5349@ (7)

4 U ˜  ( m,0,0 ) MathType@MTEF@5@5@+= feaagKart1ev2aaatCvAUfeBSjuyZL2yd9gzLbvyNv2CaerbuLwBLn hiov2DGi1BTfMBaeXatLxBI9gBaerbd9wDYLwzYbItLDharqqtubsr 4rNCHbGeaGqiVCI8FfYJH8YrFfeuY=Hhbbf9v8qqaqFr0xc9pk0xbb a9q8WqFfeaY=biLkVcLq=JHqpepeea0=as0Fb9pgeaYRXxe9vr0=vr 0=vqpWqaaeaabiGaciaacaqabeaadaqaaqaaaOqaaKqbacbaaaaaaa aapeGabmyvayaaiaGaaiiOamaabmaabaGaamyBaiaacYcacaaIWaGa aiilaiaaicdaaiaawIcacaGLPaaaaaa@3DF5@ and U ˜  ( 0,0,m ) MathType@MTEF@5@5@+= feaagKart1ev2aaatCvAUfeBSjuyZL2yd9gzLbvyNv2CaerbuLwBLn hiov2DGi1BTfMBaeXatLxBI9gBaerbd9wDYLwzYbItLDharqqtubsr 4rNCHbGeaGqiVCI8FfYJH8YrFfeuY=Hhbbf9v8qqaqFr0xc9pk0xbb a9q8WqFfeaY=biLkVcLq=JHqpepeea0=as0Fb9pgeaYRXxe9vr0=vr 0=vqpWqaaeaabiGaciaacaqabeaadaqaaqaaaOqaaKqbacbaaaaaaa aapeGabmyvayaaiaGaaiiOamaabmaabaGaaGimaiaacYcacaaIWaGa aiilaiaad2gaaiaawIcacaGLPaaaaaa@3DF5@ can be similarly defined.

5Similarly, transition from state, (n,k, l) to states, (n -1, k, l), (n, k -1, l) and (n, k, l- 1) are all equal to μ MathType@MTEF@5@5@+= feaagKart1ev2aaatCvAUfeBSjuyZL2yd9gzLbvyNv2CaerbuLwBLn hiov2DGi1BTfMBaeXatLxBI9gBaerbd9wDYLwzYbItLDharqqtubsr 4rNCHbGeaGqiVCI8FfYJH8YrFfeuY=Hhbbf9v8qqaqFr0xc9pk0xbb a9q8WqFfeaY=biLkVcLq=JHqpepeea0=as0Fb9pgeaYRXxe9vr0=vr 0=vqpWqaaeaabiGaciaacaqabeaadaqaaqaaaOqaaKqbacbaaaaaaa aapeGaeqiVd0gaaa@384F@ Using the fact that the movement of the bacteria follows a random walk, i.e., the direction of transition from any state to its neighboring state is independent of the direction of the previous transition,

U ˜  ( m ) =  U ˜  ( m, 0, 0 ) +  U ˜  ( 0, m, 0 ) +  U ˜  ( 0, 0, m ) = 3 U ˜  ( m, 0, 0 ) =  3 λ   j=1 m   1 ρ j1  ( 1 +  i=1 j1   ρ i i ). MathType@MTEF@5@5@+= feaagKart1ev2aaatCvAUfeBSjuyZL2yd9gzLbvyNv2CaerbuLwBLn hiov2DGi1BTfMBaeXatLxBI9gBaerbd9wDYLwzYbItLDharqqtubsr 4rNCHbGeaGqiVCI8FfYJH8YrFfeuY=Hhbbf9v8qqaqFr0xc9pk0xbb a9q8WqFfeaY=biLkVcLq=JHqpepeea0=as0Fb9pgeaYRXxe9vr0=vr 0=vqpWqaaeaabiGaciaacaqabeaadaqaaqaaaOabaeqabaqcfaOabm yvayaaiaaeaaaaaaaaa8qacaGGGcWaaeWaaeaacaWGTbaacaGLOaGa ayzkaaGaaiiOaiabg2da9iaacckapaGabmyvayaaiaWdbiaacckada qadaqaaiaad2gacaGGSaGaaiiOaiaaicdacaGGSaGaaiiOaiaaicda aiaawIcacaGLPaaacaGGGcGaey4kaSIaaiiOaiqadwfagaacaiaacc kadaqadaqaaiaaicdacaGGSaGaaiiOaiaad2gacaGGSaGaaiiOaiaa icdaaiaawIcacaGLPaaacaGGGcGaey4kaSIaaiiOaiqadwfagaacai aacckadaqadaqaaiaaicdacaGGSaGaaiiOaiaaicdacaGGSaGaaiiO aiaad2gaaiaawIcacaGLPaaaaeaacqGH9aqpcaGGGcGaaG4maiqadw fagaacaiaacckadaqadaqaaiaad2gacaGGSaGaaiiOaiaaicdacaGG SaGaaiiOaiaaicdaaiaawIcacaGLPaaaaeaacqGH9aqpcaGGGcWaaS aaaeaacaaIZaaabaGaeq4UdWgaaiaacckadaaeWaqaaiaacckaaKqb GeaacaWGQbGaeyypa0JaaGymaaqaaiaad2gaaKqbakabggHiLdWaaS aaaeaacaaIXaaabaGaeqyWdi3aaWbaaeqajuaibaGaamOAaiabgkHi TiaaigdaaaaaaKqbakaacckadaqadaqaaiaaigdacaGGGcGaey4kaS IaaiiOamaaqadabaGaaiiOaaqcfasaaiaadMgacqGH9aqpcaaIXaaa baGaamOAaiabgkHiTiaaigdaaKqbakabggHiLdWaaSaaaeaacqaHbp GCdaahaaqabKqbGeaacaWGPbaaaaqcfayaaiaadMgaaaaacaGLOaGa ayzkaaGaaiOlaaaaaa@967A@  (8)

from (5)-(7). It is observed that the first pass time depends on m. This implies that the time taken for the bacteria to reach the tumor microenvironment is a function of the number of lattice grids the region of propagation is divided into. Note that the number of lattice regions, m, also impact the transition rates, λ MathType@MTEF@5@5@+= feaagKart1ev2aaatCvAUfeBSjuyZL2yd9gzLbvyNv2CaerbuLwBLn hiov2DGi1BTfMBaeXatLxBI9gBaerbd9wDYLwzYbItLDharqqtubsr 4rNCHbGeaGqiVCI8FfYJH8YrFfeuY=Hhbbf9v8qqaqFr0xc9pk0xbb a9q8WqFfeaY=biLkVcLq=JHqpepeea0=as0Fb9pgeaYRXxe9vr0=vr 0=vqpWqaaeaabiGaciaacaqabeaadaqaaqaaaOqaaKqbakabeU7aSb aa@382D@ and μ MathType@MTEF@5@5@+= feaagKart1ev2aaatCvAUfeBSjuyZL2yd9gzLbvyNv2CaerbuLwBLn hiov2DGi1BTfMBaeXatLxBI9gBaerbd9wDYLwzYbItLDharqqtubsr 4rNCHbGeaGqiVCI8FfYJH8YrFfeuY=Hhbbf9v8qqaqFr0xc9pk0xbb a9q8WqFfeaY=biLkVcLq=JHqpepeea0=as0Fb9pgeaYRXxe9vr0=vr 0=vqpWqaaeaabiGaciaacaqabeaadaqaaqaaaOqaaKqbakabeY7aTb aa@382F@ since they are dependent on the average motility of the bacteria and the size of individual regions. The following theorem helps us remove the dependence on m.

Theorem 2.1: When the directional efficiency and the number of grids are large, the first passage time to the tumor does not depend on the number of grids.

Proof: From (8),

lim m   U ˜ ( m ) =  3 λ   lim m   3 λ   j=1 m 1 ρ j1  ( 1 +  i=1 j1   ρ i i ) MathType@MTEF@5@5@+= feaagKart1ev2aaatCvAUfeBSjuyZL2yd9gzLbvyNv2CaerbuLwBLn hiov2DGi1BTfMBaeXatLxBI9gBaerbd9wDYLwzYbItLDharqqtubsr 4rNCHbGeaGqiVCI8FfYJH8YrFfeuY=Hhbbf9v8qqaqFr0xc9pk0xbb a9q8WqFfeaY=biLkVcLq=JHqpepeea0=as0Fb9pgeaYRXxe9vr0=vr 0=vqpWqaaeaabiGaciaacaqabeaadaqaaqaaaOqaaKqbaoaaxababa GaciiBaiaacMgacaGGTbaajuaibaGaamyBaiabgkziUkabg6HiLcqc fayabaaeaaaaaaaaa8qacaGGGcGabmyvayaaiaWaaeWaaeaacaWGTb aacaGLOaGaayzkaaGaaiiOaiabg2da9iaacckadaWcaaqaaiaaioda aeaacqaH7oaBaaGaaiiOa8aadaWfqaqaaiGacYgacaGGPbGaaiyBaa qcfasaaiaad2gacqGHsgIRcqGHEisPaKqbagqaa8qacaGGGcWaaSaa aeaacaaIZaaabaGaeq4UdWgaaiaacckadaaeWbqaamaalaaabaGaaG ymaaqaaiabeg8aYnaaCaaajuaibeqaaiaadQgacqGHsislcaaIXaaa aaaaaeaacaWGQbGaeyypa0JaaGymaaqaaiaad2gaaKqbakabggHiLd GaaiiOamaabmaabaGaaGymaiaacckacqGHRaWkcaGGGcWaaabCaeaa caGGGcaajuaibaGaamyAaiabg2da9iaaigdaaeaacaWGQbGaeyOeI0 IaaGymaaqcfaOaeyyeIuoadaWcaaqaaiabeg8aYnaaCaaajuaibeqa aiaadMgaaaaajuaGbaGaamyAaaaaaiaawIcacaGLPaaaaaa@7748@

which simplifies to

4 lim m   U ˜ ( m ) =  3 λ   j=1   1 ρ j1  +  3 λ   j=1   i=1 j1  =  ρ i i ρ j1  =   3 λ 1 1 1 ρ  +  3 λ   i=1   1 i ρ 1   j=i+1   1 ρ j1 MathType@MTEF@5@5@+= feaagKart1ev2aaatCvAUfeBSjuyZL2yd9gzLbvyNv2CaerbuLwBLn hiov2DGi1BTfMBaeXatLxBI9gBaerbd9wDYLwzYbItLDharqqtubsr 4rNCHbGeaGqiVCI8FfYJH8YrFfeuY=Hhbbf9v8qqaqFr0xc9pk0xbb a9q8WqFfeaY=biLkVcLq=JHqpepeea0=as0Fb9pgeaYRXxe9vr0=vr 0=vqpWqaaeaabiGaciaacaqabeaadaqaaqaaaOqaaKqbaoaaxababa GaciiBaiaacMgacaGGTbaajuaibaGaamyBaiabgkziUkabg6HiLcqc fayabaaeaaaaaaaaa8qacaGGGcGabmyvayaaiaWaaeWaaeaacaWGTb aacaGLOaGaayzkaaGaaiiOaiabg2da9iaacckadaWcaaqaaiaaioda aeaacqaH7oaBaaGaaiiOamaaqahabaGaaiiOaaqcfasaaiaadQgacq GH9aqpcaaIXaaabaGaeyOhIukajuaGcqGHris5amaalaaabaGaaGym aaqaaiabeg8aYnaaCaaabeqcfasaaiaadQgacqGHsislcaaIXaaaaa aajuaGcaGGGcGaey4kaSIaaiiOamaalaaabaGaaG4maaqaaiabeU7a SbaacaGGGcWaaabCaeaaaKqbGeaacaWGQbGaeyypa0JaaGymaaqaai abg6HiLcqcfaOaeyyeIuoacaGGGcWaaabCaeaacaGGGcGaeyypa0Ja aiiOaaqcfasaaiaadMgacqGH9aqpcaaIXaaabaGaamOAaiabgkHiTi aaigdaaKqbakabggHiLdWaaSaaaeaacqaHbpGCdaahaaqcfasabeaa caWGPbaaaaqcfayaaiaadMgacqaHbpGCdaahaaqabKqbGeaacaWGQb GaeyOeI0IaaGymaaaaaaqcfaOaaiiOaiabg2da9iaacckacaGGGcWa aSaaaeaacaaIZaaabaGaeq4UdWgaamaalaaabaGaaGymaaqaaiaaig dacqGHsisldaWcaaqaaiaaigdaaeaacqaHbpGCaaaaaiaacckacqGH RaWkcaGGGcWaaSaaaeaacaaIZaaabaGaeq4UdWgaaiaacckadaaeWb qaaiaacckaaKqbGeaacaWGPbGaeyypa0JaaGymaaqaaiabg6HiLcqc faOaeyyeIuoadaWcaaqaaiaaigdaaeaacaWGPbGaeqyWdi3aaWbaae qajuaibaGaaGymaaaaaaqcfaOaaiiOamaaqahabaGaaiiOaaqaaiaa dQgacqGH9aqpcaWGPbGaey4kaSIaaGymaaqcfasaaiabg6HiLcqcfa OaeyyeIuoadaWcaaqaaiaaigdaaeaacqaHbpGCdaahaaqabKqbGeaa caWGQbGaeyOeI0IaaGymaaaaaaaaaa@AD09@

When p > 1 (i.e., when the directional efficiency of the bacteria is large), the above simplifies to

lim m   U ˜  ( m ) =  3 λ   p ρ1  ( 1 + In  ρ ρ1 ) MathType@MTEF@5@5@+= feaagKart1ev2aaatCvAUfeBSjuyZL2yd9gzLbvyNv2CaerbuLwBLn hiov2DGi1BTfMBaeXatLxBI9gBaerbd9wDYLwzYbItLDharqqtubsr 4rNCHbGeaGqiVCI8FfYJH8YrFfeuY=Hhbbf9v8qqaqFr0xc9pk0xbb a9q8WqFfeaY=biLkVcLq=JHqpepeea0=as0Fb9pgeaYRXxe9vr0=vr 0=vqpWqaaeaabiGaciaacaqabeaadaqaaqaaaOqaaKqbaoaaxababa GaciiBaiaacMgacaGGTbaajuaibaGaamyBaiabgkziUkabg6HiLcqc fayabaaeaaaaaaaaa8qacaGGGcGabmyvayaaiaGaaiiOamaabmaaba GaamyBaaGaayjkaiaawMcaaiaacckacqGH9aqpcaGGGcWaaSaaaeaa caaIZaaabaGaeq4UdWgaaiaacckadaWcaaqaaiaadchaaeaacqaHbp GCcqGHsislcaaIXaaaaiaacckadaqadaqaaiaaigdacaGGGcGaey4k aSIaaiiOaiaacMeacaGGUbGaaiiOamaalaaabaGaeqyWdihabaGaeq yWdiNaeyOeI0IaaGymaaaaaiaawIcacaGLPaaaaaa@5E5C@  (9)

which is independent of m. Note that from Figure 2, the number of grids in three dimensions is ( 2m + 1 ) 3 MathType@MTEF@5@5@+= feaagKart1ev2aaatCvAUfeBSjuyZL2yd9gzLbvyNv2CaerbuLwBLn hiov2DGi1BTfMBaeXatLxBI9gBaerbd9wDYLwzYbItLDharqqtubsr 4rNCHbGeaGqiVCI8FfYJH8YrFfeuY=Hhbbf9v8qqaqFr0xc9pk0xbb a9q8WqFfeaY=biLkVcLq=JHqpepeea0=as0Fb9pgeaYRXxe9vr0=vr 0=vqpWqaaeaabiGaciaacaqabeaadaqaaqaaaOqaaKqbaoaabmaaba GaaGOmaiaad2gaqaaaaaaaaaWdbiaacckacqGHRaWkcaGGGcGaaGym aaWdaiaawIcacaGLPaaadaahaaqcfasabeaacaaIZaaaaaaa@3ED1@

Since, lim m   U ˜  ( m ) MathType@MTEF@5@5@+= feaagKart1ev2aaatCvAUfeBSjuyZL2yd9gzLbvyNv2CaerbuLwBLn hiov2DGi1BTfMBaeXatLxBI9gBaerbd9wDYLwzYbItLDharqqtubsr 4rNCHbGeaGqiVCI8FfYJH8YrFfeuY=Hhbbf9v8qqaqFr0xc9pk0xbb a9q8WqFfeaY=biLkVcLq=JHqpepeea0=as0Fb9pgeaYRXxe9vr0=vr 0=vqpWqaaeaabiGaciaacaqabeaadaqaaqaaaOqaaKqbakGacYgaca GGPbGaaiyBamaaBaaajuaibaGaamyBaiabgkziUkabg6HiLcqcfaya baaeaaaaaaaaa8qacaGGGcGabmyvayaaiaGaaiiOamaabmaabaGaam yBaaGaayjkaiaawMcaaaaa@4442@  is independent of m from (9), it is independent of the number of grids, ( 2m + 1 ) 3 MathType@MTEF@5@5@+= feaagKart1ev2aaatCvAUfeBSjuyZL2yd9gzLbvyNv2CaerbuLwBLn hiov2DGi1BTfMBaeXatLxBI9gBaerbd9wDYLwzYbItLDharqqtubsr 4rNCHbGeaGqiVCI8FfYJH8YrFfeuY=Hhbbf9v8qqaqFr0xc9pk0xbb a9q8WqFfeaY=biLkVcLq=JHqpepeea0=as0Fb9pgeaYRXxe9vr0=vr 0=vqpWqaaeaabiGaciaacaqabeaadaqaaqaaaOqaaKqbaoaabmaaba GaaGOmaiaad2gaqaaaaaaaaaWdbiaacckacqGHRaWkcaGGGcGaaGym aaWdaiaawIcacaGLPaaadaahaaqcfasabeaacaaIZaaaaaaa@3ED1@ .

If the bacteria travels at velocity or motility, v, the distance between the region of injection of the bacteria and tumor microenvironment is d and the cell diameter is c, then d  2  ×  c × m, MathType@MTEF@5@5@+= feaagKart1ev2aaatCvAUfeBSjuyZL2yd9gzLbvyNv2CaerbuLwBLn hiov2DGi1BTfMBaeXatLxBI9gBaerbd9wDYLwzYbItLDharqqtubsr 4rNCHbGeaGqiVCI8FfYJH8YrFfeuY=Hhbbf9v8qqaqFr0xc9pk0xbb a9q8WqFfeaY=biLkVcLq=JHqpepeea0=as0Fb9pgeaYRXxe9vr0=vr 0=vqpWqaaeaabiGaciaacaqabeaadaqaaqaaaOqaaKqbakaadsgaqa aaaaaaaaWdbiaacckadaGcaaqaaiaaikdaaeqaaiaacckacqGHxdaT caGGGcGaaiiOaiaadogacaGGGcGaey41aqRaaiiOaiaad2gacaGGSa aaaa@45DE@ i.e., m   d 2c MathType@MTEF@5@5@+= feaagKart1ev2aaatCvAUfeBSjuyZL2yd9gzLbvyNv2CaerbuLwBLn hiov2DGi1BTfMBaeXatLxBI9gBaerbd9wDYLwzYbItLDharqqtubsr 4rNCHbGeaGqiVCI8FfYJH8YrFfeuY=Hhbbf9v8qqaqFr0xc9pk0xbb a9q8WqFfeaY=biLkVcLq=JHqpepeea0=as0Fb9pgeaYRXxe9vr0=vr 0=vqpWqaaeaabiGaciaacaqabeaadaqaaqaaaOqaceaaKsqcfaOaam yBaabaaaaaaaaapeGaaiiOaiabgIKi7kaacckadaWbdaqaamaalaaa baGaamizaaqaamaakaaabaGaaGOmaiaadogaaeqaaaaaaiaaw6o+ca GL5Jpaaaa@43F1@  and λ   υ d 2m   cυ d 2 , MathType@MTEF@5@5@+= feaagKart1ev2aaatCvAUfeBSjuyZL2yd9gzLbvyNv2CaerbuLwBLn hiov2DGi1BTfMBaeXatLxBI9gBaerbd9wDYLwzYbItLDharqqtubsr 4rNCHbGeaGqiVCI8FfYJH8YrFfeuY=Hhbbf9v8qqaqFr0xc9pk0xbb a9q8WqFfeaY=biLkVcLq=JHqpepeea0=as0Fb9pgeaYRXxe9vr0=vr 0=vqpWqaaeaabiGaciaacaqabeaadaqaaqaaaOqaceaaKsqcfaOaeq 4UdWgeaaaaaaaaa8qacaGGGcGaeyisISRaaiiOamaalaaabaGaeqyX duhabaGaamizamaakaaabaGaaGOmaiaad2gaaeqaaaaacaGGGcGaey isIS7aaSaaaeaacaWGJbGaeqyXduhabaGaamizamaaCaaajuaibeqa aiaaikdaaaaaaKqbakaacYcaaaa@4A36@ which is independent of m. Also, if the approximation is ignored, λ MathType@MTEF@5@5@+= feaagKart1ev2aaatCvAUfeBSjuyZL2yd9gzLbvyNv2CaerbuLwBLn hiov2DGi1BTfMBaeXatLxBI9gBaerbd9wDYLwzYbItLDharqqtubsr 4rNCHbGeaGqiVCI8FfYJH8YrFfeuY=Hhbbf9v8qqaqFr0xc9pk0xbb a9q8WqFfeaY=biLkVcLq=JHqpepeea0=as0Fb9pgeaYRXxe9vr0=vr 0=vqpWqaaeaabiGaciaacaqabeaadaqaaqaaaOqaceaaKsqcfaOaeq 4UdWgaaa@38D8@ and µ vary with m at the same rate and hence the ratio ρ= λ μ MathType@MTEF@5@5@+= feaagKart1ev2aaatCvAUfeBSjuyZL2yd9gzLbvyNv2CaerbuLwBLn hiov2DGi1BTfMBaeXatLxBI9gBaerbd9wDYLwzYbItLDharqqtubsr 4rNCHbGeaGqiVCI8FfYJH8YrFfeuY=Hhbbf9v8qqaqFr0xc9pk0xbb a9q8WqFfeaY=biLkVcLq=JHqpepeea0=as0Fb9pgeaYRXxe9vr0=vr 0=vqpWqaaeaabiGaciaacaqabeaadaqaaqaaaOqaceaaKsqcfaOaeq yWdiNaeyypa0ZaaSaaaeaacqaH7oaBaeaacqaH8oqBaaaaaa@3D64@ becomes independent of m. Therefore, the approximate time to reach the desired region is independent of the size of the lattice, m. However, if bacteria move in groups of population of size, g, then λ=g λ g MathType@MTEF@5@5@+= feaagKart1ev2aaatCvAUfeBSjuyZL2yd9gzLbvyNv2CaerbuLwBLn hiov2DGi1BTfMBaeXatLxBI9gBaerbd9wDYLwzYbItLDharqqtubsr 4rNCHbGeaGqiVCI8FfYJH8YrFfeuY=Hhbbf9v8qqaqFr0xc9pk0xbb a9q8WqFfeaY=biLkVcLq=JHqpepeea0=as0Fb9pgeaYRXxe9vr0=vr 0=vqpWqaaeaabiGaciaacaqabeaadaqaaqaaaOqaceaaKsqcfaOaeq 4UdWMaeyypa0Jaam4zaiabeU7aSnaaBaaajuaibaGaam4zaaqcfaya baaaaa@3E47@ where λ g MathType@MTEF@5@5@+= feaagKart1ev2aaatCvAUfeBSjuyZL2yd9gzLbvyNv2CaerbuLwBLn hiov2DGi1BTfMBaeXatLxBI9gBaerbd9wDYLwzYbItLDharqqtubsr 4rNCHbGeaGqiVCI8FfYJH8YrFfeuY=Hhbbf9v8qqaqFr0xc9pk0xbb a9q8WqFfeaY=biLkVcLq=JHqpepeea0=as0Fb9pgeaYRXxe9vr0=vr 0=vqpWqaaeaabiGaciaacaqabeaadaqaaqaaaOqaceaaKsqcfaOaeq 4UdW2aaSbaaKqbGeaacaWGNbaajuaGbeaaaaa@3AA1@ is the rate of each individual in the group and U ˜  ( m ) MathType@MTEF@5@5@+= feaagKart1ev2aaatCvAUfeBSjuyZL2yd9gzLbvyNv2CaerbuLwBLn hiov2DGi1BTfMBaeXatLxBI9gBaerbd9wDYLwzYbItLDharqqtubsr 4rNCHbGeaGqiVCI8FfYJH8YrFfeuY=Hhbbf9v8qqaqFr0xc9pk0xbb a9q8WqFfeaY=biLkVcLq=JHqpepeea0=as0Fb9pgeaYRXxe9vr0=vr 0=vqpWqaaeaabiGaciaacaqabeaadaqaaqaaaOqaceaaKsqcfaOabm yvayaaiaaeaaaaaaaaa8qacaGGGcWaaeWaaeaacaWGTbaacaGLOaGa ayzkaaaaaa@3BCC@  is inversely proportional to g, indicating that as the population size increases, the time taken to reach the tumor microenvironment decreases.

Results and discussion

For the numerical computations, we consider cell diameter of 1.1 pm34 and bacterial motility of 2.5 μm/s MathType@MTEF@5@5@+= feaagKart1ev2aaatCvAUfeBSjuyZL2yd9gzLbvyNv2CaerbuLwBLn hiov2DGi1BTfMBaeXatLxBI9gBaerbd9wDYLwzYbItLDharqqtubsr 4rNCHbGeaGqiVCI8FfYJH8YrFfeuY=Hhbbf9v8qqaqFr0xc9pk0xbb a9q8WqFfeaY=biLkVcLq=JHqpepeea0=as0Fb9pgeaYRXxe9vr0=vr 0=vqpWqaaeaabiGaciaacaqabeaadaqaaqaaaOqaaKqbacbaaaaaaa aapeGaeqiVd0MaamyBaiaac+cacaWGZbaaaa@3AEC@ to 37.5 μm/s MathType@MTEF@5@5@+= feaagKart1ev2aaatCvAUfeBSjuyZL2yd9gzLbvyNv2CaerbuLwBLn hiov2DGi1BTfMBaeXatLxBI9gBaerbd9wDYLwzYbItLDharqqtubsr 4rNCHbGeaGqiVCI8FfYJH8YrFfeuY=Hhbbf9v8qqaqFr0xc9pk0xbb a9q8WqFfeaY=biLkVcLq=JHqpepeea0=as0Fb9pgeaYRXxe9vr0=vr 0=vqpWqaaeaabiGaciaacaqabeaadaqaaqaaaOqaaKqbacbaaaaaaa aapeGaeqiVd0MaamyBaiaac+cacaWGZbaaaa@3AEC@ ,28 i.e., about 2 to 34 cell diameters per second. This results in a λ g  = 2 d 2 MathType@MTEF@5@5@+= feaagKart1ev2aaatCvAUfeBSjuyZL2yd9gzLbvyNv2CaerbuLwBLn hiov2DGi1BTfMBaeXatLxBI9gBaerbd9wDYLwzYbItLDharqqtubsr 4rNCHbGeaGqiVCI8FfYJH8YrFfeuY=Hhbbf9v8qqaqFr0xc9pk0xbb a9q8WqFfeaY=biLkVcLq=JHqpepeea0=as0Fb9pgeaYRXxe9vr0=vr 0=vqpWqaaeaabiGaciaacaqabeaadaqaaqaaaOqaaKqbacbaaaaaaa aapeGaeq4UdW2aaSbaaeaajuaicaWGNbqcfaOaaiiOaaqabaGaeyyp a0ZaaSaaaeaacaaIYaaabaGaamizamaaCaaajuaibeqaaiaaikdaaa aaaaaa@3F01@ to λ g  = 300 d 2 MathType@MTEF@5@5@+= feaagKart1ev2aaatCvAUfeBSjuyZL2yd9gzLbvyNv2CaerbuLwBLn hiov2DGi1BTfMBaeXatLxBI9gBaerbd9wDYLwzYbItLDharqqtubsr 4rNCHbGeaGqiVCI8FfYJH8YrFfeuY=Hhbbf9v8qqaqFr0xc9pk0xbb a9q8WqFfeaY=biLkVcLq=JHqpepeea0=as0Fb9pgeaYRXxe9vr0=vr 0=vqpWqaaeaabiGaciaacaqabeaadaqaaqaaaOqaaKqbacbaaaaaaa aapeGaeq4UdW2aaSbaaeaajuaicaWGNbqcfaOaaiiOaaqabaGaeyyp a0ZaaSaaaeaacaaIZaGaaGimaiaaicdaaeaacaWGKbWaaWbaaKqbGe qabaGaaGOmaaaaaaaaaa@4076@ where d is the distance between the point of injection and the tumor microenvironment, expressed in microns. For a population of size, g, λ=g λ g MathType@MTEF@5@5@+= feaagKart1ev2aaatCvAUfeBSjuyZL2yd9gzLbvyNv2CaerbuLwBLn hiov2DGi1BTfMBaeXatLxBI9gBaerbd9wDYLwzYbItLDharqqtubsr 4rNCHbGeaGqiVCI8FfYJH8YrFfeuY=Hhbbf9v8qqaqFr0xc9pk0xbb a9q8WqFfeaY=biLkVcLq=JHqpepeea0=as0Fb9pgeaYRXxe9vr0=vr 0=vqpWqaaeaabiGaciaacaqabeaadaqaaqaaaOqaceaaKsqcfaOaeq 4UdWMaeyypa0Jaam4zaiabeU7aSnaaBaaajuaibaGaam4zaaqcfaya baaaaa@3E47@ as mentioned in Section 5.2. We compute the average time taken to reach the tumor microenvironment, as a function of the motility of the bacteria. We consider three cases,

  • The directional efficiency, ρ   λ μ  =  1 2 MathType@MTEF@5@5@+= feaagKart1ev2aaatCvAUfeBSjuyZL2yd9gzLbvyNv2CaerbuLwBLn hiov2DGi1BTfMBaeXatLxBI9gBaerbd9wDYLwzYbItLDharqqtubsr 4rNCHbGeaGqiVCI8FfYJH8YrFfeuY=Hhbbf9v8qqaqFr0xc9pk0xbb a9q8WqFfeaY=biLkVcLq=JHqpepeea0=as0Fb9pgeaYRXxe9vr0=vr 0=vqpWqaaeaabiGaciaacaqabeaadaqaaqaaaOqaceaaKsqcfaOaeq yWdiheaaaaaaaaa8qacaGGGcGaeSixIaKaaiiOamaalaaabaGaeq4U dWgabaGaeqiVd0gaaiaacckacqGH9aqpcaGGGcWaaSaaaeaacaaIXa aabaGaaGOmaaaaaaa@44EA@ i.e., bacteria is twice as fast to move away from the tumor microenvironment as towards the tumor microenvironment.
  •  p = 1, i.e., the bacteria is equally likely to move away from the tumor microenvironment as well as towards the tumor microenvironment.
  •  p = 2, i.e., the bacteria is twice as fast to move towards the tumor microenvironment as away from the tumor microenvironment.

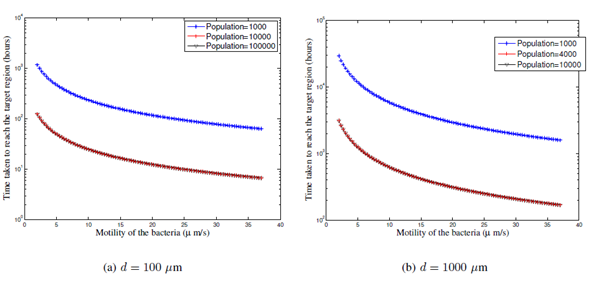
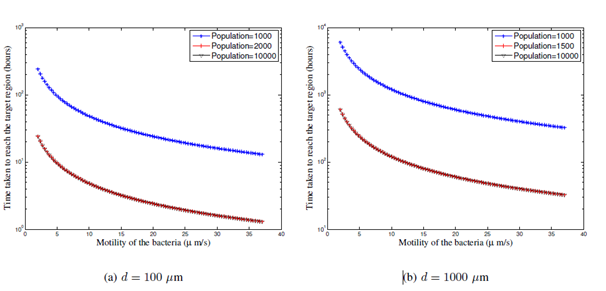
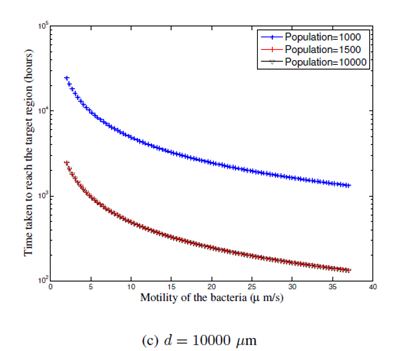
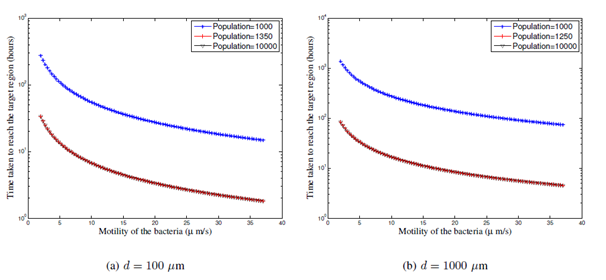
For each case above, we measure the average time taken to reach the tumor microenvironment from the region of injection, when the distance, d, from the region of injection to the tumor microenvironment (i) d = 100 μm MathType@MTEF@5@5@+= feaagKart1ev2aaatCvAUfeBSjuyZL2yd9gzLbvyNv2CaerbuLwBLn hiov2DGi1BTfMBaeXatLxBI9gBaerbd9wDYLwzYbItLDharqqtubsr 4rNCHbGeaGqiVCI8FfYJH8YrFfeuY=Hhbbf9v8qqaqFr0xc9pk0xbb a9q8WqFfeaY=biLkVcLq=JHqpepeea0=as0Fb9pgeaYRXxe9vr0=vr 0=vqpWqaaeaabiGaciaacaqabeaadaqaaqaaaOqaceaaKsqcfaOaeq iVd0MaamyBaaaa@39CC@ , (i) d = 1000 μm MathType@MTEF@5@5@+= feaagKart1ev2aaatCvAUfeBSjuyZL2yd9gzLbvyNv2CaerbuLwBLn hiov2DGi1BTfMBaeXatLxBI9gBaerbd9wDYLwzYbItLDharqqtubsr 4rNCHbGeaGqiVCI8FfYJH8YrFfeuY=Hhbbf9v8qqaqFr0xc9pk0xbb a9q8WqFfeaY=biLkVcLq=JHqpepeea0=as0Fb9pgeaYRXxe9vr0=vr 0=vqpWqaaeaabiGaciaacaqabeaadaqaaqaaaOqaceaaKsqcfaOaeq iVd0MaamyBaaaa@39CC@  and (iii) d = 10000 μm MathType@MTEF@5@5@+= feaagKart1ev2aaatCvAUfeBSjuyZL2yd9gzLbvyNv2CaerbuLwBLn hiov2DGi1BTfMBaeXatLxBI9gBaerbd9wDYLwzYbItLDharqqtubsr 4rNCHbGeaGqiVCI8FfYJH8YrFfeuY=Hhbbf9v8qqaqFr0xc9pk0xbb a9q8WqFfeaY=biLkVcLq=JHqpepeea0=as0Fb9pgeaYRXxe9vr0=vr 0=vqpWqaaeaabiGaciaacaqabeaadaqaaqaaaOqaceaaKsqcfaOaeq iVd0MaamyBaaaa@39CC@ . Figures 3- 5 depict the first passage time results for ρ= 1 2 MathType@MTEF@5@5@+= feaagKart1ev2aaatCvAUfeBSjuyZL2yd9gzLbvyNv2CaerbuLwBLn hiov2DGi1BTfMBaeXatLxBI9gBaerbd9wDYLwzYbItLDharqqtubsr 4rNCHbGeaGqiVCI8FfYJH8YrFfeuY=Hhbbf9v8qqaqFr0xc9pk0xbb a9q8WqFfeaY=biLkVcLq=JHqpepeea0=as0Fb9pgeaYRXxe9vr0=vr 0=vqpWqaaeaabiGaciaacaqabeaadaqaaqaaaOqaceaaKsqcfaOaeq yWdiNaeyypa0ZaaSaaaeaacaaIXaaabaGaaGOmaaaaaaa@3B71@  and 2, respectively.

It is observed from Figures 3-5, that there is a threshold population size (called saturation threshold) beyond which, the increase in population size is ineffective. From Figure 3, it is observed that when ρ= 1 2 MathType@MTEF@5@5@+= feaagKart1ev2aaatCvAUfeBSjuyZL2yd9gzLbvyNv2CaerbuLwBLn hiov2DGi1BTfMBaeXatLxBI9gBaerbd9wDYLwzYbItLDharqqtubsr 4rNCHbGeaGqiVCI8FfYJH8YrFfeuY=Hhbbf9v8qqaqFr0xc9pk0xbb a9q8WqFfeaY=biLkVcLq=JHqpepeea0=as0Fb9pgeaYRXxe9vr0=vr 0=vqpWqaaeaabiGaciaacaqabeaadaqaaqaaaOqaceaaKsqcfaOaeq yWdiNaeyypa0ZaaSaaaeaacaaIXaaabaGaaGOmaaaaaaa@3B71@ , for an order of increase in d, there is an order of increase in the time taken to reach the tumor microenvironment from the region of injection, e.g., from 15 hours for d = 100 μm MathType@MTEF@5@5@+= feaagKart1ev2aaatCvAUfeBSjuyZL2yd9gzLbvyNv2CaerbuLwBLn hiov2DGi1BTfMBaeXatLxBI9gBaerbd9wDYLwzYbItLDharqqtubsr 4rNCHbGeaGqiVCI8FfYJH8YrFfeuY=Hhbbf9v8qqaqFr0xc9pk0xbb a9q8WqFfeaY=biLkVcLq=JHqpepeea0=as0Fb9pgeaYRXxe9vr0=vr 0=vqpWqaaeaabiGaciaacaqabeaadaqaaqaaaOqaceaaKsqcfaOaeq iVd0MaamyBaaaa@39CC@  (see Figure 3a) to 150 hours for d = 1000 μm MathType@MTEF@5@5@+= feaagKart1ev2aaatCvAUfeBSjuyZL2yd9gzLbvyNv2CaerbuLwBLn hiov2DGi1BTfMBaeXatLxBI9gBaerbd9wDYLwzYbItLDharqqtubsr 4rNCHbGeaGqiVCI8FfYJH8YrFfeuY=Hhbbf9v8qqaqFr0xc9pk0xbb a9q8WqFfeaY=biLkVcLq=JHqpepeea0=as0Fb9pgeaYRXxe9vr0=vr 0=vqpWqaaeaabiGaciaacaqabeaadaqaaqaaaOqaceaaKsqcfaOaeq iVd0MaamyBaaaa@39CC@  (Figure 3b) and to 1250 hours for d = 10000 μm MathType@MTEF@5@5@+= feaagKart1ev2aaatCvAUfeBSjuyZL2yd9gzLbvyNv2CaerbuLwBLn hiov2DGi1BTfMBaeXatLxBI9gBaerbd9wDYLwzYbItLDharqqtubsr 4rNCHbGeaGqiVCI8FfYJH8YrFfeuY=Hhbbf9v8qqaqFr0xc9pk0xbb a9q8WqFfeaY=biLkVcLq=JHqpepeea0=as0Fb9pgeaYRXxe9vr0=vr 0=vqpWqaaeaabiGaciaacaqabeaadaqaaqaaaOqaceaaKsqcfaOaeq iVd0MaamyBaaaa@39CC@  (Figure 3c) for a motility of 25 μm MathType@MTEF@5@5@+= feaagKart1ev2aaatCvAUfeBSjuyZL2yd9gzLbvyNv2CaerbuLwBLn hiov2DGi1BTfMBaeXatLxBI9gBaerbd9wDYLwzYbItLDharqqtubsr 4rNCHbGeaGqiVCI8FfYJH8YrFfeuY=Hhbbf9v8qqaqFr0xc9pk0xbb a9q8WqFfeaY=biLkVcLq=JHqpepeea0=as0Fb9pgeaYRXxe9vr0=vr 0=vqpWqaaeaabiGaciaacaqabeaadaqaaqaaaOqaceaaKsqcfaOaeq iVd0MaamyBaaaa@39CC@ s-1).

The saturation threshold is larger for smaller distances (= 10000 for d = 100 pm) while it reduces as d increases (= 4000 for d = 1000 μm MathType@MTEF@5@5@+= feaagKart1ev2aaatCvAUfeBSjuyZL2yd9gzLbvyNv2CaerbuLwBLn hiov2DGi1BTfMBaeXatLxBI9gBaerbd9wDYLwzYbItLDharqqtubsr 4rNCHbGeaGqiVCI8FfYJH8YrFfeuY=Hhbbf9v8qqaqFr0xc9pk0xbb a9q8WqFfeaY=biLkVcLq=JHqpepeea0=as0Fb9pgeaYRXxe9vr0=vr 0=vqpWqaaeaabiGaciaacaqabeaadaqaaqaaaOqaceaaKsqcfaOaeq iVd0MaamyBaaaa@39CC@ and = 2500 for d = 10000 μm MathType@MTEF@5@5@+= feaagKart1ev2aaatCvAUfeBSjuyZL2yd9gzLbvyNv2CaerbuLwBLn hiov2DGi1BTfMBaeXatLxBI9gBaerbd9wDYLwzYbItLDharqqtubsr 4rNCHbGeaGqiVCI8FfYJH8YrFfeuY=Hhbbf9v8qqaqFr0xc9pk0xbb a9q8WqFfeaY=biLkVcLq=JHqpepeea0=as0Fb9pgeaYRXxe9vr0=vr 0=vqpWqaaeaabiGaciaacaqabeaadaqaaqaaaOqaceaaKsqcfaOaeq iVd0MaamyBaaaa@39CC@ ). This indicates that if distance between the region of injection and the tumor increases, and then increase in population does not impact the first passage time to reach the tumor microenvironment. This is because, larger population is effective for smaller d because even when a subset of the population reaches the tumor microenvironment, it can draw the rest of the population towards the tumor microenvironment. However, when the distance, d, is large, the entire population is still far away from the tumor microenvironment, thereby negating the effect of population.

When the directional efficiency becomes larger i.e., when p = 1 (see Figure 4), the saturation threshold decreases, e.g., = 2000 for d = 100 μm MathType@MTEF@5@5@+= feaagKart1ev2aaatCvAUfeBSjuyZL2yd9gzLbvyNv2CaerbuLwBLn hiov2DGi1BTfMBaeXatLxBI9gBaerbd9wDYLwzYbItLDharqqtubsr 4rNCHbGeaGqiVCI8FfYJH8YrFfeuY=Hhbbf9v8qqaqFr0xc9pk0xbb a9q8WqFfeaY=biLkVcLq=JHqpepeea0=as0Fb9pgeaYRXxe9vr0=vr 0=vqpWqaaeaabiGaciaacaqabeaadaqaaqaaaOqaceaaKsqcfaOaeq iVd0MaamyBaaaa@39CC@ (from Figure 4a) and = 1500 for d = 1000 (Figure 4b μm MathType@MTEF@5@5@+= feaagKart1ev2aaatCvAUfeBSjuyZL2yd9gzLbvyNv2CaerbuLwBLn hiov2DGi1BTfMBaeXatLxBI9gBaerbd9wDYLwzYbItLDharqqtubsr 4rNCHbGeaGqiVCI8FfYJH8YrFfeuY=Hhbbf9v8qqaqFr0xc9pk0xbb a9q8WqFfeaY=biLkVcLq=JHqpepeea0=as0Fb9pgeaYRXxe9vr0=vr 0=vqpWqaaeaabiGaciaacaqabeaadaqaaqaaaOqaceaaKsqcfaOaeq iVd0MaamyBaaaa@39CC@  and d = 10000 μm MathType@MTEF@5@5@+= feaagKart1ev2aaatCvAUfeBSjuyZL2yd9gzLbvyNv2CaerbuLwBLn hiov2DGi1BTfMBaeXatLxBI9gBaerbd9wDYLwzYbItLDharqqtubsr 4rNCHbGeaGqiVCI8FfYJH8YrFfeuY=Hhbbf9v8qqaqFr0xc9pk0xbb a9q8WqFfeaY=biLkVcLq=JHqpepeea0=as0Fb9pgeaYRXxe9vr0=vr 0=vqpWqaaeaabiGaciaacaqabeaadaqaaqaaaOqaceaaKsqcfaOaeq iVd0MaamyBaaaa@39CC@  (Figure 4c). This is because, when the rate of going towards the tumor and away from the tumor are same, even a smaller population of bacteria find their way to the tumor and a larger population is not necessarily required. When p = 1, it is observed that an order of increase in d results in an increase in the first passage time by a factor of 4 to 5 (increase from 8 hours for d = 100 μm MathType@MTEF@5@5@+= feaagKart1ev2aaatCvAUfeBSjuyZL2yd9gzLbvyNv2CaerbuLwBLn hiov2DGi1BTfMBaeXatLxBI9gBaerbd9wDYLwzYbItLDharqqtubsr 4rNCHbGeaGqiVCI8FfYJH8YrFfeuY=Hhbbf9v8qqaqFr0xc9pk0xbb a9q8WqFfeaY=biLkVcLq=JHqpepeea0=as0Fb9pgeaYRXxe9vr0=vr 0=vqpWqaaeaabiGaciaacaqabeaadaqaaqaaaOqaceaaKsqcfaOaeq iVd0MaamyBaaaa@39CC@  to 30 hours for d = 1000 μm MathType@MTEF@5@5@+= feaagKart1ev2aaatCvAUfeBSjuyZL2yd9gzLbvyNv2CaerbuLwBLn hiov2DGi1BTfMBaeXatLxBI9gBaerbd9wDYLwzYbItLDharqqtubsr 4rNCHbGeaGqiVCI8FfYJH8YrFfeuY=Hhbbf9v8qqaqFr0xc9pk0xbb a9q8WqFfeaY=biLkVcLq=JHqpepeea0=as0Fb9pgeaYRXxe9vr0=vr 0=vqpWqaaeaabiGaciaacaqabeaadaqaaqaaaOqaceaaKsqcfaOaeq iVd0MaamyBaaaa@39CC@  and to 150 hours for d = 10000 μm MathType@MTEF@5@5@+= feaagKart1ev2aaatCvAUfeBSjuyZL2yd9gzLbvyNv2CaerbuLwBLn hiov2DGi1BTfMBaeXatLxBI9gBaerbd9wDYLwzYbItLDharqqtubsr 4rNCHbGeaGqiVCI8FfYJH8YrFfeuY=Hhbbf9v8qqaqFr0xc9pk0xbb a9q8WqFfeaY=biLkVcLq=JHqpepeea0=as0Fb9pgeaYRXxe9vr0=vr 0=vqpWqaaeaabiGaciaacaqabeaadaqaaqaaaOqaceaaKsqcfaOaeq iVd0MaamyBaaaa@39CC@ for a motility of 25 pms-1). Since the directional efficiency, p, increases, the bacteria find their way to the tumor better than when p = even when the distance between the region of injection and the tumor increases. The numerical values we obtain match well with existing experimental results in28 that show that control bacteria reach the tumor growing edge in about 8 hours, in vitro, where the distance between the injection site of bacteria and tumor edge is about 150 μm MathType@MTEF@5@5@+= feaagKart1ev2aaatCvAUfeBSjuyZL2yd9gzLbvyNv2CaerbuLwBLn hiov2DGi1BTfMBaeXatLxBI9gBaerbd9wDYLwzYbItLDharqqtubsr 4rNCHbGeaGqiVCI8FfYJH8YrFfeuY=Hhbbf9v8qqaqFr0xc9pk0xbb a9q8WqFfeaY=biLkVcLq=JHqpepeea0=as0Fb9pgeaYRXxe9vr0=vr 0=vqpWqaaeaabiGaciaacaqabeaadaqaaqaaaOqaceaaKsqcfaOaeq iVd0MaamyBaaaa@39CC@ .

The saturation threshold decreases further then the directional efficiency, p = 2, as seen in Figure 5. The values are 1350 for d = 100 μm MathType@MTEF@5@5@+= feaagKart1ev2aaatCvAUfeBSjuyZL2yd9gzLbvyNv2CaerbuLwBLn hiov2DGi1BTfMBaeXatLxBI9gBaerbd9wDYLwzYbItLDharqqtubsr 4rNCHbGeaGqiVCI8FfYJH8YrFfeuY=Hhbbf9v8qqaqFr0xc9pk0xbb a9q8WqFfeaY=biLkVcLq=JHqpepeea0=as0Fb9pgeaYRXxe9vr0=vr 0=vqpWqaaeaabiGaciaacaqabeaadaqaaqaaaOqaceaaKsqcfaOaeq iVd0MaamyBaaaa@39CC@  from Figure 5a) and 1250 for d = 1000 μm MathType@MTEF@5@5@+= feaagKart1ev2aaatCvAUfeBSjuyZL2yd9gzLbvyNv2CaerbuLwBLn hiov2DGi1BTfMBaeXatLxBI9gBaerbd9wDYLwzYbItLDharqqtubsr 4rNCHbGeaGqiVCI8FfYJH8YrFfeuY=Hhbbf9v8qqaqFr0xc9pk0xbb a9q8WqFfeaY=biLkVcLq=JHqpepeea0=as0Fb9pgeaYRXxe9vr0=vr 0=vqpWqaaeaabiGaciaacaqabeaadaqaaqaaaOqaceaaKsqcfaOaeq iVd0MaamyBaaaa@39CC@  and d = 10000 μm MathType@MTEF@5@5@+= feaagKart1ev2aaatCvAUfeBSjuyZL2yd9gzLbvyNv2CaerbuLwBLn hiov2DGi1BTfMBaeXatLxBI9gBaerbd9wDYLwzYbItLDharqqtubsr 4rNCHbGeaGqiVCI8FfYJH8YrFfeuY=Hhbbf9v8qqaqFr0xc9pk0xbb a9q8WqFfeaY=biLkVcLq=JHqpepeea0=as0Fb9pgeaYRXxe9vr0=vr 0=vqpWqaaeaabiGaciaacaqabeaadaqaaqaaaOqaceaaKsqcfaOaeq iVd0MaamyBaaaa@39CC@ from Figure 5b and 5c. When p = 2, an order of increase in the distance from the region of injection to the tumor microenvironment results in an increase in the first passage time by a factor of 2 to 4 (increases from 2 hours for d = 100 μm MathType@MTEF@5@5@+= feaagKart1ev2aaatCvAUfeBSjuyZL2yd9gzLbvyNv2CaerbuLwBLn hiov2DGi1BTfMBaeXatLxBI9gBaerbd9wDYLwzYbItLDharqqtubsr 4rNCHbGeaGqiVCI8FfYJH8YrFfeuY=Hhbbf9v8qqaqFr0xc9pk0xbb a9q8WqFfeaY=biLkVcLq=JHqpepeea0=as0Fb9pgeaYRXxe9vr0=vr 0=vqpWqaaeaabiGaciaacaqabeaadaqaaqaaaOqaceaaKsqcfaOaeq iVd0MaamyBaaaa@39CC@  to 8 hours for d = 1000 μm MathType@MTEF@5@5@+= feaagKart1ev2aaatCvAUfeBSjuyZL2yd9gzLbvyNv2CaerbuLwBLn hiov2DGi1BTfMBaeXatLxBI9gBaerbd9wDYLwzYbItLDharqqtubsr 4rNCHbGeaGqiVCI8FfYJH8YrFfeuY=Hhbbf9v8qqaqFr0xc9pk0xbb a9q8WqFfeaY=biLkVcLq=JHqpepeea0=as0Fb9pgeaYRXxe9vr0=vr 0=vqpWqaaeaabiGaciaacaqabeaadaqaaqaaaOqaceaaKsqcfaOaeq iVd0MaamyBaaaa@39CC@  and 16 hours for d = 10000 μm MathType@MTEF@5@5@+= feaagKart1ev2aaatCvAUfeBSjuyZL2yd9gzLbvyNv2CaerbuLwBLn hiov2DGi1BTfMBaeXatLxBI9gBaerbd9wDYLwzYbItLDharqqtubsr 4rNCHbGeaGqiVCI8FfYJH8YrFfeuY=Hhbbf9v8qqaqFr0xc9pk0xbb a9q8WqFfeaY=biLkVcLq=JHqpepeea0=as0Fb9pgeaYRXxe9vr0=vr 0=vqpWqaaeaabiGaciaacaqabeaadaqaaqaaaOqaceaaKsqcfaOaeq iVd0MaamyBaaaa@39CC@  for a motility of 25 pm s-1. A directional efficiency of p = 2 > 1 implies that even for large distances, small population of bacteria are twice as fast towards the tumor microenvironment than away from the tumor microenvironment, thereby leading to a reduction in the factor of increase in the first passage time and a reduction in saturation threshold.

  • Figure 3 Average time taken to reach the tumor microenvironment from the region of injection ( U ˜ MathType@MTEF@5@5@+= feaagKart1ev2aaatCvAUfeBSjuyZL2yd9gzLbvyNv2CaerbuLwBLn hiov2DGi1BTfMBaeXatLxBI9gBaerbd9wDYLwzYbItLDharqqtubsr 4rNCHbGeaGqiVCI8FfYJH8YrFfeuY=Hhbbf9v8qqaqFr0xc9pk0xbb a9q8WqFfeaY=biLkVcLq=JHqpepeea0=as0Fb9pgeaYRXxe9vr0=vr 0=vqpWqaaeaabiGaciaacaqabeaadaqaaqaaaOqaaKqbakqadwfaga acaaaa@3762@ (m) in (8)). Here the directional efficiency, ρ   λ μ  =  1 2 MathType@MTEF@5@5@+= feaagKart1ev2aaatCvAUfeBSjuyZL2yd9gzLbvyNv2CaerbuLwBLn hiov2DGi1BTfMBaeXatLxBI9gBaerbd9wDYLwzYbItLDharqqtubsr 4rNCHbGeaGqiVCI8FfYJH8YrFfeuY=Hhbbf9v8qqaqFr0xc9pk0xbb a9q8WqFfeaY=biLkVcLq=JHqpepeea0=as0Fb9pgeaYRXxe9vr0=vr 0=vqpWqaaeaabiGaciaacaqabeaadaqaaqaaaOqaceaaKsqcfaOaeq yWdiheaaaaaaaaa8qacaGGGcGaeSixIaKaaiiOamaalaaabaGaeq4U dWgabaGaeqiVd0gaaiaacckacqGH9aqpcaGGGcWaaSaaaeaacaaIXa aabaGaaGOmaaaaaaa@44EA@ beyond a certain threshold, (called saturation threshold), the population size is ineffective.

  • Figure 4 Average time taken to reach the tumor microenvironment from the region o injection U ˜ ( m ) MathType@MTEF@5@5@+= feaagKart1ev2aaatCvAUfeBSjuyZL2yd9gzLbvyNv2CaerbuLwBLn hiov2DGi1BTfMBaeXatLxBI9gBaerbd9wDYLwzYbItLDharqqtubsr 4rNCHbGeaGqiVCI8FfYJH8YrFfeuY=Hhbbf9v8qqaqFr0xc9pk0xbb a9q8WqFfeaY=biLkVcLq=JHqpepeea0=as0Fb9pgeaYRXxe9vr0=vr 0=vqpWqaaeaabiGaciaacaqabeaadaqaaqaaaOqaaKqbakqadwfaga acamaabmaabaGaamyBaaGaayjkaiaawMcaaaaa@39DD@ in (8). Here the directional efficiency,   p   λ μ  =1 MathType@MTEF@5@5@+= feaagKart1ev2aaatCvAUfeBSjuyZL2yd9gzLbvyNv2CaerbuLwBLn hiov2DGi1BTfMBaeXatLxBI9gBaerbd9wDYLwzYbItLDharqqtubsr 4rNCHbGeaGqiVCI8FfYJH8YrFfeuY=Hhbbf9v8qqaqFr0xc9pk0xbb a9q8WqFfeaY=biLkVcLq=JHqpepeea0=as0Fb9pgeaYRXxe9vr0=vr 0=vqpWqaaeaabiGaciaacaqabeaadaqaaqaaaOqaaKqbakaadchaqa aaaaaaaaWdbiaacckacqWICjcqcaGGGcWaaSaaaeaacqaH7oaBaeaa cqaH8oqBaaGaaiiOaiabg2da9iaaigdaaaa@4184@  compared to p   λ μ  =1 MathType@MTEF@5@5@+= feaagKart1ev2aaatCvAUfeBSjuyZL2yd9gzLbvyNv2CaerbuLwBLn hiov2DGi1BTfMBaeXatLxBI9gBaerbd9wDYLwzYbItLDharqqtubsr 4rNCHbGeaGqiVCI8FfYJH8YrFfeuY=Hhbbf9v8qqaqFr0xc9pk0xbb a9q8WqFfeaY=biLkVcLq=JHqpepeea0=as0Fb9pgeaYRXxe9vr0=vr 0=vqpWqaaeaabiGaciaacaqabeaadaqaaqaaaOqaaKqbakaadchaqa aaaaaaaaWdbiaacckacqWICjcqcaGGGcWaaSaaaeaacqaH7oaBaeaa cqaH8oqBaaGaaiiOaiabg2da9iaaigdaaaa@4184@ the average time taken to reach the tumour microenvironment is one order of magnitude less. The population saturation threshold is smaller. An order of increase in d results in less than one order of increase in the first passage time (~ a factor of 5).

  • Figure 5 Average time taken to reach the tumour microenvironment from the region of injection U ˜ ( m ) MathType@MTEF@5@5@+= feaagKart1ev2aaatCvAUfeBSjuyZL2yd9gzLbvyNv2CaerbuLwBLn hiov2DGi1BTfMBaeXatLxBI9gBaerbd9wDYLwzYbItLDharqqtubsr 4rNCHbGeaGqiVCI8FfYJH8YrFfeuY=Hhbbf9v8qqaqFr0xc9pk0xbb a9q8WqFfeaY=biLkVcLq=JHqpepeea0=as0Fb9pgeaYRXxe9vr0=vr 0=vqpWqaaeaabiGaciaacaqabeaadaqaaqaaaOqaaKqbakqadwfaga acamaabmaabaGaamyBaaGaayjkaiaawMcaaaaa@39DD@ in (8). Here the directional efficiency, p   λ μ  =2 MathType@MTEF@5@5@+= feaagKart1ev2aaatCvAUfeBSjuyZL2yd9gzLbvyNv2CaerbuLwBLn hiov2DGi1BTfMBaeXatLxBI9gBaerbd9wDYLwzYbItLDharqqtubsr 4rNCHbGeaGqiVCI8FfYJH8YrFfeuY=Hhbbf9v8qqaqFr0xc9pk0xbb a9q8WqFfeaY=biLkVcLq=JHqpepeea0=as0Fb9pgeaYRXxe9vr0=vr 0=vqpWqaaeaabiGaciaacaqabeaadaqaaqaaaOqaaKqbakaadchaqa aaaaaaaaWdbiaacckacqWICjcqcaGGGcWaaSaaaeaacqaH7oaBaeaa cqaH8oqBaaGaaiiOaiabg2da9iaaikdaaaa@4185@ . The saturation threshold is smaller than the case with p=1 MathType@MTEF@5@5@+= feaagKart1ev2aaatCvAUfeBSjuyZL2yd9gzLbvyNv2CaerbuLwBLn hiov2DGi1BTfMBaeXatLxBI9gBaerbd9wDYLwzYbItLDharqqtubsr 4rNCHbGeaGqiVCI8FfYJH8YrFfeuY=Hhbbf9v8qqaqFr0xc9pk0xbb a9q8WqFfeaY=biLkVcLq=JHqpepeea0=as0Fb9pgeaYRXxe9vr0=vr 0=vqpWqaaeaabiGaciaacaqabeaadaqaaqaaaOqaaKqbacbaaaaaaa aapeGaamiCaiabg2da9iaaigdaaaa@394F@ an order of increase in d results in an increase by a factor of 2 in the first passage time. This indicates that the effect of p is more significant than the effect of distance and population size.

    Conclusion

    We presented a continuous time Markov model and a first passage time analysis to determine the time taken for bacteria to propagate towards tumor microenvironment. Key findings include:

    • There is a threshold population (called saturation threshold) beyond which, the time taken by the bacteria to reach the tumor microenvironment is independent of bacterial population.
    • Saturation threshold is larger when directional efficiency, p <1 and smaller when p >1.
    • For smaller directional efficiency, an increase in an order of magnitude in the distance between the region of injection and the tumor results in an increase by an order of magnitude in the time taken to reach the tumor microenvironment.
    • For larger directional efficiency, an order of increase in the distance between the region of injection and the tumor microenvironment results in an increase only by a factor of 2 to 5 in the time taken to reach the tumor microenvironment.
    • Directional efficiency of the bacteria plays the most significant role in its impact on the time taken to reach the tumor microenvironment. While the distance between the region of injection and the tumor microenvironment also has significant impact on the time taken to reach the tumor, the population of injected bacteria plays the least significant roles.

    Our analysis can be extended to heterogeneous bacteria by changing the transition rates in (1) to be unequal for different bacteria. Similarly, anisotropy can be taken into account by changing the rates in (1) for different directions. We are currently investigating the analysis in instances where distinct bacterial populations use quorum sensing signaling to enhance exchange of environmental information (e.g., as discussed in30).

    Acknowledgements

    None.

    Conflict of interest

    Authors declare there is no conflict of interest in publishing the article.

    References

    1. Brunton LL, Gilman. The Pharmacological Basis of Therapeutics. 12th ed. USA: McGraw–Hill Medical; 2011. 2021 p.
    2. Schroeder A, Sigal A, Turjeman K, et al. Using PEGylated nano–liposomes to target tissue invaded by a foreign body. J Drug Targeting. 2008;16(7):591–595.
    3. Maeda H, Matsumura Y. EPR effect based drug design and clinical outlook for enhanced cancer chemotherapy. Adv Drug Delivery Rev. 2011;63(3):129–130.
    4. Hrkach J, Von Hoff D, Mukkaram Ali M, et al. Preclinical development and clinical translation of a PSMA–targeted docetaxel nanoparticle with a differentiated pharmacological profile. Sci Transl Med. 2012;4(128):128 ra39.
    5. Wong C, Stylianopoulos T, Cui J, et al. Multistage nanoparticle delivery system for deep penetration into tumor tissue. Proc Natl Acad Sci U S A. 2011;108(6):2426–2431.
    6. Zoabi N, Golani–Armon A, Zinger A, et al. The evolution of tumor–targeted drug delivery: From the EPR effect to nano swimmers. Israel Journal of Chemistry. 2013;53(9–10):719–723.
    7. Kirpotin DB, Drummond DC, Shao Y, et al. Antibody targeting of long–circulating lipidic nanoparticles does not increase tumor localization but does increase internalization in animal models. Cancer Res. 2006;66(13):6732–6740.
    8. Han H, Davis ME. Single–antibody, targeted nanoparticle delivery of camptothecin. Mol Pharmacol. 2013;10(7):2558–2567.
    9. Chahibi Y, Pierobon M, Akyildiz IF. Pharmacokinetic modeling and biodistribution estimation through molecular communication paradigm. IEEE Trans on Biomed Engg. 2015;62(10):2410–2420.
    10. Chahibi Y, Akyildiz IF, Balasubramaniam S, et al. Molecular communication modeling of antibody drug delivery systems. IEEE Trans on Biomed Engg. 2015;62(7):1683–1695.
    11. Sutton JT, Haworth KJ, Pyne–Geithman G, et al. Ultrasound–mediated drug delivery for cardiovascular disease. Expert Opinion on Drug Delivery. 2013;10(5):573–592.
    12. Coussios CC, Roy RA. Applications of acoustics and cavitation to noninvasive therapy and drug delivery. Annu Rev Fluid Mech. 2008;40:395–420.
    13. Wang W1, Castro LA, Hoyos M, et al. Autonomous motion of metallic microrods propelled by ultrasound. ACS Nano. 2012;6(7):6122–6132.
    14. Buttinoni I, Volpe G, Kümmel F, et al. Active Brownian motion tunable by light. J Phys Condens Matter. 2012;24(28):284129.
    15. Ibele M1, Mallouk TE, Sen A. Schooling behavior of light–powered autonomous micromotors in water. Angew Chem Int Ed. 2009;48(18):3308–3312.
    16. Berg HC. Random Walks in Biology. USA: Pinceton Unviversity Press; 1993. p. 1–7.
    17. Berg HC, Purcell EM. Physics of chemoreception. Biophysics J. 1977;20(2):193–219.
    18. Coley WB. II. Contribution to the knowledge of Sarcoma. Ann Surg. 1891;14(3):199–220.
    19. Fialho AM, Bernardes N, Chakrabarty AM. Recent patents on live bacteria and their products as potential anticancer agents. Recent Pat Anti–Cancer Drug Discov. 2012;7(21):31–55.
    20. Forbes NS. Engineering the perfect (bacterial) cancer therapy. Nat Rev Cancer. 2010;10(11):785–794.
    21. Danino T, Lo J, Prindle A, et al. In vivo gene expression dynamics of tumor–targeted bacteria. ACS Synth Biol. 2012;1(10):465–470.
    22. Baban CK, Cronin M, O'Hanlon D, et al. Bacteria as vectors for gene therapy of cancer. Bioeng Bugs. 2010;1(6):385–394.
    23. Liu Y, Zhou M, Luo D, et al. Bacteria–mediated in vivo delivery of quantum dots into solid tumor. Biochem Biophys. Res. Commun. 2012;425(4):769–774.
    24. Danino T, Prindle A, Kwong GA, et al. Programmable probiotics for detection of cancer in urine. Sci Transl Med. 2015;7(289):289ra84.
    25. Heimann DM, Rosenberg SA. Continuous intravenous administration of live genetically modified salmonella typhimurium in patients with metastatic melanoma. J Immunother. 2003;26(2):179–180.
    26. Toso JF, Gill VJ, Hwu P, et al. Phase I study of the intravenous administration of attenuated salmonella typhimurium to patients with metastatic melanoma. J Clin Oncol. 2002;20(1):142–152.
    27. Nemunaitis J, Cunningham C, Senzer N, et al. Pilot trial of genetically modified, attenuated salmonella expressing the E. coli cytosine deaminase gene in refractory cancer patients. Cancer Gene Ther. 2003;10(10):737–744.
    28. Thornlow DN, Brackett EL, Gigas JM, et al. Persistent enhancement of bacterial motility increases tumor penetration. Biotechnol Bioeng. 2015;112(11):2397–2405.
    29. Cohen I, Golding I, Kozlovsky Y, et al. Continuous and discrete models for cooperation in complex bacterial colonies. Fractals. 1999;7(3):235–247.
    30. Okaie Y, Nakano T, Hara T, et al. Cooperative target tracking by a mobile bionanosensor network. IEEE Trans Nanobioscience. 2014;3(3):267–277.
    31. Nakano T, Kobayashi S, Suda T, et al. Externally controllable molecular communication systems for pattern formation. USA: ACM; 2014.
    32. Externally controllable molecular communication. IEEE J Sel Areas Commun. 2014;32(12):2417–2431.
    33. Kasinskas RW, Forbes NS. Salmonella typhimurium specifically chemotax and proliferate in heterogeneous tumor tissue in vitro. Biotechnology and Bioengineering. 2006;94(4):710–721.
    34. Charteris N, Khain E. Modeling chemotaxis of adhesive cells: Stochastic lattice approach and continuum description. New J Physics. 2014;16(2):1–12.
    35. Lavrentovich MO, Nelson DR. Survival probabilities at spherical frontiers. Theor Popul Biol. 2015;102:26–39.
    36. Deng B. Performance analysis of multiple simultaneous communications in bacterial nanonetworks. Finland: Master of Science Dissertation, Tampere University of Technology; 2015. p. 1–52.
    37. Wei G, Bogdan P, Marculescu R. Bumpy rides: Modeling the dynamics of chemotactic interacting bacteria. IEEE J Sel Areas Commun. 2013;30(12):879–890.
    38. Gillespie D. Exact stochastic simulation of coupled chemical reactions. J Phy Chem. 1977;81(5):2340–2361.
    39. Kleinrock L. Queuing Systems. USA: Wiley; 1975.
    40. Anand S, Chandramouli R, Subbalakshmi KP. Cost of collaborative vs individual effort in social networks. SIAM; 2011. p. 1–11.
    Creative Commons Attribution License

    ©2016 Anand, et al. This is an open access article distributed under the terms of the, which permits unrestricted use, distribution, and build upon your work non-commercially.