MOJ
eISSN: 2374-6920


Research Article Volume 4 Issue 4
Department of Biotechnology and Bioinformatics, Kuvempu University, India
Correspondence: Manjunatha Hanumanthappa, Department of Biotechnology and Bioinformatics, Kuvempu University, Shankaraghatta, Shivamogga, Karnataka, India
Received: September 20, 2016 | Published: November 23, 2016
Citation: Gollapalli P, Hanumanthappa M. Conformational flexibility and dynamic properties in allosteric regulation of m. tuberculosis pyruvate kinase. MOJ Proteomics Bioinform. 2016;4(4):269-283. DOI: 10.15406/mojpb.2016.04.00128
Pyruvate kinase (Pyk) which is critical for the regulation of glycolysis; has its involvement in fatty acid and amino acid metabolism. The allosteric activity of the pyruvate kinase is of paramount importance for the cell, given the central role in the cellular metabolism. The transition between the inactive T-state and active R-state of M. tuberculosis Pyk is accomplished with large amount of conformational changes that occurs due to flexibility of the domains involved upon substrate binding. The structure of M. tuberculosis pyruvate kinase was first modelled by homology modelling, starting with the X-ray structure of homologous template. Then the dynamical and conformational properties of the allosteric enzyme were explored using normal mode analysis. The dynamic behaviours are observed, which are characteristic of the enzyme domain architecture. The functional properties of the allosteric mechanism occurring in Pyk were monitored by considering the structural dynamic features. These studies have shown that the mechanism can be clearly described between open and closed state of enzyme with low-frequency modes (7, 8, 9, 10 and 11). It is observed in mode 7, 8 and 11 the movement associated involving tilt and twist rotation. Understanding this allosteric regulatory mechanism and its disruption may provide new and specific drug target which avoids the problem of development of selective inhibitor against similar active sites.
Keywords: homology modelling, normal mode analysis, pyruvate kinase (Pyk)
TB, tuberculosis; PEP, phosphoenol pyruvate; NJ, neighbour-joining; Pyk, pyruvate kinase; GRAVY, grand average hydropathy
Since several decades, research has been carried on to control tuberculosis to develop a potentially efficacious drug. M. tuberculosis, the causative organism of tuberculosis (TB) has emerged as a multi-drug resistant strain. The understanding of the host-pathogen interaction and contribution of a pathogen in the development of disease is a prerequisite thing. The information and knowledge about how M. tuberculosis enters the host cell and pathogens circumvent with as hostile mechanism for its survival to cause the disease is currently limited. The present knowledge regarding this interactive mechanism of bacteria is inadequate to develop new drugs for effective control of TB. An insight view of the molecular system of M. tuberculosis pathogenesis may provide a new direction to unravel various mechanisms that the pathogen adopted to survive in the host cell (macrophages) successfully. By the implementation of computational approaches for studying protein-protein interactions have favoured in identifying new therapeutic drug targets. Our research has focussed on the construction of PPI network by surveying the genes/proteins (genes) which play a crucial role during the course of infection, survival of pathogen in host, and its growth. The analysis of the PPI network provided a bottleneck protein, suggesting pyruvate kinase (results not shown).
Pyruvate kinase is historically known to catalyze the last step of glycolysis using phosphoenol pyruvate (PEP) and ADP as the substrate to produce pyruvate and ATP.1 Pyk is rate limiting enzyme in glycolysis, which plays an important role in cell metabolism. Generally, the enzyme catalyzing the third irreversible step in glycolysis controls the outflow from this pathway. The products formed such as pyruvate and ATP, a central metabolic intermediate that can be oxidized further or used as building blocks. Several isozymic forms of pyruvate kinase encodes by different genes are isolated from different prokaryotes and eukaryotes.2 In almost all organisms the enzyme shows allosteric properties in binding the substrate PEP. In mammals the L and M forms of pyruvate kinase have many properties in common, where both bind phosphoenol pyruvate cooperatively. Fructose 1, 6-bisphosphate, the product of the preceding irreversible steps in glycolysis activates both isozymes to enable them to keep pace with the oncoming high flux of intermediate. ATP allosterically inhibits both the forms of pyruvate kinase to stop glycolysis when the energy charge is high.3–7 The physiological reaction of pyruvate kinase is proceeded by two steps, wherein first step the phosphoryl transfer from phosphoenol pyruvate to give ATP and the enolate of pyruvate and followed by second step where the keto form of three carbon substrate is produced by the addition of the proton to the 2 Si face of the enolate of pyruvate.8,9 It was also evidenced that specific property of pyruvate kinase to catalyze side reactions other than the glycolysis such as decarboxylation of oxaloacetate,10 the enolization of pyruvate,11 an ATP- and biocarbonate dependent ATPase, and ATP-dependent phosphorylation of α-hydroxy or α-thio carboxylate and an ATP- and bicarbonate dependent phosphorylation of fluoride and of hydroxylamine. The bacterial pyruvate kinase, which is allosterically activated by fructose 1, 6-bisphosphate and inactivated by ATP was revealed in E. coli. Each domain of the bacterial pyruvate kinase in the T-state has essentially the same structure which is found in M1-R-state, although the relative orientation of the domain differs.11–13
Due to the unavailability of the experimental three-dimensional structure of the M. tuberculosis pyruvate kinase, which is a constraint for understanding the molecular mechanism of allosteric regulation of the enzyme and other functional properties related for survival of the pathogen in the host cell. The homology modelling approaches provide a novel way for obtaining structural information of pyruvate kinase. However, the crystal structure of pyk is available from other organisms, which can be used as template to model the 3D structure of the target protein. A detailed analysis of the structural organization and conformational flexibility is achieved by the normal mode analysis. From the earlier work on PPI interaction analysis, we identified pyruvate kinase as a hub protein in the network. These studies shows the activity of the pyk other than the glycolysis in the pathogen and also play crucial role in the central metabolism of the Mycobacterium tuberculosis, leading to act as one of the important protein during the infection, survival of pathogen and growth in the host cell.
Normal mode analysis provides an alternative of molecular dynamic simulations for studying collective motions of the macromolecule, which is based on the diagonalization of the second derivative of the weighted energy matrix.14–16 The global motion of the system is the expressed as a superposition of the collective variable, called the vibrational normal modes. High frequency modes are highly localized motions, of a few side-chains, of pairs of bonded atoms, etc., while the lowest frequency ones are collective motions of large groups of atoms usually whole structural domains. These later modes mainly depend on the shape of the molecule as shown, for instance by Bahar and collaborators’ in a study of four structurally similar but functionally different proteins.17 Moreover, it was found that a handful of such collective motions, corresponding to a small subset of lowest-frequency modes often compare well with conformational change has a highly connective character. Thus, normal mode analysis seems to the best suited theoretical methods for studying collective motions in proteins, in particular when a large modification of the structure is expected. Classical normal mode analysis is limited by the energy minimization steps which can be very large for complex macromolecules, and by the diagonalization of the 3N dimensions Hessian matrix, where 3N is the number of degrees of freedom of the system. It has been approximated that low-frequency motions are well described when amino acid residues are assumed to behave like rigid bodies.18–20
Hence, the study of the protein (macromolecule) by normal mode analysis provide a description of the domain motions, as described by the low-frequency normal modes calculated by classical methods and provides a good information regarding the backbone protein motions of the biomolecules, as for as the low frequency modes are concerned. Thus, providing the new insight about the flexible and rigid parts of the protein. This could also anticipate the preferential conformational changes occurring in the pyruvate kinase during the allosteric mechanism in M. tuberculosis.
Sequence retrieval and domain analysis
The reviewed amino acid sequence encoded by pyruvate kinase enzyme (UniProt ID: P9WKE5) was retrieved from the UniProt database (www.uniprot.in). The InterProScan tool (http://www.ebi.ac.uk/Tools/pfo/inproscan/)21 was used to deduce the protein family, super family, and domain arrangement within the protein. Conserved domains of the pyruvate kinase (Pyk) protein were explored by using the databases: Pfam (http://pfam.janelia.org), SMART (http://smart.embl-heidelberg.del)22,23 and CDD (http://www.ncbi.nlm.nih.gov/structure/cdd/cdd.shtml).
Molecular evolutionary analysis
To search for homologous sequence of M. tuberculosis pyruvate kinase (Pyk), BLASTP24 was carried out against the non-redundant (nr) database of NCBI. Sequence selected from sequence similarity search (cut-of 90% identity), including the query sequence, were analyzed using Clustal X.25 The molecular evolutionary genetic tree through Neighbour-Joining (NJ) method26 was constructed in MEGA5.0.27 Poisson correction was used to calculate protein distances using gap opening penalty at 10, gap extension penalty of 0.1, and gap separation distance of 4, employing Blossum weight matrix with no residue specific or hydrophilic penalties.28 The robustness of the constructed phylogenetic tree was tested by bootstrap analysis using 1000 iterations.
Primary structure analysis
To have a broader chemistry on pyruvate kinase, the primary structure of the protein was studied using ProtParam tool (http://expasy.org/cgi-bin/protparam)29 of ExPASy proteomic server. Various physic-chemical parameters such as molecular weight, isoelectric point, instability index, aliphatic index and grand average hydropathy (GRAVY) were computed. PSIPRED server30 was used for the prediction of secondary structure of pyruvate kinase enzyme.
Homology modelling of M. tuberculosis pyruvate kinase
Template selection and model building: The 472 amino acids residue long pyruvate kinase protein of M. tuberculosis was subjected to BLASTP analysis against PDB (www.rcsb.org) to identify suitable template for comparative protein structure modelling. Further, the BLASTP results were subjected to I-TASSER server (www.zhrnglab.ccmb.ed.umich.edu/I-TASSER/) to conform for the best template for modelling of pyk protein.31 The selectivity and accuracy of the selected template was ensured by using GeneSilico MetaServer (http://genesilico.pl/meta2).32 The sever uses consensus approach to predict the template for model building of protein. By the above methods of prediction, a total of 10 templates were selected see Table 1, out of which, we identified 2E28 (A-chain) is the most appropriate template for pyruvate kinase protein of M. tuberculosis model building, having the highest sequence identity, query coverage and least E-value by using the parameters of expected threshold -10, matrix: Blossum 62, gap costs, filtered low complexity regions.
Template (PDB) |
Chain |
Total Score |
Query Coverage (%) |
E-value |
% of Identity |
Resolution (Å) |
Reference |
2E28 |
A |
364 |
99 |
8e-119 |
42 |
2.40 |
Suzuki K et al.57 |
4YNG |
A |
333 |
98 |
2e-108 |
40 |
2.28 |
Donovan KA et al.58 |
1E0U |
A |
331 |
98 |
2e-107 |
40 |
2.10 |
Recacha R et al.59 |
1PKY |
A |
331 |
98 |
2e-107 |
40 |
2.50 |
Mathevi A et al.12 |
1E0T |
A |
328 |
98 |
3e-106 |
40 |
- |
Crump MP et al.60 |
3T05 |
A |
360 |
99 |
4e-117 |
39 |
3.05 |
Zoraghi R et al.61 |
3E0V |
A |
295 |
87 |
1e-92 |
39 |
3.30 |
Tulloch LB et al.62 |
3QV9 |
A |
287 |
86 |
3e-90 |
39 |
2.10 |
Morgan HP et al.63 |
4KRZ |
A |
287 |
86 |
6e-90 |
39 |
2.50 |
Morgan HP et al.64 |
4HYV |
A |
282 |
86 |
3e-88 |
39 |
2.30 |
Zhong W et al.65 |
Table 1 Template selected for homology model building of M. tuberculosis pyruvate kinase from BLAST search against PDB.
As comparative modelling relies on the sequence alignment between target and the template sequence whose structure has been experimentally determined, a target-template alignment was performed using Clustal X. Based on the target-template alignment, 20 different 3D models of Pyk were generated by EASY modeller33 that employs extraction of spatial restraints from two sources- homology derived and CHARMm force field derived.34 The generated theoretical structure models of M. tuberculosis pyruvate kinase were ranked based on their normalized discrete optimized protein energy (DOPE) scores. The model with the lowest DOPE score was considered as the best model, which was further subjected for structural refinement and validation.
Quality assessment of generated model: The quality of Pyruvate Kinase model was evolved by a number of tools to test the internal consistency and reliability of the model. For the analysis of stereochemistry of protein model built, quality of the model and its compatibility were carried out by using Structural Analysis and Verification Server (SAVES) (http://nihserver.nbi.ucla.edu/SAVES/). Procheck35 analysis, which quantifies the residues in available zone of Ramachandran plot, was used to assess the stereo chemistry quality of the model. ERRAT36 tool, which finds the overall quality factor of the proteins, was used to check the statistics of non-bonded interactions between different atoms types. Similarly to determine the compatibility of the atomic model (3D) with its own amino acid sequence (1D), the VERIFY-3D37 program was used.
Further WHATIF program (http://swift.cmbi.ru.nl/whatif/)38 was used to detect the standard bond length and bond angle of the M. tuberculosis pyruvate kinase model. The quality validation of the 3D model was performed by Mol Probity web server (http://molprobity.bioche.duke.edu).39 This provides details of atomic contact analysis of any stereo problems within the molecules, as well as updated dihedral-angle diagnostics. Subsequently, the refinement and validation of the modelled structure was carried to check the native protein folding energy of the model by comparing the energy of the model with the potential mean force derived from a large set of known protein structure, which was performed by employing ProSA tool.40 The pair wise 3D structural superimposition of the proposed model of M. tuberculosis pyruvate kinase protein with its closest structural homologue was carried out using a iPBA web server (http://www.dsimb.inserm.fr/dsimb_tools/ipba/) that compute the root mean square deviation (RMSD) between the Cα-atoms and all atoms of the homology model and template. Last but not least, the conservedness in the secondary structure topology of the refined model and the template was detected by using MATRAS web server (http://strcomp.protein.osaka-u.ac.p/matras/) to understand and gain better knowledge of the M. tuberculosis pyruvate kinase model.41
Normal mode analysis
Normal mode analysis (NMA) is one of the major simulation techniques used to probe the large-scale, shape-changing motions of the bio molecules.14,16,17,34 For standard NMA, one needs a set of coordinates, a force field and software to perform the calculation. The structural information was stored in the PDB file. Several software tools are available to perform NMA, which are normally used to interpret the file to determine the correct energy function using the selected force field. Flexibility of the structure of a protein is an essential property and is crucial for the substrate binding for an enzyme. The normal modes are straightforward to calculate, particularly in the simplified framework of the elastic network model (ENMs) and provide a basis of orthogonal vectors to drive conformational transitions with a few degrees of freedom as possible; amphasizing the large amplitude and collective movements if one focus on low-frequency modes.42-44
Normal mode theory: The small displacement of atomic coordinates in the vicinity of a stationary point of the potential energy surface are given by Goldstein45
Where is the mass of the corresponding atom, the coordinate of the normal mode and the corresponding frequency , and are obtained as following: is the eigenvalve of the 3N × 3N mass weighted second derivatives of the potential energy matrix (Hessian matrix), and is the coordinate of eigenvector . and the amplitude and phase of mode , respectively, and determined once the coordinates and the velocities of the system at t=0 are known.
Simplified potential: Within the frame of the approach proposed by Tirion the standard detailed potential energy function is replaced by,
Where dij is the distance between atom i and j, being the distance between these two atoms in the given 3D model of the structure that was build. the strength of the potential is a phenomenological constant assured to be the same for all interacting pairs. Note that this energy function was designed such a way that for any chosen configuration of any system the total potential energy is a minimum of the function.
For the equation as mentioned above, the sum is restricted to atom pairs separated by less than which is an arbitrary cut-off parameter. In all normal mode calculations hereafter, a cut-off of has been used and as proposed by Bahar et al.43 only the Cα atoms have been taken into account. Such a model is adequate for studying backbone motions which in turn is sufficient for characterizing low-frequency normal modes of large proteins.
Comparison with experiment method for large scale motions of protein
Distance fluctuation: The map for distance fluctuation between residue and measures the relative movements between residues in the mode k.46,47 In these maps, rigid and flexible blocks of amino acid residues can be identified, as well as their relative movements. The blocks of amino acid residues which behave as rigid bodies during the motion appear in white in the map, whereas flexible segments are filled with black/gray. A block symbol indicates that distance between two Cα atoms increases significantly and a gray symbol that is decreased.
Overlap: The overlap between the conformational change observed by modeller, and the jth normal mode of the protein is a measure of the similarity between the direction of the conformational change and the one given by model . It is equated by Marques and Sanejouand as,
Where being the atomic coordinates of the protein in the ‘open’ and ‘closed’ structure, respectively. A value of one for the overlap means that the direction given by normal mode of is identical with . Practically the is calculated after both conformations of the proteins were superimposed using standard fitting procedures. That pairs of conformation are referred to as ‘open’ or ‘closed’ because many conformational changes considered in the enzyme where an active pocket site is being closed as a consequences of substrate binding.
Degree of collectivity: The degree of collectivity measures that collective protein motion in the mode k considered, i.e., the number of atoms which are significantly affected in the normal mode. The value of has been obtained by equating as given below,
Where is the amplitude of the displacement of atom i in the mode k and α is a normalization factor chosen such as . The conformational change in maximally collective for a value of one.48
Correlation: The correlation coefficient measures the similarity of the patterns of the atomic displacements in the conformational change and in mode . It is obtained as follows:
Where and are the amplitude of the displacement of atom in the mode and in the conformational change respectively, and being the corresponding average displacements, while and are the corresponding root mean square values. A value of one for means the both patterns of atomic displacements.
Sequence analysis and domain prediction
The published complete primary amino acid sequence of the target protein, pyruvate kinase (472 amino acids) of M. tuberculosis was downloaded from UniProt database. The domain search performed by SMART revealed the Pyk possesses 3 domains such as, barrel domain and alpha/beta domain. Domain prediction by CDD and Pfam also suggested the same domains and fortify the predicted domains for further analysis. This domain is a small beta-barrel domain nested within a large TIM barrel. The active site is found in a cleft between the two domains. The alpha/beta (α/β) domains are constituted of a central parallel or mixed β-sheets surrounded by α-helices. Being the large allosteric enzyme, pyruvate kinase is α/β structure that binds and transport metabolism. In these domains, the binding cervices are formed by loop regions, which participate in binding and catalytic action rather than their contribution to the structural stability.
Molecular evolutionary analysis
Blast search was performed against non-redundant (nr) database for comparative sequence analysis; which revealed that pyruvate kinase of M. tuberculosis is closely related to Pyrobaculum aeroplhilum with a maximum evolutionary relation.
Sequence producing significant alignment with the query protein pyk were selected on the query coverage (90%), percentage (cut-off >95%) of the identity and E-value (cut-of 0). The pyruvate kinase from different species is highly conserved throughout the evolutionary. Another program MEGA 5.0 was used for phylogenetic analysis of M. tuberculosis pyk using neighbour-joining method is compared with other pyk from different organisms. The cluster representing species diversity with strong bootstrap values of 0.0596 within their nodes. The final un-rooted phylogenetic tree for the pyk comprising clusters was represented in the Figure 1 (give name of species considered) with a overall mean distance of 0.056 (Poisson correlation). Even though the protein from different species show high sequence similarity, pyk from the cluster considered shows that pyruvate kinase is conserved sites of 376/476.
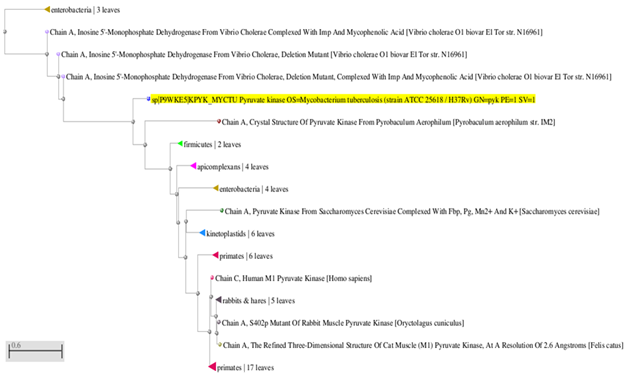
Figure 1 Neighbor-Joining tree inferred from M. tuberculosis Pyruvate kinase and its related sequences in MEGA 6.0. The percentage of boot strap value obtained from the sampling. Bar, 0.6 shows the substitution per nucleotide position among sequences.

Figure 2 The Plot of DOPE score profile showing regions of relatively high energy for the long active site loop between residues 250 to 300 and long helices at the C-terminal end.
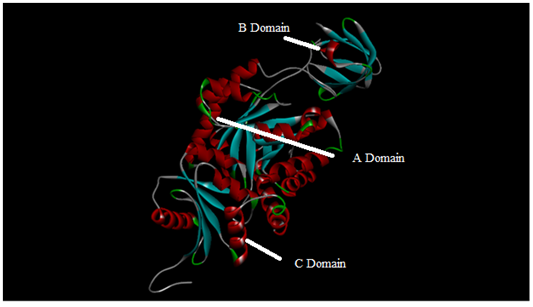
Figure 3 Three dimensional structure model of M. tuberculosis pyruvate kinase from MODELLER 9 and the above image was obtained using Discovery studio that shows the different domains in the model.
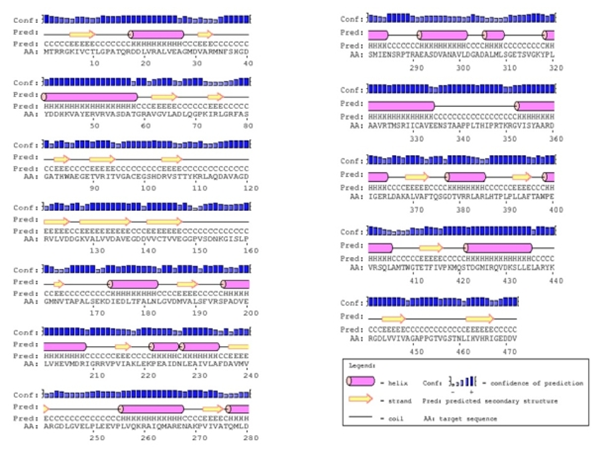
Figure 4a The predicted secondary structure of the modeled pyruvate kinase from M. tuberculosis . These secondary structures were determined by PSIPRED server. The codes indicated are H=alpha helix, C=coils, E=extended strands (participates in β-ladder).
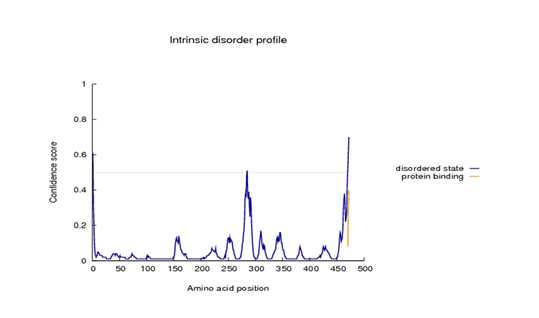
Figure 4b The graph represents the DISOPRED3 disorder confidence level against the sequence positions as a solid blue line. The grey dashed horizontal line marks the threshold above which amino acids are regarded as a disordered. The orange line shows that the confidence of disordered residues being involved in protein-protein interactions.
Analysis of primary structure of tuberculosis Pyk
The ProtParam tool which was used for primary structure analysis of a protein computed molecular weight of 50.69KDal. The isoelectric point (pI) is the pH at which the surface of protein is covered with charge but net charge of the protein is zero, which make the protein stable and compact. For the protein understudy, i.e., pyruvate kinase had a pI value of 5.44 indicating its acidic nature. In a polypeptide chain of pyk consisting 472 amino acids, the predicted results show 65% (Asp+Glu) total number of negatively charged residues and 54% (Arg+Lys) of positively charged residues. The aliphatic index (AI) is defined as the relative volume of a protein occupied by aliphatic side chain such as alanine, valine isoleucine and leucine. It is considered as a positive factor for the increase of thermal stability of the globular proteins.49 Aliphatic index of M. tuberculosis pyruvate kinase was very high of about 100.38 which indicate that the protein may be stable for a wide range of temperature.
Further the instability index of the protein was calculated as 33.11. Basically, the instability index provide an estimate of the stability of protein in test tube and a protein whose instability index is smaller than 40 is predicted as stable (a protein above 40 predicts that the protein may be unstable). Hence, the above obtained value in comparison with this parameter suggests the stable nature of pyruvate kinase. The estimated half-life of the pyk is predicted as >10 hours (E. coli, in vivo). The N-terminal of the sequence considered as metionine. The GRAVY index was very low of 0.018 which is grand average in hydrophathicity indicating protein affinity for water.
Homology modelling of pyruvate kinase of Mycobacterium tuberculosis
Comparative modelling of protein is considered as one of the most appropriate and accurate method for three-dimensional structure building, which provide suitable models for a wide spectrum of applications.50 It is usually a method of choice when a clear relationship of homology between the sequence of target protein and at least one known structure is found. A high level of sequence identity usually ensures accurate alignment between the target structure and template structure. BLAST sequence similarity search of M. tuberculosis pyruvate kinase (pyk) against protein date bank (PDB) revealed several hits, 10 structures were selected based on high-level identity (above 30%) with the target sequence, as shown in Table 1.
In the subsequent studies the crystal structure of 2E28 chain A, out of 10 selected structures was used as a template for modelling pyruvate kinase (pyk). The sequence identity between 2E28 and pyk is 42% which suggest 2E28 as a good template for modelling. Coordination from the reference template protein to the structurally conserved regions, structurally variable regions, N- and C-terminal were assigned to the target sequence based on the satisfaction of spatial restraints. From the GeneSilico Metaserver, it was confirmed that the Chain A of Bacillus steoratter pyruvate kinase (PDB ID: 2E28) with a resolution of 2.4Å as the best template for comparative modelling. All the side chains of the modelling proteins were set by rotamers. The stereochemical restraints such as bond length and bond angle preferences were obtained from the CHARMM molecular mechanism force field.
An optimal sequence alignment is essential to the success of homology modelling, as it was supported by the identity of 42%. Based on the target-template alignment, Modeller 9.11 generated 20 models, the model with the lowest DOPE score was considered to be thermodynamically stable (Figure 2). This structure was further subjected for refinement and validation. Further, secondary structure elements were analyzed for assessing the conservedness between the M. tuberculosis pyruvate kinase (target) and 2E28 (template). The final energy of the minimized structure was 3322.38 Kcal/mol, compactness of 0.134122, native energy (pairs) is -507.377, and native energy (surface) is -13.748 provided Z-score (combined) is -12.125. This comparison provided that N-terminal domain and C-terminal domain was comprised of E. coil that shared strong homology across the entire length. The final stable structure of pyruvate kinase (pyk) obtained (Figure 3), which reveals that protein possesses 77.3% α-helices, 61.2% β-sheets and 11.2% turns (Figure 4a). Disordered regions are identified by DISOPRED 3, as shown in the Figure 4b the residues from C-terminal are found to be highly disordered. Those residues showing disordered feature (as calculated by DISOPRED 2) are subjected to FFPret 2 to calculate the position dependent amino acid features which are represented as maps (results not shown).
Assessment of model quality and validation
Validation of the pyruvate kinase model was carried out using ramachandran plot (Figure 5) calculation computed with the PROCHECK program. The Φ and Ψ distributions of the plot were shown in the Figure. The ramachandran plot for the modelled structure shows’ that 94.47% (444/472) of all residues were in favoured (98%) regions and 97.87% (460/472) of all the residues were in allowed (>99.8%) regions and no residues were found in the generously allowed and disallowed regions. The quality of our model for pyruvate kinase was further supported by a high ERRAT score of 92 (a value of ~ 95% shows high resolution), which indicate acceptable protein environment.36 Regions of the structure that can be rejected as the 95% confidence level are yellow, 5% of a good protein structure is expected to have an error value above this level. Regions that can be rejected at the 99% level are shown in red (Figure 6). According to the analysis of the ERRAT the final model is significantly improved relative to the initial models with a overall quality factor of 76.458.51
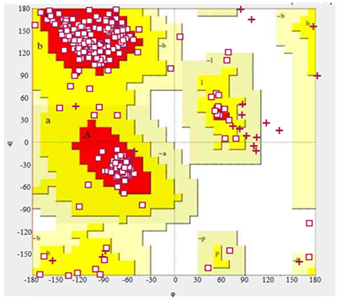
Figure 5 Ramachandran plot of the pyruvate kinase model of M. tuberculosis (generated with PROCHECK program).
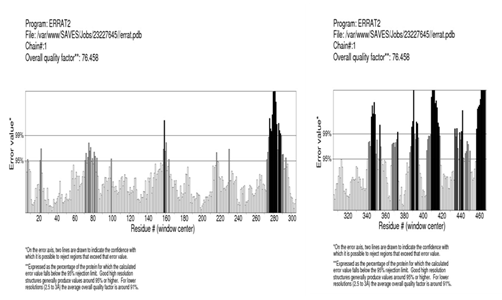
Figure 6 Plot obtained by ERRAT verification tool for the final modeled pyruvate kinase. Regions of the structure that can be rejected at the 95% confidence level, 5% of the good protein structure were expected to have an error value above this level. Regions that can be rejected at 95% level are drawn with two lines.
The coarse packing quality, anomalous bond length, planarity, packing quality and the collision with symmetry axis, distribution of omega angle, proline puckering of the homology modelled protein (pyk) was analyzed by WHATIF server and reflected its acceptance of good quality. All the Structure RMS Z-score values are shown in Table 2 which gives overall agreement with model generated.52,53
Property of Protein Model |
RMS Z-Score (Should Be Closed to 1.0) |
Bond length |
0.987 |
Bond angle |
1.235 |
Omega angle restraint |
0.675 (tight) |
Side-chain planarity |
0.352 (tight) |
Improper dihedral distribution |
0.862 |
Inside/Outside distribution |
1.041 |
Table 2 The table mostly gives an impression of how well the model conforms to common refinement constraint values. The quality of the structure as compared with current reliable structures. This summary is most useful for biologists seeking a good structure to use for modeling calculations
The VERIFT-3D results of the pyruvate kinase model showed 86.65% of the amino acids have been an average 3D-1D score of >0.2; which shows that modelled protein possess the verification where at least 80% of the amino acids have scored >=0.2 in the 3D/1D profile. The PROVE program was used to measure a quality magnitude of the value irregularities in terms of the Z-score root mean square deviation of the model (Figure 7). It gives the statistics of nonbonded interactions between different atom types. The Z-score average and Z-score RMS value of the model was 0.62 and 24.63 respectively (Average Z-score of atoms in well resolved structures tend to be between -0.10 and 0.10 and Z-score RMS of atoms in well resolved structures tend to be less than 1.0).

Figure 7 Analysis of entire modeled Pyruvate kinase structure by PROVE program. Absolute Z-score of individual atoms are used to identify problems in specific regions within the model protein and Z-score measures the magnitude of the value irregularities in the structure.
MolProbity server, which was used for analysis of atom contacts and geometry of the model, have revealed 0% of residues had bad bonds (goal 0%), 1.12% of residues had bad bond angles (goal< 0.1%) and 0.69% of the Cβ deviations were >0.25A0 (goal 0%) and 2.37% poor rotamers (goal<1%). Overall 95.5% of all residues were in favoured (94%) regions and 97.9% of all the residues were in allowed regions. The residues GLU-87, CYS-98, PRO-160, LEU-169, VAL-199, ALA-275, LEU-279, GLY-352, PRO-453 and HIS-468 are outline of phi and psi angles. All these properties of protein geometry confirmed the reliability of the pyruvate kinase model. MolProbity Ramachandran analysis was all in good agreement with the model built as shown in Figure 8.
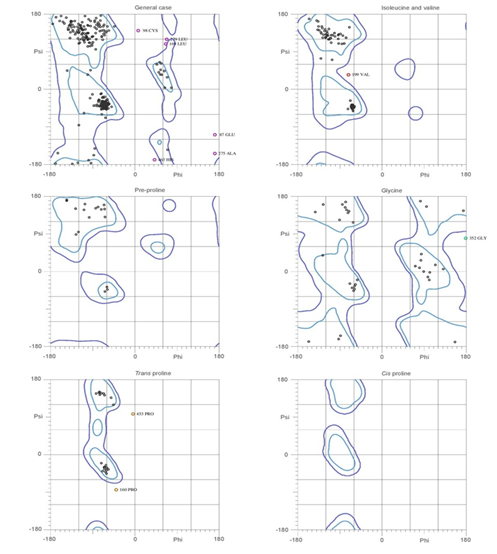
Figure 8 Ramachandran plot analysis predicted by MolProbity server. The plots were analyzed by atom contacts and geometry of the modeled pyruvate kinase.

Figure 9 Plot generated by Protein Structure Analysis (ProSA) of the homology modeled pyruvate kinase. Overall quality of model shows a Z-score of -10.27 (native conformation to its template)
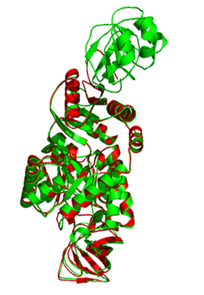
Figure 10 Pair wise secondary structure alignment of pyruvate kinase model with its template 2E28 by iPBA web server. The homology modeled protein pyruvate kinase is colored red and the template 2E28 is colored in green.
Further, ProSA program was used to analyze the energy profile of the model and Z-score value (a measure of model quality as it measures the total energy of the system). The interaction energy per residue was calculated by using a distance-based pair potential. The analyzed Z-score is -10.27 for the model protein pyruvate kinase as shown in Figure 9, where the negative ProSA energy reflects reliability of the model of good quality.
The quality of the model was also assessed b comparing the predicted structure to the experimentally determined structure by superimposition and atoms RMSD assessment (using iPBA program). Consequently, superimposition of the A chain of the template with the homology model was executed by combinatorial extension of polypeptides. The RMSD value of Cα trace between the modelled pyruvate kinase structure and template (2E28) was 0.92Å, which indicates the generated model is reasonably of good quality and similar to template as shown in Figure 10.
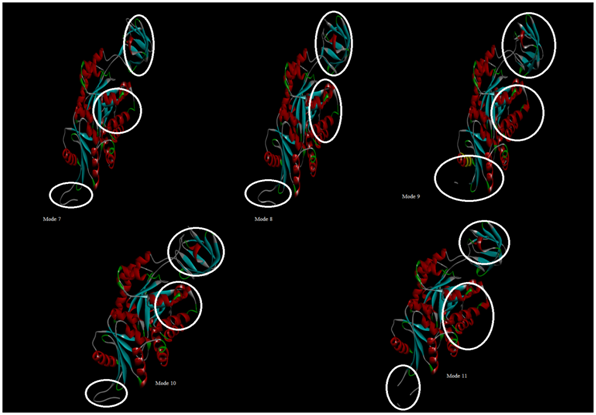
Figure 11 Lowest frequency modes-7, 8, 9, 10 and 11 represented in cartoon. The market regions (domains) in all the modes shows collective motions of residues which is observed as iris like movement, that leads to the biological function of pyruvate kinase.

Figure 12 (A) Map showing 2D plot of residues on both axes for the elastic network model of pyruvate kinase representing lowest-frequency mode 7. (B) Elastic network model of pyruvate kinase (mode 7) showing connections between C-alpha atoms. The interaction with a cutoff distance of 10 Å is illustrated as blue solid lines (for mode 7).
R2 |
Frequency |
Collectivity |
Mode 7 |
1 |
0.5185 |
Mode 8 |
1.19 |
0.405 |
Mode 9 |
1.47 |
0.1401 |
Mode 10 |
1.6 |
0.3469 |
Mode 11 |
1.78 |
0.3977 |
Mode 12 |
2.2 |
0.4961 |
Mode 13 |
2.27 |
0.1253 |
Mode 14 |
2.62 |
0.6228 |
Mode 15 |
2.78 |
0.3664 |
Mode 16 |
2.94 |
0.1427 |
Table 3 Lowest frequency modes with frequency and collectivity values
Normal mode analysis
Due to the ambiguity concerning the X-ray crystallographic structure, we proceeded towards homology modelling of M. tuberculosis pyruvate kinase and examined for structural conformations, flexibility and the contribution of the structural modifications assisted in allosteric activity of enzyme. The predicted model of pyruvate kinase was subjected to normal mode analysis to verify the atomic displacements and its influence on the global motions of protein. Since the largest conformational changes are known to be associated with the lowest frequency normal modes, we calculated the 100 lowest frequency normal modes for our structural model. The first six modes correspond to global movements of the molecule (translations and rotations, with a zero frequency) and will be ignored in the following discussion. Hereinafter, the following 100 models are renumbered, starting from one.
The frequencies lie between 65Cm-1 and 315Cm-1, where these values are large compared to values generally obtained with standard normal mode analysis. This is due to the fact that the potential energy is determined apart from a constant ‘C’ which refers to the strength of the potential. For each low-frequency normal modes (mode 7, 8, 9, 10 and 11), different structures were generated, through a displacement along the normal mode considered (Figure 11). Examination of the motions associated with the different modes reveal two types of movements. The first type (mode 1, 7, 10, 15, and 18) is symmetrical and corresponds to an overall iris-like movement; whereas in the second type, the different domains behave differently on asymmetrical movements. For the generated model, bending (modes 2, 3) or translating motions (modes 6, 7) involving are generally observed. All the modes involved in symmetrical movements are non-degenerate modes, where others are degenerate ones. The elastic network model was generated to observe the large conformational changes in the low-frequency mode 7, as the name suggests, in this model all the atoms are connected by a network of elastic connections (Figure 12a & 12b).
The relative displacements of the Cα corresponding to the lowest frequency mode of the pyruvate kinase are depicted and are used for functional analysis see Table 3. The relative displacements associated with the protein is identical and for clarity in the Figure, a zone is identified which exhibits significant relative displacements. This zone involving the domains A and C exhibit less significant displacement. The zone with no fluctuations behaves like pivots around which the regions are moving.
Flexibility of the protein
Following essential dynamics analysis (ED), the orthogonal movements describing the variance of a system is obtained by diagonalization of the covariance matrix (Figure 13). The results of the analysis is generated as set of eigenvectors (modes/ principal components), which describe the nature of the deformation movements of the pyruvate kinase see Figure 14a &14b and set of eigenvectors which indicates the stiffness associated by each mode. The eigenvectors are ranked as shown in Table 4 after a principal component analysis; the first one is the explaining the largest parts of the variances. Apparent stiffness helps to detect strong interactions between which indicate physically-intense direct contact or strong chain-related interactions. The 2D N x N plot see Figure 15 indicates the exact value of the apparent stiffness of all the modes in the normal mode analysis, with a maximum value of 18590000.00Kcal/Mol*Å2 and minimum value of -18870000.00Kcal/Mol*Å2. The standard measure of residue/atom flexibility is given by B-factor. The B-factor profile for mode 7 represents the distribution of the residues harmonic oscillation. Very large B-factors should take to indicate very flexible residues that might display conformational changes along the trajectory, which is difficult to follow within the harmonic approximation implicit to B-factor analysis.
The covariance analysis determines connections between the movements of the residues. The correlations are indicated as a 2D N x N plot see Figure 16; where each row and column represents a residue. Each position shows the correlation values for that pair of residues and the cell is coloured with a white to green gradient for positive correlation and white to red for negative correlation. The collectivity index values are calculated to numerically measure the number of atoms affected by a given mode. The Table 4 gives the collective index values, where the high value indicates that the corresponding eigenvector (principal component or mode) effects many of the atoms while correspondingly lower values indicating the eigenvectors that has a more local behaviour.
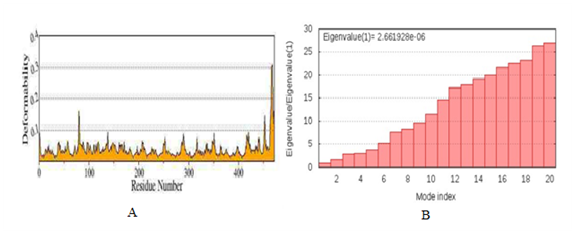
Figure 14 (A) The Plot shows the deformability (flexibility) of the predicted normal modes by considering only the Cα atoms of amino acids. (B) Plot representing the histogram of all the low-frequency normal modes with their eigenvalues.
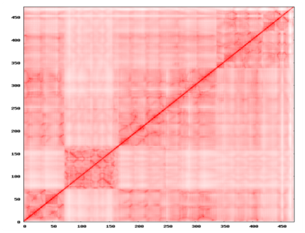
Figure 15 The above 2D NxN plot indicated the exact values of the apparent stiffness of all the normal modes, which detects strong interaction between residues that might be physically intense direct contacts or strong chain-related interactions.
Mode |
RMS type |
Collectivity Index |
Associated eigenvalues |
Eigenvector Stiffness Constant (Kcal/Mol* Å2) |
1 |
Standard |
0.465 |
30.68 |
0.019 |
2 |
Standard |
0.385 |
22.587 |
0.026 |
3 |
Standard |
0.299 |
16.348 |
0.036 |
4 |
Standard |
0.199 |
12.415 |
0.048 |
5 |
Standard |
0.163 |
11.627 |
0.051 |
6 |
Standard |
0.531 |
7.073 |
0.084 |
7 |
Standard |
0.023 |
6.054 |
0.098 |
8 |
Standard |
0.295 |
5.548 |
0.107 |
9 |
Standard |
0.437 |
4.764 |
0.125 |
10 |
Standard |
0.366 |
4.151 |
0.144 |
Table 4 Principal Component analysis showing the collectivity index
Detection of hinge points is crucial in characterizing the dynamics and flexibility of a protein, since, hinge motions are similar to rotations around an articulated joint and therefore can be very large. Hinge motion is characterized by large changes in main-chain torsional angles occurring at a localized region and usually involves a small number of residues, since even one bond can provide the required rotational freedom. This kind of protein motion is free of packing constraints. When a chain exhibits hinge motion at the region connecting two structural domains, each domain behaves as a rigid body and packing interactions can appear/disappear between the interfaces of those rigid bodies. Hinge motions usually occur upon binding to another molecule, or upon activation/deactivation of the protein. This was carried by three different methods, such as B-factor slop change (Figure 17a), and force constant method see Figure 17b and dynamic domain detection methods see Figure 17c. Even if the movements are specific for each domain, it has been observed segmentation in each rigid body with residues 1-68, 174-215, 258-472 and residue leu 190, ser 191, phe 192, val 193, arg 194, ser 195, pro 196, ala 197, asp 198, val 199, glu 200 are contributing flexibility in hinge regions.
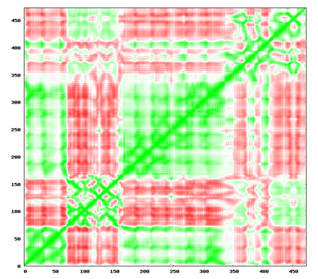
Figure 16 2D plot indicating correlation between the movements of residues. In the above square matrix, each row and column represents a residue and each position shows the correlation value for the pair of residue and the cells are colored with a white to green gradient for positive correlation & white to red for negative ones.
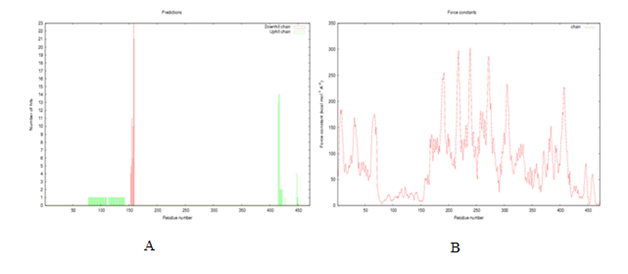
Figure 17 (A) The plot shows hinge point prediction by B-factor slop change method. In the above plot uphill (green) determines related to a change from low to high B-factor and downhill (red) to other side. The amino acid sequence is labeled below; colored in which the same code as the graph. Brighter the color indicates the increased confidence in the predicted hinge. (B) The graph represents the computed force contact for each residue. The peak force constants will probably correspond to the residues in the interdomain regions.

Figure 17c The modes represent the clustering of the residues according to the correlation, predicted by dynamic domain detection method. The hinge points are contiguous residues found in the contact regions generated by using JMOL with backbones colored according to the cluster assigned to each residue.
Direction of movements: In order to describe the relative movements of residues in each normal mode, residue-residue distance variation maps are displayed. A high similarity of the different squares corresponding to the different domains is clearly observed along the diagonal. This illustrates the symmetrical behaviour of the system. The relative motions of the amino acids are clearly localized in the terminus regions of the protein. The amplitude motions of the region towards the cytoplasmic medium are much large helixes, as illustrated in Figure 11, by kink of the helix for the lowest frequency mode. For the other slow modes which are degenerate, the relative motions of each domain in the structure are not symmetric. For the modes of high frequency, the global motion is more complex, the segmentation in rigid body becomes fuzzier and the movement of the loops are much more disparate. The use of normal mode theory on the particular system, such as the allosteric mechanism of pyruvate kinase without adding external mechanical stretch makes possible the exploration of the enzyme global motions. The non-degenerate modes seen to be implied in the conformational rearrangements occurring during the catalytic activity of the enzyme in formation of pyruvate (product) from phosphoenolpyruvate (substrate) in presence of the co-enzyme ADP which is further converted to ATP. Through allosteric regulation, the phosphoenolpyruvate binding site is distorted by transition from the R-state to T-state. Allosteric process also allows an enzyme activity to the coordinated with other cellular reactions and signalling pathways. The allosteric site is located distinctly from the active site and is entirely located in the enzyme in interface between domains A and C (Figure 18). A phosphate-binding site for the allosteric activator is created by residues encoded regions (Figure 19) of the gene that corresponds to spliced exons of isoenzye. FBP activation induces several conformational changes among active site side chains which involve significant domain motions.55 The flexibility of the residues in the domain interface assist large conformational changes in the binding sites of substrate was clearly observed in the lowest-frequency modes 7, 8 and 10. The relative motions between the pyruvate kinase domains play a key role in the allosteric regulation of the enzyme activity.56 The catalytic centre is build up by residues belonging to the three largest loops (loop 6, 7 and 8) of the α/β Interestingly, ser 310, the only amino acid that has dihedral angle outside the allowed regions of the Ramachandran plot of the pyruvate kinase model structure. It has been found that loop 6 of the α/β barrel takes part in the binding of PEP. In the inactive state this loop undergoes a conformational change that distorts the active site. This alteration of the catalytic centre explains the low affinity of the T-state for the cooperative substrate binding and is directly coupled to the subunit rotation. The role of loop 6 as a flexible element participating in substrate binding and catalytic feature common to several other α/β barrel containing enzymes. The domain interface and disordered regions are important in the function of the protein, since these regions are dynamically flexible and are distinct from irregular loop secondary structure, which are static in solution as shown in Figures 20a & 20b. Here in M. tuberculosis pyruvate kinase it is observed the presence of additional loop in C-terminal. Interestingly, 8 allosteric sites detected by PASA server, such as, CAV-6, CAV-7 and CAV-1 with the flexibility P-value of 0.06, 0.37, and 0.00, showing structural conservation value of 62.50, 75.00 and 87.50 respectively see Figure 21. It has shown that these cavity’s were observed in the two domains present in the enzyme which facilitated by large movements in the terminal residues (such as pro 423, pro 424, ile 467, gly 460, val 472). And also these conformational motions of the domains are observed in the low-frequency modes. The Lindemann coefficient for the low-frequency mode by standard NMA gives by the value 0.156Å. This coefficient is an estimate of the solid-liquid behaviour of the protein. The behaviour of the residues inside the enzyme pyruvate kinase (the buried ones) has a lower Lindemann coefficient (as more solid-like) than the residues that remain in the surface of the protein. In the present study, we present the information on the nature of the conformational change is often carried by the open form of the enzyme. This will provide a route to check the hypothesis about the kind of conformational change that the protein undergoes to perform its function.

Figure 18 The model structure of pyruvate kinase showing the predicted active pocket, where active pocket is represented in red color (generated by JMOL).
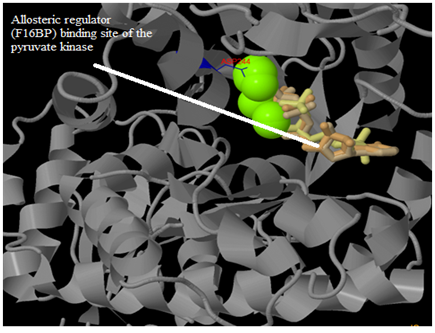
Figure 19 Binding site predicted in the M. tuberculosis pyruvate kinase for allosteric substrate Fructose 1,6, bisphosphate (F16BP) was as shown in above image.
The theoretical 3-D structure of the M. tuberculosis pyruvate kinase was built to compare the structural variations with the template used. Being the glycolytic enzyme, the pyk also plays a crucial role in the central metabolism of mycobacterium because of the presence of specific binding site for allosteric regulator along with substrate. Normal mode analysis studies conform the structural changes occurring in the enzyme that may assist alternative pathway in the metabolism of bacteria in the host during infection.The global motions observed in the examined structure of pyruvate kinase i.e., for the non-degenerate lowest frequency modes, an iris-like movement that consists in a twist and tilt of the helix. For all normal modes analyzed, a given protein does not behave as a rigid body, but rather as an assembly of rigid bodies. These rigid bodies do not inevitable include complete secondary structure elements, but rather parts of them. In the allosteric Pyk, the hinge points are usually found in unstructured regions linking the different domains. In the normal mode analysis performed no individual normal mode lead to the allosteric activity of the pyruvate kinase. Infact, normal mode analysis gives information about the preferential direction of movements along ‘easy’ direction. This method does not take into account the constraint, but provide new insights on the zone of the protein which are able to participate in the allosteric mechanism of the pyruvate kinase enzyme. Therefore, at variance with most cases previously considered when low-frequency normal modes were compared to conformational transitions, such as conformational changes may well occur in several, largely independent steps of different amplitude and directions.66–69
The authors thankfully acknowledge the financial support for Department of Science and Technology (DST), New Delhi, India under INSPIRE program.
No potential conflict of interest was reported by the authors.

©2016 Gollapalli, et al. This is an open access article distributed under the terms of the, which permits unrestricted use, distribution, and build upon your work non-commercially.