MOJ
eISSN: 2574-8130


Technical Paper Volume 4 Issue 5
Institute of Posturology, France
Correspondence: Pierre-Marie Gagey, Institute of Posturology, P20 rue du Rendez-vous, 75012 Paris, France
Received: September 12, 2019 | Published: October 4, 2019
Citation: Gagey PM. Using the autocorrelation function in stabilometric signal analysis. MOJ Gerontol Ger. 2019;4(5):186-188. DOI: 10.15406/mojgg.2019.04.00204
We do not know how to measure the reaction time of the postural system, which is an important parameter of equilibration. Is it possible to use the progress of the stabilometric signal analysis1 to try to propose a solution to this problem,This will be the attempt of this paper.
Keywords: stabilometric signal analysis, old man, ballistic Interval, independent variables, postural system, autocorrelation curve
The elderly subject is moves slowly. This slowdown is a factor of instability and fall. When A fall old man perceives his fall, he reacts, but its late. Measuring the slowing down of the old man is therefore of obvious clinical interest and there are already techniques for measuring this slowing down, such as the speed of walking, for example. The technique we present is new and more general, it measures something that seems more appropriate and in relation to the reaction time of the postural system.
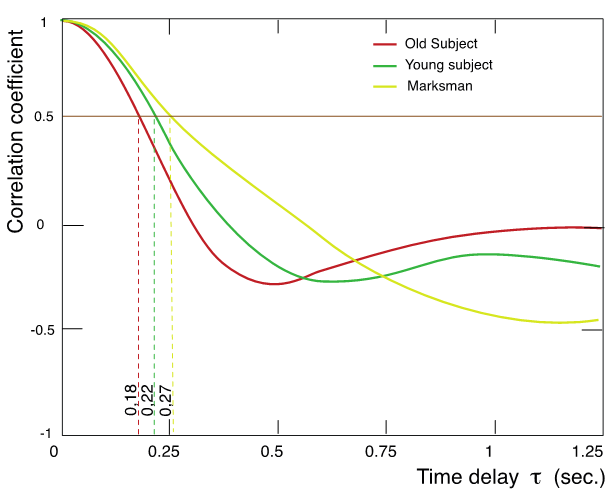
This new stabilometric parameter that we call: "Ballistic Interval" is the abscissa of the 0.5 crossing of the autocorrelation of the acceleration function of the subject's center of gravity over time (Figure 1).
The parameter value is that of the abscissa ( τ ) of the 0.5 crossing of the autocorrelation curve of the time function of the acceleration of the center of gravity of the subject. Only part of the autocorrelation is represented. This rigorous definition requires some explanation.
For about fifty years, various solutions have been proposed to evaluate the movements of the center of gravity of the subject from the movements of his center of pressure recorded by the force platforms.2-11 A solution of the Winter equation,12 mathematically reliable,13,14 has been Found, that gives access to the acceleration of the center of gravity of the subject.
The comparison of the values of this acceleration in various populations showed that it's possible to clearly distinguished the population of young subjects from that of old subjects (Figure 2).

Figure 2 Principal components analysis of the age factor in two modalities: young (y) and old (o), from eight stabilometric parameters.
The names of the eight independent variables are written to the extension of their axis. Both cohorts are clearly distinguished along the first axis, highly correlated to the acceleration of the center of gravity (0.965). The study of the temporal evolution of this acceleration during the recording confirmed the presence of the acceleration peaks described by Lakie et al.15
Comparison of these peaks in different populations showed that they were much more frequent in the elderly than in the young (The amplitude of the peaks is lower in the elderly subject). In high-level athletes, the evolution of these peaks could only be studied in a single Olympic rifle champion at ten meters in room16 the interval between the peaks is much longer and their amplitude is much smaller (Figure 3)

Figure 3 Curves of the acceleration of the center of gravity over time of three different subjects: a top athlete, a young subject and an old one. Representative cases of a study on 152 subjects.
The autocorrelation represents the evolution of the correlation coefficient (ordinates) of different values of the time function of the acceleration, separated by increasing intervals of time (abscissa). The coincidence of the duration of these autocorrelation intervals with that of the intervals between the peaks of acceleration does not occur at the same tag lag in the different populations (Figure 4). The comparison of these differences in 152 subjects from different cohorts (116 young subjects, 35 elderly subjects, 1 firing champion) found that the dispersion of the time lag according to the cohorts was maximum when the correlation coefficient of the autocorrelation went through the value 0.5 for the first time.

Figure 4 Autocorrelations of the time function of the acceleration of the center of gravity of three subjects from different cohorts.
This schematic representation was constructed from a series of 152 autocorrelations of the time function of the center of gravity acceleration of subjects belonging to different cohorts: 116 young subjects, 35 elderly subjects, 1 international shooting champion.
This parameter is rigorously defined, but what it measures is much less obvious. It classifies the subject within a range of temporal variation in relation to the ballistic interval, the interval between the acceleration peaks of the center of gravity. The figure of its definition evokes that of the time constant of capacitors without being allowed to use the term here. And, paradoxically, the slowness of the old man appears in the aspect of a shorter duration of the ballistic interval.
Modern physics teaches us time and again that in the end a rigorous measure poses more questions than it solves (and we as scientists should be accustomed to this fact). This does not preclude the use of this ballistic interval parameter to classify the subject and follow his evolution in a scale of values, probably related to his speed of reaction.
None.
The authors of this manuscript have no competing interests.

©2019 Gagey. This is an open access article distributed under the terms of the, which permits unrestricted use, distribution, and build upon your work non-commercially.