MOJ
eISSN: 2573-2919


Short Communication Volume 10 Issue 3

Departamento de Ecologia, Universidade de Brasilia, Brazil
Correspondence: John Du Vall Hay, Departamento de Ecologia, Universidade de Brasilia, Brasília, DF, Brazil, Tel +55 61 98118 2442
Received: May 22, 2025 | Published: June 2, 2025
Citation: Hay JDV. What to do when you can’t get to the field to collect data for teaching ecological diversity indices. MOJ Eco Environ Sci. 2025;10(3):106-110. DOI: 10.15406/mojes.2025.10.00353
The aim of this article is to provide a simple method for obtaining data to teach how to calculate basic indexes of alpha diversity. Data were collected during an undergraduate class laboratory exercise using automobiles in parking lots, considering the brand as the “genus” and the model as the “species”. The alpha diversity measures calculated were species richness, Chao1 index, Simpson Index and Shannon Index. The data collection method was efficient for producing quantitative data adequate for the pretended analyses.
Keywords: alpha diversity indices, chao1, Simpson, Shannon, teaching methods
Diversity indexes are important tools in ecological science incorporating data on species richness and evenness. Their introduction into ecological research began in the middle of the 20th century.1–4 There are many publications explaining the importance of knowledge about ecological diversity and the application of these indices can be found in many different areas of study. There is a recent publication that summarizes many aspects related to the importance and use of diversity indexes in ecology.5
Ecological diversity can be estimated in different scales and the types of analyses used are varied.6 Alpha diversity (a diversity) is a measure of the species diversity within a particular community or habitat, for example the community of trees in your local park. There is no exact number of published alpha diversity indices, but several are more commonly used than others.7 Beta diversity (b diversity) is a measure of the similarity or dissimilarity between two communities in the same region or between the same type of community in different regions, for example a comparison of the composition of beetle communities in a meadow and nearby forest or the species of fish in two lakes. Gamma diversity (g diversity) is a measure of total species diversity along an environmental gradient at the landscape level, for example a study of bird communities along an altitudinal transect or coral species with depth.
The collection of data for calculating ecological diversity usually involves excursions to field sites which are expensive and time consuming in many cases. The inspiration for this exercise was based on a publication on species packing of fast-food restaurants in shopping malls8 and objective of this paper is to provide a simple method for collecting data for teaching ecological diversity indexes without the need for expensive field excursions.
Data collection
The data presented here were collected by the students during a laboratory exercise in an undergraduate course in general ecology during the first semester of 2019. All data were collected during one afternoon in different parking lots on the University campus (Figure 1). The class was divided into different groups and each group collected data on the cars parked in the different areas. The data were collected using an accumulation curve by walking along a line of the parking spots and annotating the brand (“genus”) and model (“species”) of the first 100 parked cars found in the selected area.
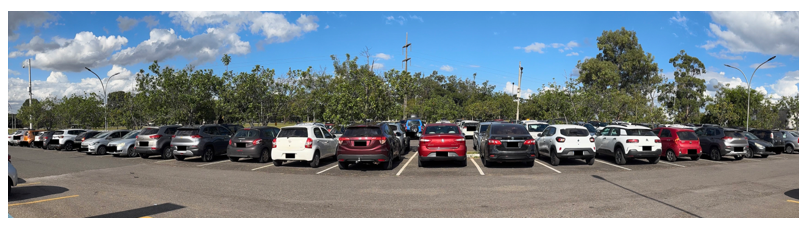
Figure 1 An example of one of the sampling locations on the University campus.
Calculation of diversity measures
After collection of the data four basic measures of alpha diversity were calculated in the classroom or at home. These were:
(1)
Where: Sobs = the number of observed species
f1 = the number of singletons in the sample (species with only 1 occurrence in the whole data set)
f2 = the number of doubletons in the sample (species with only 2 occurrences in the whole data set, that in this case could be one occurrence in each of two different groups or two occurrences in the same group)
Simpson – there are three variants of this index, Simpson’s Dominance Index (D), Simpson’s Diversity Index (1-D) and Inverse Simpson’s Index (1/D).9 Calculation in this exercise was done using the Simpson’s Diversity Index. This index varies from 0 to 1 where a value of 0 indicates total dominance (only one species) and higher values indicate increasing species diversity by estimating the probability that two randomly selected (or sampled) individuals belong to different categories (or species). The formula used for calculating this index was:
(2)
Where: S = the total number of species
ni = the number of individuals in the ith species
N = the total number of individuals
Shannon (H) – varies from 0 when only one species is present to an upper bound that is based on the number of species. This index is also cited as the Shannon-Weiner index.9 The original calculation of this index was done using natural logarithms, but any base can be used. The formula used for calculating this index in this exercise was:
(3)
Where: S = the total number of species
pi = the proportion of individuals belonging to species i
log is in base 10
It is also possible to calculate the maximum obtainable values and degree of evenness for the Simpson and Shannon index. Evenness represents the similarity in number of individuals in each species.
The formulae for calculating these values for the Simpson index are:
(4)
Where Dmax = the maximum value based on the particular data set
s = the number of species
N = the number of individuals
E = the evenness of the distribution of individuals among species and for the Shannon index are
(5)
Where Hmax = the maximum value based on the particular data set
s = the number of species
J = the evenness of the distribution of individuals among species
All calculations were done using simple functions in EXCEL or with a hand calculator.
The time necessary for data collection was relatively quick, with all groups finishing within 1 ½ hours. A total 595 individuals were counted, and 18 “genera” and 98 “species” were recorded by the six groups varying from 36 to 51 (Table 1). Although each group collected data on 100 individuals some of the identifications were incorrect and these data were omitted from the analyses. Of the 98 “species” there were 32 singletons and 18 doubletons and the calculation for richness using the Chao1 estimate was approximately 111. The calculation of the Simpson and Shannon indices for the whole data set were D = 0.973 and H = 1.713 respectively and the maximum values and evenness for each index were Dmax = 0.991 and 98.1% for the Simpson index and Hmax = 1.99 and J = 86.0% for the Shannon index.
|
"Genus" |
"Species" |
Group 1 |
Group 2 |
Group 3 |
Group 4 |
Group 5 |
Group 6 |
Combined |
|
Audi |
A3 |
1 |
1 |
|||||
|
Chery |
|
3 |
3 |
|||||
|
Chery |
Tiggo |
1 |
1 |
|||||
|
Chevrolet |
Agile |
1 |
1 |
1 |
3 |
|||
|
Chevrolet |
Astra |
1 |
3 |
4 |
||||
|
Chevrolet |
Celta |
4 |
6 |
1 |
2 |
3 |
1 |
17 |
|
Chevrolet |
Classic |
1 |
1 |
1 |
3 |
6 |
||
|
Chevrolet |
Cobalt |
1 |
1 |
|||||
|
Chevrolet |
Corsa |
3 |
1 |
4 |
||||
|
Chevrolet |
Cruze |
1 |
1 |
|||||
|
Chevrolet |
Meriva |
1 |
1 |
1 |
1 |
4 |
||
|
Chevrolet |
Onix |
4 |
1 |
2 |
7 |
4 |
4 |
22 |
|
Chevrolet |
Prisma |
1 |
1 |
1 |
3 |
6 |
||
|
Chevrolet |
S10 |
1 |
1 |
|||||
|
Chevrolet |
Sonic |
2 |
2 |
|||||
|
Chevrolet |
Spin |
1 |
1 |
2 |
||||
|
Chevrolet |
Tracker |
1 |
1 |
1 |
3 |
|||
|
Chevrolet |
Vectra |
1 |
1 |
|||||
|
Citroen |
Aircross |
1 |
1 |
|||||
|
Citroen |
C3 |
3 |
3 |
2 |
3 |
11 |
||
|
Citroen |
C4 |
1 |
1 |
2 |
||||
|
Citroen |
Xsara |
1 |
1 |
1 |
1 |
4 |
||
|
Fiat |
500 |
1 |
1 |
2 |
||||
|
Fiat |
Argo |
2 |
3 |
1 |
2 |
8 |
||
|
Fiat |
Cronos |
1 |
1 |
|||||
|
Fiat |
Idea |
1 |
1 |
1 |
3 |
|||
|
Fiat |
Mobi |
1 |
1 |
1 |
1 |
1 |
5 |
|
|
Fiat |
Palio |
2 |
6 |
7 |
5 |
2 |
4 |
26 |
|
Fiat |
Punto |
1 |
2 |
1 |
4 |
|||
|
Fiat |
Siena |
2 |
1 |
3 |
1 |
2 |
9 |
|
|
Fiat |
Stilo |
1 |
1 |
|||||
|
Fiat |
Strada |
1 |
1 |
2 |
||||
|
Fiat |
Toro |
1 |
1 |
|||||
|
Fiat |
Uno |
7 |
2 |
5 |
3 |
7 |
1 |
25 |
|
Ford |
Belina |
1 |
1 |
|||||
|
Ford |
Ecosport |
2 |
2 |
2 |
1 |
7 |
||
|
Ford |
Fiesta |
2 |
6 |
4 |
3 |
3 |
18 |
|
|
Ford |
Focus |
2 |
1 |
1 |
4 |
|||
|
Ford |
Fusion |
1 |
1 |
|||||
|
Ford |
Ka |
3 |
7 |
3 |
4 |
8 |
8 |
33 |
|
Honda |
City |
2 |
2 |
4 |
||||
|
Honda |
Civic |
2 |
1 |
1 |
2 |
2 |
1 |
9 |
|
Honda |
Fit |
3 |
1 |
4 |
3 |
4 |
4 |
19 |
|
Honda |
HRV |
3 |
1 |
1 |
5 |
|||
|
Honda |
WRV |
1 |
1 |
2 |
||||
|
Hyundai |
Azera |
1 |
1 |
|||||
|
Hyundai |
Creta |
1 |
1 |
2 |
||||
|
Hyundai |
HB20 |
3 |
3 |
9 |
7 |
3 |
7 |
32 |
|
Hyundai |
i30 |
2 |
1 |
2 |
1 |
6 |
||
|
Hyundai |
ix35 |
1 |
1 |
2 |
||||
|
Hyundai |
Santa Fé |
1 |
1 |
2 |
||||
|
Hyundai |
Tuscon |
2 |
2 |
|||||
|
JAC |
J2 |
1 |
1 |
2 |
||||
|
Jac |
J3 |
1 |
1 |
1 |
3 |
|||
|
Jac |
J6 |
1 |
1 |
|||||
|
Jeep |
Compass |
1 |
1 |
1 |
3 |
|||
|
Jeep |
Renegade |
2 |
2 |
2 |
2 |
2 |
10 |
|
|
Kia |
Cerato |
1 |
1 |
|||||
|
Kia |
Optima |
1 |
1 |
|||||
|
Kia |
Picanto |
1 |
1 |
|||||
|
Kia |
Sportage |
1 |
1 |
2 |
||||
|
Land Rover |
Range Rover |
1 |
1 |
|||||
|
Mitsubishi |
ASX |
1 |
1 |
|||||
|
Mitsubishi |
Lancer |
1 |
1 |
2 |
||||
|
Mitsubishi |
Pajero |
1 |
1 |
|||||
|
Nissan |
Fronteir |
1 |
1 |
2 |
||||
|
Nissan |
Kicks |
2 |
2 |
|||||
|
Nissan |
Livina |
1 |
1 |
2 |
||||
|
Nissan |
March |
2 |
4 |
1 |
3 |
3 |
13 |
|
|
Nissan |
Sentra |
1 |
1 |
|||||
|
Nissan |
Tiida |
1 |
1 |
|||||
|
Nissan |
Versa |
1 |
1 |
1 |
3 |
|||
|
Peugeot |
206 |
1 |
1 |
|||||
|
Peugeot |
207 |
2 |
1 |
1 |
1 |
5 |
||
|
Peugeot |
208 |
1 |
1 |
1 |
2 |
5 |
||
|
Peugeot |
307 |
1 |
1 |
|||||
|
Peugeot |
408 |
1 |
1 |
|||||
|
Renault |
Clio |
3 |
4 |
2 |
1 |
2 |
12 |
|
|
Renault |
Duster |
1 |
1 |
2 |
||||
|
Renault |
Kwid |
1 |
2 |
2 |
2 |
7 |
||
|
Renault |
Logan |
1 |
1 |
|||||
|
Renault |
Megane |
1 |
1 |
|||||
|
Renault |
Sandero |
2 |
8 |
4 |
5 |
3 |
7 |
29 |
|
Renault |
Symbol |
1 |
1 |
|||||
|
Toyota |
Corolla |
1 |
3 |
1 |
1 |
1 |
7 |
|
|
Toyota |
Etios |
5 |
5 |
5 |
2 |
3 |
2 |
22 |
|
Toyota |
Prius |
1 |
1 |
|||||
|
Toyota |
RAV4 |
1 |
1 |
|||||
|
Toyota |
Yaris |
1 |
1 |
2 |
||||
|
Volkswagen |
Bora |
1 |
1 |
|||||
|
Volkswagen |
Fox |
4 |
3 |
1 |
2 |
2 |
2 |
14 |
|
Volkswagen |
Fusca |
1 |
1 |
|||||
|
Volkswagen |
Gol |
4 |
5 |
8 |
7 |
4 |
7 |
35 |
|
Volkswagen |
Jetta |
1 |
1 |
1 |
3 |
|||
|
Volkswagen |
Polo |
1 |
2 |
2 |
1 |
1 |
7 |
|
|
Volkswagen |
Saveiro |
1 |
2 |
1 |
1 |
5 |
||
|
Volkswagen |
Up |
4 |
9 |
2 |
5 |
5 |
6 |
31 |
|
Volkswagen |
Voyage |
1 |
2 |
1 |
2 |
3 |
9 |
|
|
Richness |
51 |
36 |
44 |
48 |
48 |
46 |
98 |
|
|
Total |
|
100 |
100 |
99 |
100 |
99 |
97 |
595 |
Table 1 Data collected by each group and combined for the whole class
In this laboratory exercise each group also did other analyses using the data from their group. These analyses were:
The use of these alpha diversity indices in common in ecology, but there have been critiques of them.10,11 It is also important to remember that the values produced by these indices are not significant by themselves and that they should be used in comparison with other studies where the data were collected using the same methodology and the same base for logarithms when comparing Shannon indexes. It is also important to note that the maximum values are dependent upon the sample size and the number of species found.
There are too many texts, laboratory manuals, software and apps that have been published to calculate these and other diversity indices to cite them all. A search in Google Scholar using “alpha diversity indices” as the search term returned 24100 results but using “teaching alpha diversity” returned no (zero) results. One of the most frequently used methods in current research for calculating alpha diversity in communities is the vegan R package available at https://CRAN.R-project.org/package=vegan.12
Although the calculations done in this text are for the basic diversity indices shown in the Methods section the collected data can be used for teaching other analytical techniques. These could include calculations of beta diversity (similarity or dissimilarity indexes) by comparing the data from different groups of students or different methods of multivariate analyses to compare differences among sampling sites. In my opinion, this type of collection does not provide data for analysis of gamma diversity.
As a final note, the brands and models observed in this study are representative of the time when the data were collected and of the country where the data were collected and the same study done in another country or more recently on the same campus would have a different collection of “genera” and “species”.
Although the data were collected using artificial species the collection procedure used was simple and efficient to furnish data for teaching how to calculate basic alpha diversity indices. There are many different methods to calculate alpha diversity of ecological communities, but the methods described in this manuscript are widely used. Using the data collected with this method it would also be possible for teachers to show their classes how to use other more advanced methods in ecological research in analysis of communities such as different types of multivariate analyses.
To all the students who participated in the data collection and to an anonymous reviewer for helpful comments.
None.
The author declares that there is no conflict of interests.

©2025 Hay. This is an open access article distributed under the terms of the, which permits unrestricted use, distribution, and build upon your work non-commercially.
