MOJ
eISSN: 2573-2919


Research Article Volume 2 Issue 1
1Republican State Enterprise on the Right of Economic Use "Institute of Zoology", Ministry of Education and Science, Science Committee, Kazakhstan
2Institute of Evolution, University of Haifa, Israel
3LLP Institute of Geography, Kazakhstan
4LLP Kazakh Scientific Research Institute of plant protection and quarantine NA Zh. Zhiembaev, Kazakhstan
Correspondence: Barinova SS, Institute of Evolution, University of Haifa, Mount Carmel, 199 Abba Khoushi Ave, Haifa 3498838, Israel
Received: October 10, 2016 | Published: February 15, 2017
Citation: Krupa EG, Barinova SS, Amirgaliyev NA, et al. Statistical approach to estimate the anthropogenic sources of potentially toxic elements on the shardara reservoir (Kazakhstan). MOJ Eco Environ Sci. 2017;2(1):8-14. DOI: 10.15406/mojes.2017.02.00012
In June of 2015, we investigated the distribution of biogenic elements, heavy metals, and pesticides in the waters of the Shardara Reservoir. The average content of ammonium, nitrates, nitrites and phosphates in the water did not exceed the limit values set for the fishery water bodies. Zinc concentration in the water averaged 0.121, copper–0.040, cadmium–0.003, lead–0.034mgdm-3, isomers of hexachlorcyclohexane (HCCH)–0.0041mgdm-3. Wafer plots were built in order to identify the distribution correlation of hydro-chemical and toxic variables with the sources of pollution in Shardara reservoir, and statistical methods were used as well (correlation, multiple regression analysis methods, canonical correspondence analysis, and ecological mapping with the Statistica 12.0 Program). It was found that copper, nitrates, and isomers of HCCH enter the reservoir mainly with the drainage water discharged from irrigated fields along the southern bank. The source of mineral phosphorus, polyphosphates, nitrites and zinc is the river runs off rom the east. High concentration of heavy metals in the water could also be related to natural causes, as the water reservoir and its tributaries are located in a metallogenic province.
Keywords: heavy metals; biogenic elements; statistics; sources of pollution; shardara reservoir; south Kazakhstan; temperature; coverage; permissible; macrophytes; originates; arid climate; pesticides
The Shardara reservoir in Southern Kazakhstan was formed in 1965 on the Syrdarya River canal with help of dam.1,2 Its length is at full filling of up to 80 km with a maximum width of 25 km. The reservoir is elongated from north-west to south-west. The northern bank is leveled, composed of loose sandy clay and clay loam, with steep underwater ledges. Southernbankis flat dissected with bays and coves. The Shardara reservoir is located in the Ecoregion 626: Lower & Middle Syr Dray
http://www.feow.org/ecoregions/details/626).
The climate of the ecoregion is continental with high aridity. Large seasonal and daily fluctuations in temperature are characteristic. The summer is dry, cloudless, and very hot. In July, the warmest month, the average monthly temperature is 25-31 ˚C. From June to the first half of August the maximum temperature usually reaches 40 ˚C or more. Precipitation here averages 429 mm. Precipitation is the lowest in August, with an average of 2 mm. Most precipitation falls in March, with an average of 75 mm (http://en.climate-data.org/location/485/). So the quality of inland waters in this arid region attracts the attention of various environmental organizations, public and private. The research of a hydro-chemical mode and toxic pollution of the reservoir began since its formation.1-5 High concentrations of heavy metals and pesticides in the water were reported until the mid-90-s. In the subsequent period of economic recession the amount of utilized pesticides was reduced, which led to the improvement of the ecological situation in the region. The Shardara Reservoir is one of the largest fisheries in Kazakhstan, therefore monitoring its ecological status and identification of its main sources of pollution is deemed urgent. The aim of this work is to study the spatial distribution of heavy metals, pesticides, nitrogen, and phosphorus compounds in relation to the potential sources of water pollution.
Sampling and Chemical analysis
Research on salinity and chemical composition was carried out in June 2015 through 3 stations, and research of the content of biogenic elements, heavy metals and organ chlorine pesticides in the water was carried out by means of a grid of 13 stations (Figure 1). The measures of temperature and pH on the surface water layers were taken in the field environment by using Hanna HI 98129 instrument. Water transparency was measured with a Secchi disk. Altogether, 36 samples were taken from 13 sampling stations and fixed in the site by adding nitric acid; samples for biogenes were fixed with chloroform. All collected samples were transported to the lab in an icebox. Macrophytes abundance was assessed with percent of water surface coverage. Coordinate referencing of the stations were done by Garmin eTrexGPS-navigator. Conventional methods of chemical analysis of water were used.6,7 Water samples were analyzed in three – four replications. Heavy metal measuring was performed by mass spectrometry with inductively coupled plasma by using Agilent 7500 A manufactured by Agilent Technologies, USA (National Standard RK ISO 17294-2-2006). Organ chlorine pesticides were measured by gas-liquid and high-performance liquid chromatography.8-15 Test-sensitivity is 10-5 mcg. The detection threshold is 0.002 mgdm-3 of the sample. Data on the content of biogenic elements, heavy metals and pesticides was compared to the maximum permissible concentrations of substances established for fisheries (MPC).11,12
Statistical calculation
When analyzing the spatial distribution of a biotic factors based on coordinate referencing of points where material sampling was taken, wafer-plots were built in Statistica 12.0 program. Correlation and regression analyses were performed in the same program. Canonical correspondence analysis (CCA)13,14 and the GRAPHS program15 were used to determine the relationship between hydro-physical and hydro-chemical indicators.
Description of studied site
Potential sources of pollution of the reservoir are: the transit runoff of the transboundary Syrdarya River from Uzbekistan territory, collector-drainage and non-pointed surface runoff, as well as effluent waters. There are arrays of irrigated land of around 9.4 thousand hectares along the Keles River, a tributary to the Syrdarya River upstream of the reservoir (Figure 1a). Around 136 thousand hectares of agricultural land (mainly cotton and corn but also domestic animals) is located on the southern bank of the reservoir (Figure 1b), which is irrigated through the Dostyk canal that originates in Uzbekistan territory. Irrigational water withdrawal also occurs directly from the reservoir using a pipe into the Dostyk canal (Figure 1e). Drainage water return is discharged into Arnasay Bay (Figure 1d). On the northern bank, there are small arrays melons fields (Figure 1c) that are water through pipes drawing water from reservoir. Small and large domestic animals – sheep, goats, cows and horses are grazed here. The Shardara City is located on the northern bank of the reservoir and its domestic waters flow into the canal that continues the Syrdarya River that flows after dam to the north, when have water. It is only one point of the water discharge from the Shardara reservoir.
Sources of pollution and hydro-physical characteristics
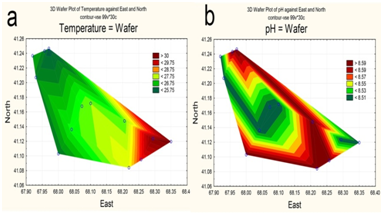
Due to water being taken for irrigation, by early June 2015 the upper part of the reservoir had already been partially drained. The maximum depth in the northwestern area of the waters did not exceed 15 m (Figure 2a), with the maximum design depth being 26 m.16 Water transparency is increased in deep water, i.e., towards the dam (Figure 2b). Surface water layers were heated unevenly, with the maximum temperature in the upper shallow part (Figure 3a). The pH values varied insignificantly; with higher values along the perimeter of the reservoir (Figure 3b).


Hydro-chemical and toxicological characteristics and spatial distribution Indicators
Total Dissolved Solids (TDS) varied over the water area to a small extent, slightly increasing in the influence zone of Syrdarya River runoff (Figure 4) and reaching an average of 1055 mg dm-3. Regarding the total content of dissolved salts, water was brackish,17 with predominance of sulfate and sodium ions. In the influence area of river runoff, the amount of sodium, magnesium, calcium, sulphates and silicon slightly increased. The highest concentrations of potassium were registered along the southern bank of the reservoir.

The concentration of biogenic compounds in water was at a low level (Table 1) and did not exceed the maximum permissible concentration prescribed for fishery water bodies.17 Among organ chlorine pesticides, only ß-HCCH (hexachlorocyclohexane) was generally present in the water, which is considered unacceptable for fisheries. The content of heavy metals exceeded the maximum permissible standards for fishery water bodies.12
Variable |
Value |
Variable |
Value |
|---|---|---|---|
Temperature, °С |
27.54±0.46 |
NH4, mg dm-3 |
0.115±0.020 |
Depth, m |
7.85±1.15 |
Porg, mg dm-3 |
0.161±0.004 |
Transparency, m |
1.47±0.24 |
Zn, mg dm-3 |
0.121±0.040 |
рН |
8.55±0.01 |
Cu, mg dm-3 |
0.040±0.006 |
NO3, mg dm-3 |
5.45±0.13 |
Cd, mg dm-3 |
0.003±0.014 |
NO2, mg dm-3 |
0.092±0.025 |
Pb, mg dm-3 |
0.034±0.014 |
P-PO4, mg dm-3 |
0.026±0.004 |
ß-HCCH, µg dm-3 |
0.0041±0.0008 |
Table 1 Clinical and biochemical variables of individuals with overweight-obesity.
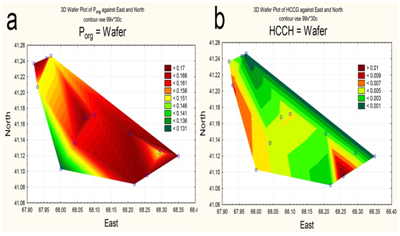
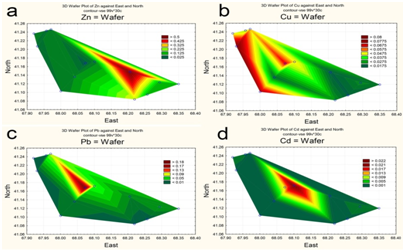
The spatial distribution of nitrogen and phosphorus compounds, slats of heavy metals and pesticides was characterized by different trends. The highest concentrations of ammonium was recorded in the central part (Figure 5a), of nitrites-in the upper reach and near reservoir’s north shore (Figure 5b). By contrast, the southeastern area of the reservoir, as well as a narrow area along the north coast, was characterized by increased concentrations of nitrates (Figure 5c). Distribution of mineral phosphorus across reservoir was relatively even, with the maximum of its concentration being at the top shallow part (Figure 5d). The content of polyphosphate in water varied within a small range, decreasing in the direction from the top shallow to the bottom deep part of the reservoir (Figure 6a). Two maximum concentrations of HCCH isomers in the water were recorded – in the upper reach and near the southern shore of the reservoir (Figure 6b). The highest zinc concentrations were observed in the shallow upper third of the water area (Figure 7a). The distribution of copper was characterized by opposite trends. The maximum content copper salts (70-80 MPC) was recorded in the northwestern area of the reservoir (Figure 7b). The highest concentration of lead (Figure 7c) and cadmium (Figure 7d) were detected in the central area.


The correlation between hydro-physical parameters, biogenic elements, heavy metals and pesticides are shown in Table 2. Deep areas with clear water were characterized by low concentration of mineral phosphorus and zinc and by increased concentrations of copper. Statistically significant negative correlations between the contents of copper and zinc, and copper and polyphosphates (Table 2) gave evidence that they enter the reservoir from different sources. Along with zinc, nitrites and mineral phosphorus enter the body of water, which is confirmed by a statistically significant positive relationship between these elements. The absence of strong correlations between other metals, as well as between HCCH isomers and a biotic indicators, suggests that their distribution across the reservoir was controlled by a complex mix of factors. The correlation between hydro-physical parameters, biogenic elements, heavy metals and pesticides are shown in Table 2. Deep areas with clear water were characterized by low concentration of mineral phosphorus and zinc and by increased concentrations of copper. Statistically significant negative correlations between the contents of copper and zinc, and copper and polyphosphates (Table 2) gave evidence that they enter the reservoir from different sources. Along with zinc, nitrites and mineral phosphorus enter the body of water, which is confirmed by a statistically significant positive relationship between these elements. The absence of strong correlations between other metals, as well as between HCCH isomers and abiotic variables, suggests that their distribution across the reservoir was controlled by a complex mix of factors. The results of multivariate regression analysis showed that for the factors of the second and third groups (zinc, copper, nitrates, nitrites and polyphosphates) the main importance was the location that was expressed through the East coordinate grid (E) (Table 3). This can be explained by the presence of relatively constant sources of these substances.
Variable |
Temp |
Depth |
Secchi |
pH |
NO3 |
NO2 |
P-PO4 |
Porg |
Zn |
Depth |
–0.614* |
||||||||
Secchi |
–0.878* |
0.840* |
|||||||
pH |
–0.289 |
–0.165 |
0.062 |
||||||
NO3 |
0.218 |
0.255 |
–0.119 |
–0.808* |
|||||
NO2 |
0.767* |
–0.505 |
–0.736 |
–0.076 |
0.181 |
||||
P-PO4 |
0.802* |
–0.802* |
–0.809* |
0 |
0 |
0.817* |
|||
Porg |
0.543 |
0.15 |
-0.472 |
–0.151 |
0.162 |
0.627 |
0.233 |
||
Zn |
0.598* |
–0.709* |
–0.700* |
0.247 |
0.073 |
0.917* |
0.757* |
0.599 |
|
Cu |
–0.625* |
0.511 |
0.609* |
–0.165 |
–0.127 |
–0.823* |
–0.579 |
–0.786* |
–0.819* |
Cd |
0.232 |
0.36 |
0.14 |
–0.628* |
0.183 |
0.302 |
0.225 |
0.085 |
–0.444 |
Note – An asterisk denotes a statistically significant values, when p<0.05. |
|||||||||
Table 2 The coefficients of Spearman rank correlation between hydro-physical parameters, the content of biogenic elements and heavy metals in water of the Shardara Reservoir, June 2015.
Dependent Variable |
Step 3 |
|
Zinc
|
E b*=2.75 |
|
Temperature b*=–1.9 |
||
Secchi b=0.652 |
||
Copper |
E b*=–1.2 |
|
Secchi b=–0.56 |
||
Nitrates |
E b*=–2.4 |
|
Temperature b*=1.65 |
||
Secchi b= –1.5 |
||
Nitrites
|
E b*=2.72 |
|
Temperature b*=–1.8 |
|
|
Secchi b=0.657 |
||
Polyphosphates
|
E b*=1.83 |
|
Depth b*=1.16 |
||
Temperature b=–0.62 |
||
Cadmium |
Depth b*=1.20 |
|
Secchi b*=–1.0 |
||
Phosphates |
Temperature b*=1.09 |
|
Secchi b=0.773 |
||
Note: An asterisk denotes a statistically significant values, when p<0.05.Negative correlation is marked by bold. |
||
Table 3 The final step results of multiple regression analysis between the distributions of abiotic indicators across the waters of the Shardara reservoir, June 2015. Abbreviation as in Table1, and Secchi – water transparency with a Secchi disk, E - East coordinates .
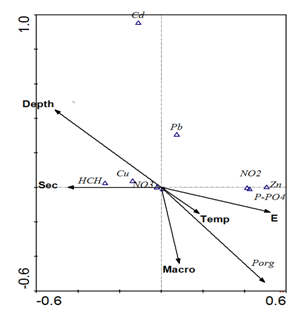
The hydro-chemical variables and the content of biogenic elements in June 2015 did not exceed the values, previously noted for the Shardara reservoir (Table 4). It can be seen that salinity was increased from deep water to water surface in the reservoir-type water bodies of Kazakhstan because high evaporation in arid climate. The low concentration of mineral phosphorus in the reservoir is due to regional and climatic features as in most water bodies in Kazakhstan,18 first of all, the lack of phosphates in the bedrock. Among analyzed heavy metals, we are finding copper and zinc in the greatest quantities, which was noted earlier (Table 4). These metals were not detected only in the first years of the reservoir existence.16 Compared to the previous years, copper and zinc concentration in water were increased from 2004towards the June of 2015, while the content of cadmium and lead did not go beyond the known values. Correlation analysis, canonical correspondence analysis, multivariate and regression analysis and spatial distribution of biogenic elements, heavy metals and pesticides across the water area allowed us to establish a connection with the sources of their entrance in the reservoir (Figure 1).
Parameter |
2004* |
2005* |
*1965-2006 |
2015 |
MPC |
||
|---|---|---|---|---|---|---|---|
Summer |
Autumn |
Summer |
Autumn |
June |
[11,12] |
||
Salinity, g dm-3 |
0.98 |
1.13 |
0.82 |
1.18 |
0.9-3.1 |
1.06 |
- |
NO3, mg dm-3 |
9.54 |
3.69 |
5.42 |
4.44 |
- |
5.45 |
40 |
NO2,mg dm-3 |
0.017 |
0.15 |
0.115 |
0.093 |
- |
0.092 |
0.08 |
NH4,mg dm-3 |
0.143 |
0.15 |
0.264 |
0.332 |
- |
0.115 |
0.5 |
P-PO4,mg dm-3 |
0.018 |
0.04 |
0.045 |
0.098 |
0.007-0.030 |
0.026 |
- |
Zn, mg dm-3 |
0.013 |
0.012 |
0.076 |
0.045 |
0.0-0.192 |
0.121 |
0.01 |
Cu, mg dm-3 |
0.006 |
0.011 |
0.014 |
0.03 |
0.0-0.053 |
0.04 |
0.001 |
Cd, mg dm-3 |
0.003 |
0.003 |
0.002 |
0.0025 |
- |
0.003 |
0.0005 |
Pb, mg dm-3 |
0.022 |
0.039 |
0.007 |
0.008 |
0.0001-0.029 |
0.034 |
0.01 |
ß-HCCH, µg dm-3 |
no data |
no data |
0.282 |
0.098 |
0.007-10.2 |
0.004 |
prohibited |
DDT, µgr dm-3 |
no data |
no data |
0.119 |
0.14 |
- | 0 |
prohibited |
Note:* – References[1-5, 16]. |
|||||||
Table 4 The interannual dynamics of averaged salinity, the content of biogenic elements and toxic substances in Shardara reservoir.
Copper, nitrates, HCCH isomers enter the reservoir mainly with drainage water discharged into the Arnasay bay from irrigated fields along the southern bank. Copper coming together with nitrates and pesticides reflects the nature of the chemical compounds used on agricultural fields on the southern bank. It is known that copper is a part of mineral supplements and compound fertilizers that are applied to grain, fodder and vegetables. The sources of nitrates are the nitrate fertilizers are sodium nitrate, calcium nitrate, ammonium nitrate that is used to increase the yield of many agricultural crops. A smaller amount of copper, nitrates and organ chlorine pesticides (OCP) has been brought into the reservoir with incoming rivers runoff. All of the compounds listed above may also be coming with the transit flow from the territory of Uzbekistan,19 where the population and area of irrigated fields are increase every year.20,21 The preferential relationship with the river runoff was identified for mineral phosphorus, polyphosphates, nitrites and zinc. The content of orthophosphates in the water significantly decreased in the direction from the upper reaches to the northwestern area of the reservoir, evidently, due to the absorption by advanced higher aquatic vegetation and phytoplankton. The number of polyphosphates along the longitudinal axis of the reservoir was reducing less actively compared to mineral phosphorus, which indicates a greater stability of these compounds in ecosystems. The synthetic polyphosphates are widely used in the domestic economy in addition to the industry. Hence the conclusion that in addition to the transit runoff of the Syrdarya River its source can be the Keles River. The Sary-Agash resort is located in its middle course, and there are settlements all along the riverbed. The water of this influx is also contaminated with heavy metals, the content of which, as the previous data have shown, may be higher than in waters of the Shardara Reservoir, in comparison (Table 5). The development of agriculture, air pollution22 and pollution of the Syrdarya River’s watershed, where the mining and processing of polymetallic ores takes place, cause the higher levels of copper and zinc concentrations in waters of the Shardara Reservoir in comparison with other reservoirs of Central Asia23,24 and referenced mountain reservoirs of Kazakhstan. It is also necessary to take into account that the runoff of the Syrdarya River and its tributaries is formed in the mountainous part of the basin, which includes groundwater. The groundwater of the region, depending on the individual mountain metallogenic specialties of the arrays, contains various ore components including zinc, lead from trace amounts to 0.3-1.0 mg dm-3, copper up to 0.01-0.08 mg dm-3, and cadmium up to 0.001-0.010 mg dm-3.25 It should be noted, however, that in the water of mountain lakes and rivers of South-Eastern Kazakhstan (Kungei Alatau), remote from industrial and agricultural areas, only copper was found at relatively high concentrations – up to 0.015 mg dm-3, while the zinc, lead, and cadmium content did not exceed 0.003-0.009 mg dm-3.26 According to our data of 2015, in the water of mountainous areas of reservoirs in South Kazakhstan (Talas Alatau), including the spring waters, cadmium was not detected, the chrome content reached 0.0-0.0039, copper – 0.0009-0.0141, nickel – 0.0-0.0045 mg dm-3. At low background concentrations of lead and zinc, the content of these metals reached 0.047-0.059 mg dm-3 in some river stretches. Thus, the high content of heavy metals in waters of the Shardara Reservoir may be caused not only by anthropogenic impacts, but also by natural conditions of river flow formation. Due to the absorption by advanced higher aquatic vegetation, phytoplankton or bacterioplankton, as bacteria are known to compete with phytoplankton for inorganic nitrogen and phosphorous, especially in situations of low nutrient concentration but it mostly clear for the marine environment.27 In our case in the mesotrophic to eutrophic reservoir, the phytoplankton can compete with the macrophytes for the dissolved organic carbon content in the reservoir water, but the macrophytes wins in the shallow southeastern part of the reservoir. Our first experience for the surface ecological mapping in the inland water bodies demonstrate easy mechanism for the visually revealing of chemical and biological variables that correlated or have opposite distribution in the water surface. This approach is new but similar to very productive soil metal mapping with special program28 whereas we used trivial and wide distributed Statistica 12.0 program. It is doing the ecological mapping as productive mechanism for monitoring.
Title |
Pb, mg dm-3 |
Cd, mg dm-3 |
Cu, mg dm-3 |
Zn, mg dm-3 |
Keles River |
0.067 |
0.004 |
0.008 |
0.031 |
Syrdarya River upstream of Keles River |
0.045 |
0.003 |
0.005 |
0.021 |
Table 5 The content of heavy metals in the water of Syrdarya River and Keles River, spring 2004.
The use of different statistical methods of data analysis revealed the correlation between spatial distribution of hydro-chemical and toxic variables with sources of pollution of the Shardara Reservoir. Using as first approach, spatial distribution statistical methods help to correlate the reservoir water parameters across the reservoir surface. Copper, nitrates, and HCCH isomers enter the reservoir primarily come from river runoff water discharged into the Arnasaybay from irrigated fields along the southern bank of the reservoir, and the mineral phosphorus, polyphosphates, nitrites and zinc primarily come with river runoff. Increased levels of heavy metals in the water could also be related to natural causes, as the water reservoir and its tributaries are located in a metallogenic province.29
The work was carried out under the project № 1846/ГФ4 Г.2015-Г2016 for Committee of Science, Ministry of Education and Science, Republic of Kazakhstan "Development of the methods for controlling the ecological state of water bodies in Kazakhstan" as well as partly supported by the Israeli Ministry of Absorption.
The author declares no conflict of interest.

©2017 Krupa, et al. This is an open access article distributed under the terms of the, which permits unrestricted use, distribution, and build upon your work non-commercially.