MOJ
eISSN: 2573-2919


Research Article Volume 2 Issue 3
1Institute of Evolution, University of Haifa, Israel
2Institute ofHydrobiologyof NAS of Ukraine, Ukraine
Correspondence: Barinova SS, Institute of Evolution, University of Haifa, Mount Carmel, 199 Abba Khoushi Ave., Haifa 3498838, Israel
Received: March 04, 2017 | Published: May 24, 2017
Citation: Barinova SS, Protasov AA, Novoselova TN. Spatial analysis of environmental and biological variables in the techno-ecosystem of the khmelnitsky nuclear power plant with new statistical approach. MOJ Eco Environ Sci. 2017;2(3):114-119 DOI: 10.15406/mojes.2017.02.00024
We analyzed the distribution of biological and environmental variables in the waters of the Khmelnitsky Nuclear Power Plant (KhNPP) in summer of 2014. The statistical methods were used for the correlation, multiple regression analysis, canonical correspondence analysis, comparative floristic, and ecological mapping with the Statistica 12.0 Program. It was found that the hot water flow is divides pool body into three different parts. The pool community was correspondingly formed three species cores with centers in the station of hot water, standing water, and major body pool water. Statistical approach show that not only water temperature plays the role in aquatic community regulation but also water flow and concentration of nutrients. Only three stations 9, 29, and 54 were selected and proposed for monitoring in which the community is expressed its reaction on the environment heterogeneity.
Keywords: nuclear power plant, cooling pool, statistics, ecological mapping, KhNPP reservoir, ukraine
Lakes and lake-type water bodies such as wetlands, estuaries, and reservoirs, including the cooling pond plants are important as sources and collectors of water. In addition, the cooling pond is part of the technological cycle, the operation of which is recycling of hot water. The ecosystem of each of these types of water bodies is open and is involved in the processing of entering her chemical substances or leveling variables such as water temperature. In any case, it is important to assess the state of ecosystems, expressed in biological, hydro-chemical and hydro-physical parameters. For properly assess the condition of the water body it is also important to understand the interaction of different levels of parameters. Existing models send us back to the principles of communication and interaction between the different parts of the pond ecosystem. Are lot options of assessment on the base of observational data for the mass of parameters of the water body, they, however, not showing the whole picture.
The phytoplankton and zooplankton abundance in the cooling pond at the Khmelnitsky Nuclear Power Plant (KhNPP) was characterized by heterogeneity that because the regulation of the ecosystem and control of major variables are represent rather problem. The aim of present study was to find the new methods for analyzing of the pool ecosystem variables in purpose to revealing of the sufficient relationships between biotic and abiotic variables that can be monitored in future.
Sampling and Chemical analysis
The cooling pond of the KhNPP was examined in the summer seasons of 2014 during the operation of one unit of the NPP. The material for the application of new methods of analysis was the observations of hydrochemical, hydro physical and hydro biological parameters of the cooling pond on 12 stations. The data about environmental variables was taken with standard methods.1
Statistical calculation
For analysis and plots construction were used the programs:
Description of studied site
The cooling pond at the Khmelnitsky NPP (KhNPP) (Figure 1) is a reservoir filled in 1986 with waters of the Gniloy Rog River as well as with the Goryn’ River (as the upper part of the Pripyat’ River, Dnieper-Southern Bug FEOW basin, Figure 1), and operated from 1987. The area of this pond is 15.4 km2 and the volume is approximately 150 million m3, surface area is 20 km2, the slowness of the coastline is 20.4 km, the average depth is about 6 m with maximal 12 m.5 In the north this pond is limited by an earthen dam 6.85 km long faced with concrete to the bottom (depth, 7–8 m), and then (3 km) with rubble. The water volume in the intake canal is approximately 0.8 million m3. The cooling pond was spontaneously invaded by the Zebra mussel (Dreissena polymorpha Pall.) in 2004.6 The problem of the Zebra mussel was increase during next years and it have a maximal value up to 2 kg m2 in benthos and up to 7 kg m2 in periphyton in 2008, and then decrease.7
The sampling stations for current analysis were chosen in the flow of the hot water in the cooling pool. Table 1 demonstrated decreasing of water temperature in the water flow direction from 26.2 to 22.3 C˚ (Figure 1). Environmental variables besides the water temperature gradient fluctuated in small range. We have not identified specific patterns in the distribution of the parameters of the water and biota on the temperature gradient, except for the index Shannon (abundance). Therefore, it allows us to implement few statistic methods for analysis of distribution for chemical and biological variables. The phytoplankton and zooplankton species is dependent each other in ecosystem but for the first level of the trophic pyramid (phytoplankton) are very important concentrations of major nutrients such as nitrates and phosphates. We constructed the Surface plot for the KhNPP cooling pool phytoplankton abundance and nitrates and phosphates concentration in the pool water in same period. Figure 2 shows that phosphates are not limited factor for the autotrophic community but algal abundance was very stimulated by nitrates in the water. The second step for analysis of the pool community peculiarity was revealing the species distribution comparison with the GRAPHS program. Figure 3 shows that phytoplankton species were formed two different clusters for stations in general of hot and temperate temperature of the pool water. But can be seen that second cluster was partly enriched by station from temperate zone. Therefore, not only water temperature is the regulating factor. Figure 4 with the dendrite of phytoplankton similarity show that community was divided into 3 community cores with centers in stations 9 (pond center), 29 (south bay standing water mass), and 54 (cooled water output). Therefore, not only temperature gradient plays regulating role for the pool community but also factors of differentiation of the pool water mass into different parts. For the next step of analysis we constructed series of statistically generated maps for each of biotic and environmental variable of the KhNPP cooling pool. Statistically mapped variables for the pond surfaces in 2014 demonstrated that the water temperature (Figure 5A) was high in the input only. Water transparency (Figure 5B) was highest in the north part of the pool, whereas the phytoplankton abundance (Figure 5C) and biomass (Figure 5D)in the south. Zooplankton abundance (Figure 5E), biomass (Figure 5F), energy (Figure 5), as well as the average algal cell volume (Figure 5h) was highest in the northern part of the pool where the water temperature decreased (Figure 1D).
Station, Variable |
32 |
86 |
49 |
18 |
70 |
12 |
7 |
5 |
9 |
29 |
54 |
31 |
North |
50.17.269 |
50.17.205 |
50.16.286 |
50.18.372 |
50.17.498 |
50.18.207 |
50.18.080 |
50.18.071 |
50.17.454 |
50.16.414 |
50.18.169 |
50.18.008 |
East |
26.36.086 |
26.35.599 |
26.36.010 |
26.35.236 |
26.33.332 |
26.33.584 |
26.35.302 |
26.34.319 |
26.35.059 |
26.35.456 |
26.37.326 |
26.36.274 |
Temperature, C˚ |
26.2 |
23.7 |
23 |
22.9 |
22.7 |
22.7 |
22.8 |
22.6 |
22.5 |
22.6 |
22.2 |
22.3 |
Transparency, m |
1.7 |
1.6 |
1.4 |
2.6 |
2 |
2 |
2.5 |
2 |
2.1 |
1.4 |
2 |
2.1 |
Phytoplankton abundance, , cell 103 dm3 |
34306.4 |
28976.4 |
42812 |
13697.6 |
33464.2 |
37399.4 |
20592 |
17879.4 |
22599.2 |
46123 |
22425 |
15989.4 |
Phytoplankton biomass, mg dm3 |
1.9346 |
1.247 |
3.3644 |
1.0244 |
2.3438 |
3.4531 |
1.2993 |
1.1115 |
1.6621 |
4.1089 |
1.5458 |
1.9344 |
Average cell volume, mg |
0.0563918 |
0.043035 |
0.0785854 |
0.0747868 |
0.070039 |
0.09233 |
0.063097 |
0.062167 |
0.073547 |
0.089086 |
0.068932 |
0.12098 |
Index Shannon H (abundance) |
0.604 |
0.566 |
1.376 |
1.642 |
1.299 |
1.379 |
1.475 |
0.947 |
1.334 |
1.049 |
1.267 |
1.117 |
Index Shannon H (biomass) |
2.284 |
1.695 |
3.034 |
2.676 |
2.862 |
2.51 |
2.296 |
2.621 |
2.561 |
2.874 |
2.531 |
2.624 |
Index saprobity S |
1.82 |
1.83 |
1.91 |
1.97 |
1.89 |
1.87 |
1.98 |
1.85 |
1.92 |
1.8 |
1.9 |
1.85 |
No of algal Species |
12 |
12 |
24 |
16 |
16 |
15 |
10 |
16 |
11 |
19 |
11 |
11 |
N% Cyanobacteria |
97 |
98.2 |
93.2 |
89.3 |
92 |
86.4 |
92.3 |
94.3 |
93.1 |
87.5 |
93.1 |
90.6 |
N% Dinophyta |
0 |
0 |
0.2 |
0 |
0.1 |
0 |
0.1 |
0 |
0 |
0 |
0.1 |
0.2 |
N% Сryptophyta |
1.9 |
0.6 |
3.7 |
6.7 |
5.8 |
8.5 |
5.6 |
1.4 |
4.3 |
7.2 |
5.9 |
7.6 |
N% Euglenophyta |
0 |
0 |
0.1 |
0 |
0.1 |
0 |
0 |
0.1 |
0 |
0 |
0 |
0 |
N% Chlorophyta |
0.8 |
0.8 |
1.9 |
3.4 |
1.5 |
4.8 |
1.9 |
3.7 |
2.5 |
3.4 |
0.6 |
1.3 |
N% Bacillariophyta |
0.3 |
0.4 |
1 |
0.7 |
0.5 |
0.2 |
0.2 |
0.5 |
0.01 |
1.8 |
0.3 |
0.3 |
В% Cyanobacteria |
53.5 |
70.2 |
27.9 |
22.2 |
33.4 |
37.4 |
26.5 |
45.4 |
29 |
31.5 |
32.8 |
21.7 |
В% Dinophyta |
0 |
0 |
33.7 |
0 |
14.3 |
13.5 |
33.5 |
0 |
15.5 |
0 |
20.8 |
32.3 |
В% Сryptophyta |
7.4 |
6.2 |
10.6 |
31 |
22.5 |
36 |
31.5 |
8.2 |
20.4 |
15.7 |
27 |
20.7 |
B% Euglenophyta |
0 |
0 |
0.7 |
0 |
0.5 |
0 |
0 |
0.8 |
3.3 |
0.3 |
0 |
0 |
В% Chlorophyta |
7.8 |
8.3 |
6.4 |
34.9 |
17.9 |
11.8 |
8.4 |
23.2 |
29.7 |
8.8 |
1.9 |
6.2 |
В% Bacillariophyta |
31.3 |
15.3 |
20.6 |
12 |
11.5 |
1.3 |
0.1 |
22.4 |
2.1 |
43.7 |
17.5 |
19.1 |
Charophyta No Species |
0 |
0 |
0 |
0 |
0 |
0 |
0 |
1 |
0 |
0 |
0 |
0 |
Bacillariophyta No Species |
5 |
4 |
11 |
6 |
3 |
2 |
1 |
2 |
1 |
6 |
3 |
3 |
Chlorophyta No Species |
3 |
4 |
6 |
5 |
6 |
8 |
4 |
8 |
4 |
8 |
3 |
2 |
Cryptophyta No Species |
2 |
2 |
2 |
2 |
2 |
2 |
2 |
2 |
2 |
2 |
2 |
2 |
Cyanobacteria No Species |
2 |
2 |
2 |
3 |
2 |
2 |
2 |
2 |
2 |
2 |
2 |
3 |
Dinophyta No Species |
0 |
0 |
2 |
0 |
2 |
1 |
1 |
0 |
1 |
0 |
1 |
1 |
Euglenophyta No Species |
0 |
0 |
1 |
0 |
1 |
0 |
0 |
1 |
1 |
1 |
0 |
0 |
Zooplankton abundance, org. dm3 |
57912 |
228668 |
165111 |
334937 |
271416 |
264150 |
635290 |
397078 |
177769 |
- |
702500 |
432291 |
Zooplankton biomassmg dm3 |
640.73 |
4425.45 |
1300.73 |
7350.31 |
5441.27 |
9543.63 |
10697.2 |
14486.6 |
4931.99 |
- |
18965.9 |
7291.76 |
Zooplankton energy, kcal |
35.87414 |
144.6396 |
62.09338 |
223.0669 |
166.543 |
230.316 |
321.198 |
354.983 |
130.849 |
- |
502.57 |
213.7643 |
Table 1 Environmental and biological data from the major monitoring stations of KhNPP in summer 2014. Stations in the Table are placed in the direction the water current and temperature gradient
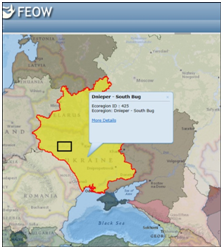
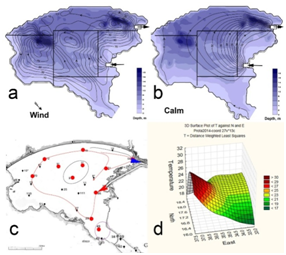
Figure 1 Map of cooling pond at the Khmelnitsky NPP on the FEOW (upper, black rectangle) and water mass formation (below) in windy (A) and calmly (B) weather. Map of sampling points (red points) in August 2014 (C) with input (red arrow), output (blue arrow) of hot water with flow direction (red line). Distance weight least squares surface plot of the water temperature distribution in the KhNPP cooling pool surface in August 2014 (D).
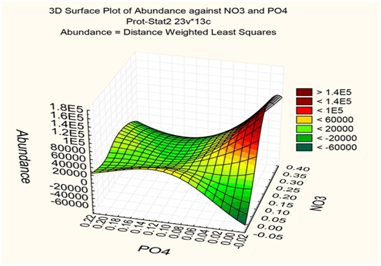
Figure 2 Distance weight least squares surface plot of the phytoplankton abundance and water phosphates and nitrates distribution in the KhNPP cooling pool surface in August 2014.
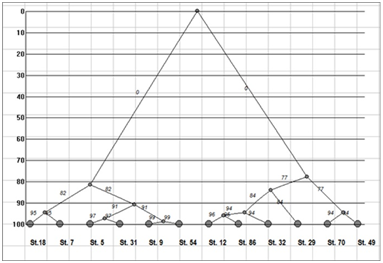
Figure 3 Dendrogram of the phytoplankton community similarity in the KhNPP cooling pool, August 2014.
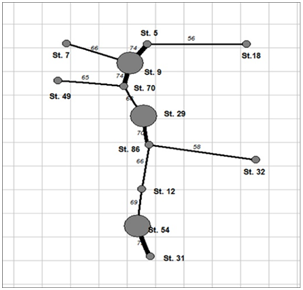
Figure 4 Dendrite of the phytoplankton community overlapping in the KhNPP cooling pool, August 2014.
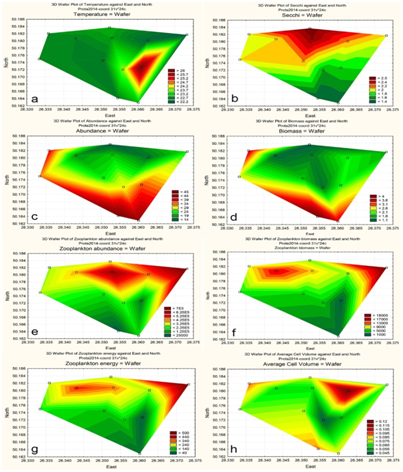
Figure 5 Statistically mapped variables in the KhNPP cooling pond surfaces in 2014: Water temperature (A); Water transparency (B); Algal abundance (C); Algal biomass (D); Zooplankton abundance (E); Zooplankton biomass (F); Zooplankton energy (G); Average algal cell volume (H).
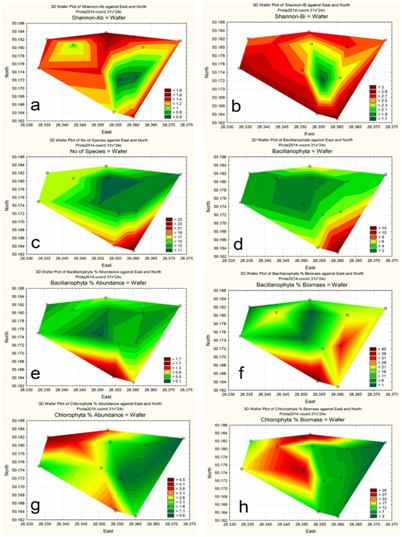
Figure 6 Statistically mapped variables in the KhNPP cooling pond surfaces in 2014: Index Shannon, abundance (A); Index Shannon, biomass (B); No of Species (C); Bacillariophyta, No of Species (D); Bacillariophyta, % of Abundance (E); Bacillariophyta, % of Biomass (F); Chlorophyta, No of Species (G); Chlorophyta, % of Biomass (H).
The phytoplankton community structure uniformity was assessed with the Shannon index. Figure 6A,B show the lowest index zone near the hot water input. It means hot and high speed waters are impacted the phytoplankton community in the cooling pool.
Figure 6C demonstrated that pool community flourishes in the southern bay mostly with diatoms (Figure 6D,E,F; 7A). The green algae well developed in the opposite part of the pool where the temperature of water was lower.
The Charophyta and Cyanobacteria species richness was greater in the temperate water (Figure 7B,Figure 7C). But the Cyanobacteria abundance (Figure 7D) shows that hot waters give him preference in flourish. The dinophytes and euglenoids flagellate cells avoid the high speed waters and concentrated in the still and temperate temperature peripheric parts of the pool (Figure 7E,Figure 7F). It means that not only water temperature but also water flow are the impact factors for the KhNPP cooling pool community. In purpose to reveal the major factors that influenced KhNPP cooling pool community, we calculated the Pearson correlation coefficients for major variables (Table 2). Can be seen that water pH and transparency were suppressed the algal community productivity the water output (Figure 1) but stimulated with nitrates. Community structure with Shannon index and productivity of green algae were negatively correlated with water phosphates. The diatoms and zooplankton biomass were negatively correlated with water pH and nitrates respectively. Well oxygenated waters was stimulate the community consolidation, but impacted of cyanobacterial productivity. Water temperature negatively correlated with index Shannon and zooplankton productivity. The water transparency gives the best environment for the non-cyanobacterial part of the pool community. The relationships between environmental variables and the phytoplankton species abundance in Division levels of the KhNPP cooling pool are represents in CCA plot (Figure 8). Can be seen that the major environmental variables are formed two pars with influence in opposite directions. The oxygen and sulfates were stimulating factors for the euglenoids productivity, whereas phosphates were opposite. The euglenoids and diatom abundance were higher with nitrates but water transparency was opposite. The water temperature stimulates the cyanobacteria abundance only.
The same analysis for the biomass shows that water temperature and nitrates were stimulating factors for the diatom biomass whereas other Divisions productivity was indifferent (Figure 9). The final step of analysis is represented in Table 3. We calculated the backward stepwise regression for the KhNPP in summer 2014. Dependent variables that show significant correlation with environmental variables are in the first column of the table. The calculation results show that species richness and index saprobity S are dependent with water transparency and algal biomass. In the same time algal abundance and biomass correlated each other and average cell mass in community. Algal abundance have the opposite correlation with water transparency and index Shannon. The available nutrients content that reflected in the Index saprobity S has positive correlation with index of community structure – Shannon. The cyanobacteria abundance was positively correlated with the total algal abundance, average call volume and index saprobity S and zooplankton biomass but other variables such as total biomass, water transparency and zooplankton energy were opposite. Only diatom biomass was slightly stimulated with available organic matter that reflected in the Index saprobity S.
Variable |
рН |
SO4 |
N-NO3 |
P-PO4 |
Oxygen |
Temperature |
Secchi |
Abundance |
-0.70* |
0.73* |
-0.90** |
||||
Biomass |
-0.71* |
0.74* |
-0.91** |
||||
H-Ab |
-0.80* |
0.93* |
-0.80* |
-0.80* |
|||
H-Bi |
-0.87* |
0.82* |
0.82* |
-0.64* |
|||
Index S |
0.65* |
0.83* |
|||||
Bacillariophyta |
0.76** |
-0.89** |
-0.71* |
||||
Chlorophyta |
0.76** |
||||||
Cyanobacteria |
-0.77* |
0.69* |
|||||
N-Cyanobacteria |
-0.71* |
||||||
N-Chlorophyta |
0.78* |
||||||
N-Zooplankton |
-0.72** |
||||||
B-Cyanobacteria |
0.92*** |
||||||
B-Chlorophyta |
0.76* |
||||||
B-Bacillariophyta |
-0.85* |
0.86* |
|||||
B-Zooplankton |
0.78* |
-0.71* |
|||||
ZooplanktonEnergy |
0.85* |
Table 2 Pearson correlation coefficients for environmental and biological variables in cooling pool of the Khmelnitsky Power Station in 2014. N- abundance; B – biomass; H – Index Shannon. Negatively correlated variables are marked in bold. Statistical significance, p-value: <0.05 = *; <0.01 = **; <0.001 = ***
Dependent variable |
Step 1 |
Step 2 |
Step 3 |
Step4 |
Step 5 |
Step 6 |
Step 7 |
Step 8 |
Step 9 |
Step 10 |
Variable Index S |
Secchi 0.57** |
Secchi 0.51** |
- |
- |
- |
- |
- |
- |
- |
- |
No of Species |
Bi |
- |
- |
- |
- |
- |
- |
- |
- |
- |
0.33* |
Bi, Avercell 0.96*** |
Bi, Avercell, T |
Bi, Avercell 0.98*** |
- |
- |
- |
- |
- |
- |
|
Abundance |
Bi |
|||||||||
0.74*** |
Ab, Avercell |
0.98*** |
Ab, |
Ab, Avercell |
Ab, Avercell |
Ab, Avercell |
Ab, Avercell |
- |
- |
|
Biomass |
Ab, Avercell |
Ab, |
||||||||
0.97*** |
0.97*** |
Avercell |
Avercell |
0.99*** |
0.99*** |
0.98** |
0.98* |
|||
0.98*** |
0.98*** |
|||||||||
Average cell volume |
Bi, Ab |
Bi, Ab |
Bi, Ab |
Bi, Ab |
Bi, Ab |
- |
- |
- |
- |
- |
0.88*** |
0.59*** |
0.90*** |
0.89** |
0.98** |
||||||
Secchi |
Ab |
S, Ab0.77*** |
S |
S |
S |
S |
- |
- |
- |
- |
0.62** |
0.77** |
0.78** |
0.70* |
0.79* |
||||||
Shannon (Ab) |
Bi, S, Ab |
S, Bi |
S, Bi, Avercell |
S, Bi |
S, Ze, Za, |
S, Ze, Za, |
S, Bi |
S, Bi |
S, Bi |
- |
0.94*** |
0.84*** |
0.90*** |
0.91*** |
Bi, Aver cell |
Bi, Aver cell |
0.97*** |
0.99** |
0.87* |
||
0.96*** |
0.96*** |
|||||||||
Cyanobacteriaabundance |
Ze, Zb, Bi, Ab, Za, Aver cell, Secchi, S |
Ze, Zb, Bi, Ab, Secchi |
- |
- |
- |
- |
- |
- |
- |
- |
0.98** |
0.98* |
|||||||||
Cyanobacteriabiomass |
Bi, Ab, S |
Bi, Ab, S |
Bi, Ab, S |
Bi, Ab |
Bi, Ab |
- |
- |
- |
- |
- |
0.81*** |
0.80** |
0.78** |
0.71* |
0.69* |
||||||
Bacillariophytaabundance |
Sp |
Bi |
- |
- |
- |
- |
- |
- |
Zb, Ze, Bi, Ab, Aver cell, S, Sp |
Zb, Bi, Ze, Ab, Aver cell |
0.49** |
0.32* |
0.82* |
0.80* |
|||||||
Bacillariophytabiomass |
S |
S |
S |
- |
- |
- |
- |
- |
- |
- |
0.44* |
0.41* |
0.36* |
Table 3 Backward stepwise regression analysis results for the KhNPP in summer 2014. Negatively correlated variables are marked in bold. Abbreviations:Aver cell – average volume of phytoplankton cell; Secchi – water transparency; T – water temperature; Ab – phytoplankton abundance; Bi – phytoplankton biomass; S – index saprobity S; Ze – zooplankton energy; Zb – zooplankton biomass; Za – zooplankton abundance; Sp – No of species in phytoplankton community. Statistical significance , p-value: <0.05 = *; <0.01 = **; <0.001 = ***
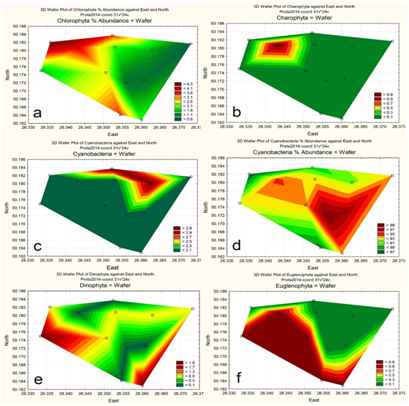
Figure 7 Statistically mapped variables in the KhNPP cooling pond surfaces in 2014: Chlorophyta, % of Abundance (A); Charophyta, No of Species (B); Cyanobacteria, No of Species (C); Cyanobacteria, % of Abundance (D); Dinophyta, No of Species (E); Euglenophyta, No of Species (F).
Current analysis help us to conclude that the environmental and biotic variables in the KhNPP cooling pool show heterogeneity but varied in small range. Itdoes a problemfor definition of the monitoring points and variables such as in the Sasyk reservoir in Ukraine.8 The statistically generated maps method was helpful in the similar situation in the Sasyk reservoir as well as in the Shardara reservoir in southern Kazakhstan.9
The analysis of the major biotic and environmental variables of the KhNPP cooling pool ecosystem let us to reveal the situation in which the hot water flow is divides pool body into three different parts. The pool communities were correspondingly formed three species cores with centers in the station of northern output of cooled water, standing water southern bay, and major body pool. Statistical approach to complicated relationships in the water body ecosystem help us to reveal that not only the water temperature play the major role in aquatic community structure and productivity but also water flow and concentration of nutrients. The ecosystem reaction on this parameters gradient let us to highlight only three stations 9, 29, and 54 for monitoring during calm period in which the cooling pool community are expressed its reaction on the environment heterogeneity. The distribution of variables over the pool surface is dependent to wind direction and therefore can be monitored in more number of stations that can be revealed after followed analysis during the windy period. Our experience for the surface ecological mapping in the inland water bodies demonstrate easy mechanism for the visually revealing of chemical and biological variables that correlated or have opposite distribution in the water surface. This approach is new but need not any special mapping program but only trivial and wide distributed Statistica 12.0 program. It is doing the ecological mapping as productive mechanism for monitoring.
The work was partly supported by the Israeli Ministry of Absorption.
The author declares no conflict of interest.

©2017 Barinova, et al. This is an open access article distributed under the terms of the, which permits unrestricted use, distribution, and build upon your work non-commercially.