MOJ
eISSN: 2573-2919


Research Article Volume 8 Issue 5
Biology Department, Faculty of Science, Ankara University, Turkey
Correspondence: Atila Yıldız, Biology Department, Faculty of Science, Ankara University, TR – 06100, Tandoğan, Ankara, Turkey, Tel +90.312.2168713, Fax +90.312.2868900
Received: September 26, 2023 | Published: October 17, 2023
Citation: Isik V, Aydin SS,Yildiz A. Heavy metal biomonitoring study using transplanted lichen, Pseudevernia furfuracea (L.) Zopf, in Kirikkale, Turkey. MOJ Eco Environ Sci. 2023;8(5):192-200. DOI: 10.15406/mojes.2023.08.00292
Pollutants in the air and heavy metals are regarded as significant contributors to environmental problems. These environmental issues have a wide range of consequences for living organisms. Heavy metals and contaminants have the potential to alter the makeup and flexibility of cellular frameworks, preventing plant and lichen species from absorbing water and nutrients. Lichen thalli can absorb heavy metals through their cell walls. Lichens are more susceptible to environmental stress than other vascular and non-vascular plants.
The goal of this research was to find out the levels of air pollution in Kırıkkale and to generate a city air pollution image using Pseudevernia furfuracea (L.) Zopf as bioindicator organisms. In November 2002, lichen specimens were taken from an uncontaminated area in the Yapraklı Mountains in Çankırı city and transplanted to 11 various locations in Kırıkkale. Lichen samples were collected twice after 3 and 6 months of exposure. Inductively Coupled Plasma (ICP) spectrometry was used to measure the heavy metals, Cu, Cd, Mn, Ni, Pb, and Zn contents. The chlorophyll a and b concentrations were measured and also the chlorophyll a+b, a/b, and b/a ratios were calculated as well. According to the findings of P. furfuracea heavy metal analyses, contents of heavy metals were found to be in first period in range of 0.23–0.45 μg g−1, 0,013–0,020 μg g−1, 1,83–2,61 μg g−1, 0,21–0,59 μg g−1,0.37–0,80 μg g−1, and 0,17–2,10 μg g−1, in second period in range of 0,31-0,77 μg g−1,0,014-0,026 μg g−1 ,1,97-3,06 μg g−1 ,0,24-0,63 μg g−1 , 0,45-1,25 μg g−1 and 0,23-6,74 μg g−1 for Cu, Cd, Mn, Ni, Pb, and Zn. Among the reasons for the high values, traffic, autumn-winter heating activities and industrial activities can be mentioned. At 4th and 8th stations with heavy metal accumulation, chlorophyll degradation (0,22 and 0,18 ugr/ml) had started to be observed. These findings showed that P. furfuracea have a high potential for biomonitoring heavy metals in air pollution researches.
Keywords: heavy metals, biomonitoring, Pseudevernia furfuracea, lichen bags technique, air pollution, Kırıkkale
For many years, several lichen species have been effectively used to assess the atmospheric deposition of heavy metals and toxic chemicals in polluted areas.1–7 Lichens were among the first organisms used as bioindicators to detect environmental changes induced by chemical contamination.8,9 Numerous research investigations have shown that they can absorb and collect pollutants. They are therefore commonly employed to monitor radionuclides, metals and other compounds present in the atmosphere.10–12 Lichens seem to accumulate heavy metals in a way as follows. An ion exchange mechanism specifically binds metal ions to the cell membrane;13–15 some metals may then be carried into cells, where they are metabolized and eliminated, or they may cause the thallus to die.15,16 Lichens represent high sensitivity to changed habitats.17 As a result, the abundance of the most sensitive lichen species can be used to evaluate air quality.18–33
Lichens exist naturally in many terrestrial habitats, however their absence in urban environments may be due to human influences. In such instances, passive biomonitoring becomes ineffective, and active biomonitoring take its place. One strategy is to expose lichen-containing bags in a polluted location to assess the quantities of pollutants impacting the sample.34–39 If spontaneous lichens are not present or their colonization is limited, lichen biomonitoring can still be carried out by transplanting healthy samples from a remote place into the area to be observed. The transplanting method was chosen because lichen colonization in the research area was insufficient to undertake atmospheric monitoring using in situ populations. Significant benefits of employing lichen transplants are the range of experimental designs that may be used, as well as the knowledge of the element concentrations at the start of the monitoring activity and the exposure length.40
Pseudevernia furfuracea (L.) Zopf is an epiphytic, cosmopolitan, fruticose-foliose lichen, widespread in Europe and Asia. P. furfuracea is commonly preferred due to its growing use as a bioindicator organism in biomonitoring investigations in a variety of environmental situations, its high availability, resistance to gaseous phytotoxic pollutants (e.g. SO2 and NOx), tolerance to climatic stressors, and ability to absorb heavy metals from solutions and to accumulate heavy metals (Cr, Zn, Cd, Pb, Ni, Fe, Mn and Cu) sequestration.41,42
P. furfuracea had been widely used in transplanted studies before. Since P. furfuracea colonization in urban area of Kırıkkale is insufficient to undertake atmospheric monitoring using in situ populations, the bag technique was used in the transplanting method to monitor the urban air pollution of the arbitrarily selected stations. In this technique, the bags consisted of a nylon net containing water-washed lichens. Since the lichens in the bags had no connection with the soil, the possibility of contamination by root uptake was eliminated. Although the ''bag technique'' is not completely defined in terms of the amount of plant material, exposure time, association to airborne depositions, and form of uptake (essentially passive due to atmospheric particulate entrapment and cation exchange capacity of extracellular binding sites or active due to biochemical activities of plasma membrane and cytoplasm), it has the advantage of collecting information integrated over the entire exposure time.32,41 We transplanted thalli of the lichen P. furfuracea in the research area at 11 experimental locations after collecting with their supporting substrate (tree twigs) from a remote site (Yapraklı-Çankırı forest region) at about 1700 m a.s.l.. To avoid vandalism and reduce any geogenic contribution to element trapping by the lichens, two lichen bags were fastened to tree branches or poles with plastic cords at a height of approximately 3 m above ground at each transplanting location.
The main objective of this study was to identify the spatial pattern of heavy metal accumulation (Zn, Cd, Pb, Ni, Mn, Cu) in the thalli of the lichen P. furfuracea transplanted in the city center of Kırıkkale, where the major contributors to atmospheric element enrichment are primarily houses, traffic, and industrial activities. Particularly we (i) analysed the amount of heavy metals in each station and the causative factor, (ii) created a pollution map based on heavy metal content, (iii) determined the changes in chlorophyll content in relation to heavy metal accumulation.
Study area
Kırıkkale has a population of 280.834 individuals and is located in Central Anatolia (according to the 2000 census) (Figure 1) (Figure 2).43 Among the important industries in the city are the arms industry, steel industry, oil refinery, production of electrical machinery, brick-tile production and flour production. As a result of the activities of these facilities, the concentration of SO2, H2S, NO, NO2, CO, heavy metals, CO2 and particulate matter in Kırıkkale city atmosphere increases. Highways and heating activities at homes are among the primary causes of contaminations in the air of Kırıkkale. Because the wettest months of the year are spring and early summer, Kırıkkale has an arid summer regional climate with humid regional climate traits. Depending on location and height, the province exhibits all four of these regional climate subtypes. The city is situated in the province's transitional area. Summers are typically hot and dry, while winters are typically frigid and snowy.44 The climate diagram of Kırıkkale was given in Figure 3. The predominant winds are from NNW, NW, SSW (Figure 4).45 As monitoring locations, 12 exposure locations in the city of Kırıkkale were chosen (Table 1). The samples taken from the forest area of Yapraklı-Çankırı were generally hung in the places with high traffic in the city (1,2,3,4,5,6,7,8,9,10 and 12 stations), only the 11th station is near the steel industry (ÇELBOR steel industry). And since the period of exposure to pollution coincides with autumn and winter months, urban domestic heating activities are intense in the areas where the stations are located.
|
Station no |
Station |
Substrate of the specimens |
Altitude of the station (GPS)(m) |
Coordinates |
|
C1 |
Çankırı-Yapraklı, Yapraklı Büyük Plateau, Dikilitaş area (control group) |
Pinus sylvestris |
1750 m |
N 40º 47' 600'' |
|
E 33º 46' 818'' |
||||
|
C2 |
Çankırı-Yapraklı, Yapraklı Büyük Plateau, Dikilitaş area (control group) |
Pinus sylvestris |
1750 m |
N 40º 47' 600'' |
|
E 33º 46' 818'' |
||||
|
1 |
Kırıkkale- Millet Street, in front of train station, Çınar Dibi tea garden |
Fraxinus sp. |
770 m |
N 39º 50' 261'' |
|
E 33º 30' 215'' |
||||
|
2 |
Kırıkkale- Station Bridge, Bağdat street., Kayseri raod section, in front of taxi stop |
Salix sp. |
714 m |
N 39º 49' 679'' |
|
E 33º 28' 806'' |
||||
|
3 |
Kırıkkale- Samsun Highway, opposite of Çalkan gas station |
Populus alba |
771 m |
N 39º 51' 268'' |
|
E 33º 29' 419'' |
||||
|
4 |
Kırıkkale- Samsun highway, industry intersection, Nokta exit, Ali İhsan Kalmaz Park, Middle centre strip |
Robinia pseudoacacia |
724 m |
N 39º 50' 607'' |
|
E 33º 31' 225'' |
||||
|
5 |
Kırıkkale- Samsun Highway, next to Akşemsettin square, opposite of Opet. |
Populus sp. |
750 m |
N 39º 50' 971'' |
|
E 33º 50' 132'' |
||||
|
6 |
Kırıkkale- Ankara- Samsun Highway, First bridge (Kırıkkale- Çorum) |
Populus alba |
803 m |
N 39º 52' 397'' |
|
E 33º 35' 035'' |
||||
|
7 |
Kırıkkale- Ankara- Samsun Highway, Osmangazi square, second bridge (Kırıkkale- Çorum) |
Quercus sp. |
815 m |
N 39º 52' 112'' |
|
E 33º 32' 700'' |
||||
|
8 |
Kırıkkale- Ankara- Samsun- Kayseri Highway, intersection point, traffic signalhood |
Traffic Signalhood |
724 m |
N 39º 51' 807'' |
|
E 33º 28' 830'' |
||||
|
9 |
Kırıkkale- Atatürk Avenue, next to Atatürk Park |
Fraxinus sp. |
742 m |
N 39º 50' 693'' |
|
E 33º 30' 001'' |
||||
|
10 |
Kırıkkale- Zafer street., near the Kızılkanat trade center, Köksallar shoe store |
Platanus orientalis |
754 m |
N 39º 50' 593'' |
|
E 33º 30' 343'' |
||||
|
11 |
Kırıkkale- Kayseri- Keskin road, ÇELBOR crossroad |
Fraxinus sp. |
675 m |
N 39º 48' 915'' |
|
|
|
|
E 33º 29' 238'' |
Table 1 Locations of the stations
Biological material
P. furfuracea is a lichen with a wide tallus, widely used in biomonitoring studies due to its ability to accumulate heavy metals, and tolerant to heavy metals up to a certain level, so it was preferred in this study. Lichen samples were collected in the Yapraklı-Çankırı forest and 2 station in Yapraklı-Çankırı forest were chosen as control station in order to compare with other inner-city 12 stations in Kırıkkale. As that forest area is remote from urban pollution sources, samples collected in the forest had been transplanted to the city center. Lichen thalli were collected from tree trunks as a whole rather than in parts. After washing the specimens with purified water, they were packaged lightly in a fine nylon mesh with 20 g of fresh material. Each lichen sack contained a number of thalli. At each monitoring station, two of these nylon mesh bags with transparent colour were attached to a nylon line and suspended on two different trees above 3 meters from the surface of the ground (totally 12 stations and 24 bags) (Figure 1). From 28 July 2002 to 1 February 2003, all lichen specimens were subjected to air pollution at two three-month periods (a total of six months). The hanging date was July 28-30, 2002, the first gathering date was November 2, 2002, and the last collection date was February 1, 2003.
Sample preparation and heavy metal determinations
Following the collection of transplanted lichen specimens, they were rinsed twice with normal and filtered water to remove any undesirable substances (soil particles, sand, dust, bark, etc.). Specimens were dried in yellow paper sacks for 24 hours at 80oC to protect them from microbial degradation and give dry weight reference values. To homogenize the dispersion of heavy metals, dried specimens were crashed with a mortar (shredded to achieve homogeneity).
All of the glass, plastic, and ceramic items were placed in water with detergent and left overnight. Then it rinsed with normal water, immersed in 20% nitric acid, and left overnight. Following these steps, the garment was cleaned with double-distilled water and dried in etuve at 60 oC for 12 hours. All standards and solutions were prepared with 65% w/w (Merck reagent) nitric acid and 35% w/w (Merck reagent) HCl. In addition, double distilled water was used at all stages of standard and solution production, as well as dilutions. The use of HNO3 to dissolve plant parts is a very prevalent process. 1 g of desiccated samples were placed in a porcelain crucible and baked for 24 hours at 460 oC. Ash samples were placed in a 100 mililiter beaker and 65% 100 m HNO3 was added. Beakers placed in a sand bath were heated and allowed to evaporate HNO3 before being removed from the sand bath and allowed to settle. Following evaporation, the residual portion was placed in a centrifuge container and the volume was increased to 15 ml with 1% HNO3. After spinning at 3000 rpm for 20 minutes (3000 rpm=1157 g (relative centrifuge acceleration)), the resulting liquid was transferred to a 25 ml volumetric beaker and diluted to 25 ml with 1% HNO3. The heavy metal contents of all samples including control station were measured using ICP (Inductively Coupled Plasma).
Chlorophyll measurement
Pure DMSO was used to remove chlorophyll from 20 milligrams of air-dried lichen substance. For extraction, 5 mL of DMSO was applied to the thalli. In the dark, tubes holding DMSO and plant material were kept at 65 oC for 40 minutes before being permitted to cool to room temperature. Whatman no 3 filtration paper was used to filter the extracts. The spectrometer was calibrated at 750 nm. The samples' absorbance was measured at 665 and 648 nm. The calculations were carried out in accordance with; DMSO, 100% (pure solvent) (DMSO=Dimethyl sulphoxide (for synthesis)≥ 99% purity, Merck 8.02912). Calculations of the amount of chlorophyll were calculated according to the following equations (1), (2) and (3) of Barnes et al.46
Table 2 shows the values of heavy metals (Cd, Cu, Mn, Ni, Pb, and Zn) and chlorophyll a and chlorophyll b amounts of P. furfuracea specimens that were hanged at 12 different stations in Kırıkkale city and 2 locations as control stations in Yapraklı-Çankırı forest in Çankırı city. All of the lichen samples were subjected to air pollution twice, at three-month intervals. Control samples were also collected from Yapraklı-Çankırı in 3 months intervals at the same time as the samples hanged in Kırıkkale city.
|
Stations |
Periods |
Cu |
Cd |
Ni |
Pb |
Mn |
Zn |
Chlorophyll-a |
Chlorophyll-b |
Chlorophyll a+b |
Chlorophyll a/b |
Chlorophyll b/a |
|
C1* |
1 |
0.28423 |
0.02621 |
0.27508 |
0.51637 |
1.89763 |
0.15076 |
7.7827 |
1.945 |
9.7277 |
5.0007 |
0.312 |
|
2 |
0.38909 |
0.02757 |
0.28306 |
0.55338 |
1.94752 |
0.57671 |
9.252 |
3.013 |
12.265 |
4.5167 |
0.3337 |
|
|
C2* |
1 |
0.25191 |
0.03153 |
0.20229 |
0.52883 |
1.9185 |
0.18884 |
4.9797 |
1.109 |
6.0887 |
5.7143 |
0.2017 |
|
2 |
0.34413 |
0.02832 |
0.31485 |
0.56882 |
1.9879 |
0.58973 |
4.8937 |
1.036 |
5.9297 |
5.9523 |
0.1983 |
|
|
1 |
1 |
0.41951 |
0.01886 |
0.29669 |
0.56762 |
2.3849 |
0.24793 |
3.89 |
4.103 |
7.993 |
0.948 |
1.055 |
|
2 |
0.57365 |
0.02213 |
0.43626 |
0.76903 |
2.92333 |
1.20857 |
0.21 |
0.217 |
0.427 |
0.968 |
1.033 |
|
|
2 |
1 |
0.3838 |
0.01312 |
0.33007 |
0.47291 |
1.98391 |
0.18055 |
4.698 |
0.699 |
5.397 |
6.721 |
0.149 |
|
2 |
0.47588 |
0.01595 |
0.32025 |
0.61896 |
1.979 |
0.49686 |
0.845 |
0.384 |
1.229 |
2.201 |
0.454 |
|
|
3 |
1 |
0.32848 |
0.01312 |
0.23845 |
0.37369 |
1.83974 |
0.18471 |
4.281 |
0.974 |
5.255 |
4.395 |
0.228 |
|
2 |
0.35749 |
0.02049 |
0.35464 |
0.61832 |
2.50796 |
0.59824 |
0.662 |
0.563 |
1.185 |
1.105 |
0.905 |
|
|
4 |
1 |
0.32946 |
0.01763 |
0,25704 |
0.49218 |
2.09786 |
0.16151 |
4.573 |
0.784 |
5.357 |
5.833 |
0,171 |
|
2 |
0.77682 |
0.0143 |
0.44614 |
0.91982 |
3.06851 |
1.14276 |
0.229 |
0.242 |
0.541 |
1.236 |
0.809 |
|
|
5 |
1 |
0.29094 |
0.01472 |
0.21398 |
0.44729 |
2.03404 |
0.18165 |
5.493 |
2.254 |
7.747 |
2.437 |
0.41 |
|
2 |
0.44296 |
0.01943 |
0.32227 |
0.56295 |
2.04408 |
0.56886 |
1.347 |
0.479 |
1.826 |
2.182 |
0.356 |
|
|
6 |
1 |
0.35464 |
0.01566 |
0.36617 |
0.48415 |
2.61584 |
0.18869 |
1.205 |
0.32 |
1.525 |
3.766 |
0.266 |
|
2 |
0.31163 |
0.01741 |
0.24441 |
0.55 |
2.44743 |
0.41079 |
0.643 |
0.323 |
0.996 |
1.991 |
0.502 |
|
|
7 |
1 |
0.27033 |
0.01936 |
0.45373 |
0.41998 |
2.4985 |
0.17488 |
4.763 |
3.487 |
8.25 |
1.366 |
0.732 |
|
2 |
0.37016 |
0.01564 |
0.51588 |
0.50655 |
2.34485 |
0.32679 |
1.519 |
0.485 |
2.004 |
3.132 |
0.319 |
|
|
8 |
1 |
0.39021 |
0.02085 |
0.51092 |
0.80139 |
2.27512 |
2.10131 |
0.463 |
0.092 |
0.555 |
5.033 |
0.199 |
|
2 |
0.4812 |
0.02684 |
0.59425 |
1.25813 |
2.669 |
6.74067 |
0.185 |
0.206 |
0.391 |
0.898 |
0.114 |
|
|
9 |
1 |
0.36233 |
0.01963 |
0.59033 |
0.55244 |
2.40272 |
0.17973 |
3.568 |
3.116 |
6.684 |
1.145 |
0.873 |
|
2 |
0.55724 |
0.01433 |
0.63821 |
0.6506 |
2.99749 |
0.2385 |
1.417 |
0.86 |
2.317 |
1.694 |
0.594 |
|
|
10 |
1 |
0.45281 |
0.01455 |
0.36429 |
0.67674 |
2.03721 |
0.20727 |
2.677 |
0.577 |
3.254 |
4.64 |
0.216 |
|
2 |
0.57242 |
0.02137 |
0.42227 |
1.07264 |
2.43346 |
0.82203 |
0.993 |
0.379 |
1.372 |
2.62 |
0.381 |
|
|
11 |
1 |
0.23525 |
0.01898 |
0.27473 |
0.40129 |
2.4155 |
0.19016 |
5.086 |
0.759 |
5.845 |
6.701 |
0.149 |
|
|
2 |
0.42115 |
0.01508 |
0.25385 |
0.45708 |
2.47137 |
0.72791 |
3.755 |
0.73 |
4.485 |
5.144 |
0.194 |
Table 2 Results of lichen material analysis
Figure 5 and Figure 6 show pollution maps of Kırıkkale city based on the research. It is evident that the lichen, P. furfuracea, accumulated heavy metals which consequently acted as an effective "bioindicator" in the general maps (Figure 7).
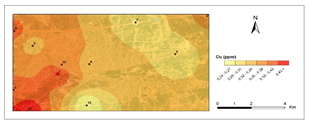
Cu - first period.

Cu - second period.

Cd - first period.

Cd - second period.
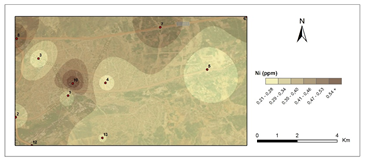
Ni - first period.
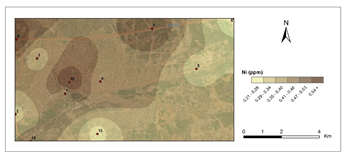
Ni - second period.
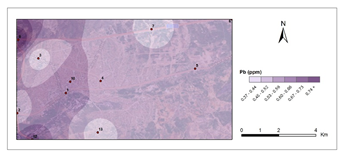
Pb- first period.
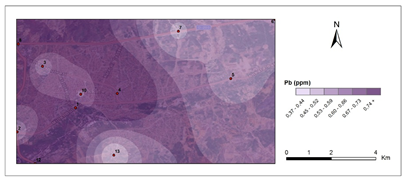
Pb - second period.
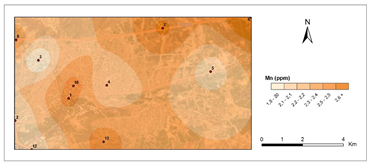
Mn- first period.

Mn - second period.

Zn- first period.
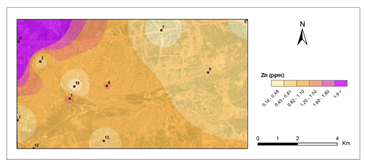
Zn - second period.
Figure 5 Pollution maps of Kırıkkale according to the heavy metals.
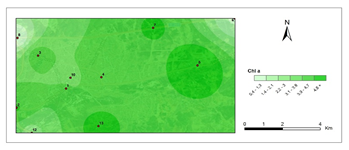
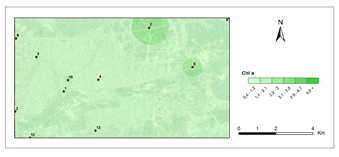
Chlorophyll a- first period.
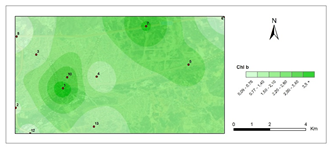
Chlorophyll a- second period.
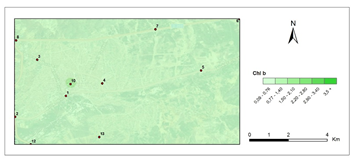
Chlorophyll b- first period.
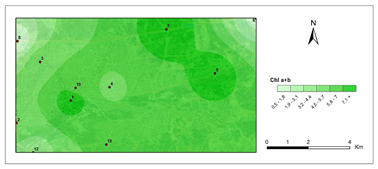
Chlorophyll b- second period.
Chlorophyll a+b- first period.

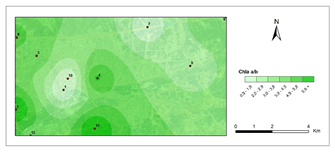
Chlorophyll a/b- first period.
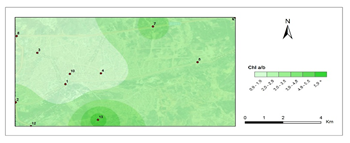
Chlorophyll a/b- second period.
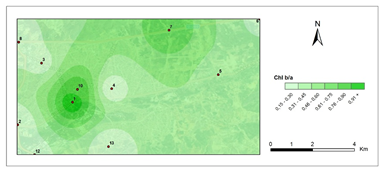
Chlorophyll b/a- first period.
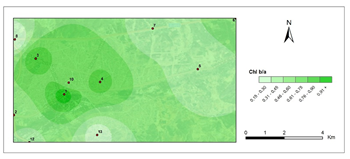
The highest levels of Cu were found in 4th station in 2nd period (0,77 μg g−1) and lowest at the control site in 1st period (0,15 μg g−1). When the maps for Cu accumulation were examined, it was clear that there was a large Cu accumulation at stations 1, 4, 9, and 10, particularly during the second period, which corresponded to the winter period, which was characterized by high fossil fuel consumption for heating activities. Station 4 was the Kırıkkale-Samsun highway, industry intersection, Nokta exit, Ali İhsan Kalmaz Park, and Middle Center Strip, which had the greatest Cu contamination value. High transportation congestion also contributed to pollution in the city center. The elevated trace element concentrations in P. furfuracea can be explained by the high traffic and heating activities. Malaspina et al. (2014), Giordano et al.,50 Onder and Dursun47 Aksoy et al.48 and Kemal (2019) discovered similar findings for Cu.42,47–50
Plants from unpolluted habitats contain 0.01-0.3 μg g-1 Cd, according to Allen.51 Although Cd has been reported to be associated with car exhaust52 no significant difference in Cd concentrations (range between 0,01 μg g-1 and 0,02 μg g-1 was found in transplanted samples when compared to control samples. When the Cd air pollution maps were analyzed, it was nearly same in Cd levels between two periods.
The highest levels of Ni were found in 9th station in 2nd period (0,63 μg g−1) and lowest at the control site (C2) in 1st period (0,20 μg g−1). According to Valkovic,53 coal includes 0,16 μg g-1 Ni. In contrast to that number at stations 7, 8, and 9, which were mostly highway and public-access areas, Ni pollution is determined by heating activities.53 The average Ni concentration found in this study is lower than the Ni concentration obtained in the studies.49,54,55 The FAO/WHO recognized nickel limit value in plants is 5 μg g−1.56 The average nickel content in this study was 0.38 μg g−1. This number is lower than the Nickel content suggested for plants.
The urban roadside with the highest human activity, as well as high vehicular density congestion, has the highest Pb level for the first and second periods (0,80 μg g-1 - 1,25 μg g-1), which is significantly higher than the control sites (C1-0,51μg g-1-0,55μg g-1 and C2-0,52μg g-1-0,56 μg g-1). Loppi et al.57 found similar observations with Flavoparmelia caperata (L.) Hale, Guidotti et al.59 with P. furfuracea, Sorbo et al.58 with P. furfuracea, and Aksoy et al.48 with P. furfuracea.48,57–59 Pb accumulation maps plainly show Pb pollution at stations 4, 8, and 10, which can be attributed to vehicular sources. The Pb accumulation data for station 8 showed a high contamination number in the second phase. The impact of gasoline to Pb levels in the atmosphere is diminishing, while the main sources of toxic elements in the environment continue to be coal and gasoline combustion.60 This element's contamination is linked to car emissions and fuel combustion.53 Hölwarth61 investigated presence of heavy metals in a few specimens and found that vehicles emitted large amounts of Pb and Cu.61
The highest levels of Mn were found in 4th station in 2nd period 3,06 μg g−1 and lowest at 3rd station in 1st period (1,83 μg g−1). The average Mn concentration found in this study was 2.38 μg g-1. The average Mn concentration found is lower than the Ni concentration obtained in the studies.49,54,55 The air pollution maps for Mn show a rise in the accumulation of Mn for station 4 (Highway) in the second period was also easily predicted. Vehicle pollution resulted in significant bioaccumulation.
Zinc content in lichen samples was shown to be linearly proportional to traffic. According to reports, the most significant causes of Zn pollution are fuels, fossil fuels, fertilizers, and metal alloys and increased Zn levels in industry, urban roadsides, urban locations, urban parks, and shanty towns demonstrate the influence of traffic volume and vehicle tyre wear.48,62 The highest levels of Zn were found in 8th station in 2nd period (6.74 μg g−1) and lowest at the control site in 1st period (0,15 μg g−1). According to the Zn pollution maps, there was Zn accumulation in the station 8 (Highway) during two periods of time, which was induced by motor vehicles. Rising Zn concentrations suggest increased atmospheric deposition as well as vehicular traffic.63 Oztetik and Çıcek64 and Guidotti et al.59 found similar observation.59,64
The amounts of photosynthetic pigments are readily calculated and are commonly used to monitor metal stress on plants and lichens. Heavy metals are said to inhibit enzymes that regulate chlorophyll biosynthesis and to prevent the production of chlorophyll pigments. Woolhouse65 demonstrated that Zn reduced photosynthetic pigments by replacing itself with Fe, which is needed for chlorophyll biosynthesis.65 According to Lu et al.,66 Cu concentration has reduced chlorophyll content.66 Heavy metal build up in plant cells causes chlorophyll breakdown. When the heavy metal accumulation images and the chlorophyll concentration maps were contrasted, a clear reverse correlation was noted. The following stations were found to have the highest overall heavy metal accumulation: 1st, 4th, 8th, 7th, 9th, 10th. This finding could also be double-checked with the chlorophyll a+b degradation map, which showed that the photosynthetic pigments had completely degraded. Maps for chlorophyll a/b showed that chlorophyll a was more affected by air pollution than chlorophyll b, pollution weakened photosynthetic pigments, as predicted. The maps for chlorophyll b/a also supported this finding. Environmental stress, such as pollution, could account for all of these variations in chlorophyll a and b amount and ratios. The quantity of chlorophyll in lichen thalli is frequently linked to environmental stress, under stressed circumstances, with more chlorophyll than under non-stressful conditions.67
Wakefield and Bhattacharjee67 discovered that the quantity of chlorophyll in the lichen thalli was unaffected by the station's location. More research is needed to establish the link between these changes and contamination, weather conditions, seasons, light strength, and the plant itself.67
The present study's results show that metal accumulation in lichens is strongly dependent on station location and exposure time. When compared to the element concentration in samples taken from the original control site (the Yapraklı-Çankırı forest area), the concentrations of six elements found in P. furfuracea after exposure in bags in the urban area of Kırıkkale are clearly indicative of trace element contamination in urban air. The relation between Pb, Zn, Cr, Cu, Cd, and Co shows that industry, heating operations, and vehicle traffic all contribute significantly to air pollution in the Kırıkkale province.
We may draw the conclusion from this research that P. furfuracea is a species that efficiently accumulates elements in lichen-bags that are exposed in urban areas. Additionally, the findings from this exploratory investigation can be successfully applied in upcoming comparative assessments for the evaluation of risk and air pollution in comparable urban locations.
The authors thank to Prof. Dr. Dilek DEMİREZEN (Erciyes University, Kayseri/Türkiye) for her invaluable support in heavy metal analysis, to Dr. Ediz ÜNAL (Central Research Institute for Field Crops, Ministry of Food Agriculture and Livestock (TAGEM/Türkiye) for drawing air pollution maps, to Prof. Dr. Ahmet AKSOY (Akdeniz University, Antalya/Türkiye) and Dr. Çiğdem VARDAR (Üsküdar American College-İstanbul/Türkiye) for editing and review.
Compliance with ethical standards
Statement of the welfare of humans or animals: The article does not contain any studies involving humans or animals in experiments performed by any of the authors.
Author contribution
Sevda Sümer Aydın: Writing - Original Draft, Validation, Writing - Review & Editing.
Atila YILDIZ: Research administration, Supervision, Writing - Review & Editing, Resources, Conceptualization, Methodology, Investigation.
Volkan IŞIK: Visualization, Data Curation, Writing - Original Draft, Validation, Writing - Review & Editing.
There is no financial assistance was received from any person or organization in this study.
The authors declare that they have no known competing financial interests or personal relationships that could have appeared to influence the work reported in this paper.

©2023 Isik, et al. This is an open access article distributed under the terms of the, which permits unrestricted use, distribution, and build upon your work non-commercially.