MOJ
eISSN: 2572-8520


Review Article Volume 2 Issue 5
1Professor in the Department of Precision Mechanics, Karavaevo Str. Campus, Russia
2Candidate of technical sciences, head of technical department, Karavaevo Str. Campus, Russia
3Department of Resistance of Materials and Graphs, Karavaevo Str. Campus, Russia
4Department of Building Structures, Karavaevo Str. Campus, Russia
Correspondence: Maklakova Svetlana Nikolaevna, Department of Building Structures, Associate Professor (KGSHA), 156530, Kostroma Region, Kostroma District, PIC. Karavaevo Str. Training town, 34, Russia
Received: January 30, 2017 | Published: May 15, 2017
Citation: Abramov LM, Abramov IL, Galkina MA, Maklakova SN (2017) On The Criteria for Assessing the Strength of Concrete at a Standard Compression Test. MOJ Civil Eng. 2017;2(5):162-165. DOI: 10.15406/mojce.2017.02.00046
The analysis of the tensely-deformed state of cube standard is produced at tests on a compression. During testing on standard methodology of value of descriptions of durability turn out overpriced. One of basic factors influencing on strength descriptions of concrete it is been neglect forces of friction on pin surfaces and abrasive effect. On the basis of theoretical and experimental researches it is set that by a basic criterion at the estimation of durability of concrete at a compression it is necessary to accept positive linear deformation.
Keywords: linear deformation, moving, mechanical descriptions, durability, cube standard, abrasive effect
Determination of the strength characteristics of concrete in compression in accordance with GOST 10180-20121 is currently the main method of preparing these experimental features. However, the method is not free from a number of significant deficiencies, which were previously reported.2 In particular, the main disadvantages of this method include: the negative impact of the friction forces generated on the contact surfaces "sample - cooker testing machine “abrasive effect, which occurs on the contact surface due to the high hardness of the grain aggregate (sand, etc.).
The first disadvantage of radically distorts the test results in terms of determining the strength of the uniaxial compression, since, as the analysis of the stress-strain state (SSS) of the sample material, is actually testing are predominantly in triaxial uneven compression mode. This proves how kind of the sample destroyed and the theoretical VAT analysis of the test sample Figure 1. Arbitrary direction of principal normal stresses, as well as their value, have no significant impact on the nature of the destruction, because it is known that the comparability of their values is a determining condition for a significant increase in strength, regardless of the direction of the maximum normal stress (σ1) Vsluchaezhe triaxial uniform compression of almost any material destroyed cannot be and the more comparable in magnitude of the voltage acting on the main planes, the value of the breaking force will be correspondingly higher.
At point C the position of the principal planes coincides with the coordinate planes, since the point C is located on the sample plane of symmetry dividing the lower part of it from the top. Accordingly, shearing stresses in that plane, and this is no circumstance for determining the main directions denote normal stresses. Thus, for the central fiber (o-o) of the sample value (σ3) is the greatest in comparison with the lateral fibers. Note also that the values of shear stresses asking the value zero on the symmetry plane, reach their maximum values at the contact surfaces. All this outlines the effect of friction forces generated on the contact surfaces.
The influence of the abrasive effect was assessed quantitatively by us during testing of concrete samples of four series of two classes of compression strength,3 having the following grain size of aggregate: 0.375; 0.63; 1.25 and 2.5mm. Rezultaty tests are shown in Figure 1a. In addition to the above, it should be noted that the standard4 recommended taking into account only the results of tests in which a form of destruction corresponds to that shown in Figure 2. But just this form of failure indicates the presence of the largest values of shear stresses at the contact surface, as compared with the other, given in the standard. Furthermore, for this kind of fracture is taken as a reference, we can conclude the following:
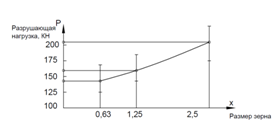
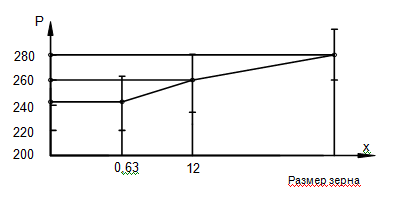
Figure 2 Influence of the grain size of aggregate on the breaking force of samples of concrete B15 and B30.
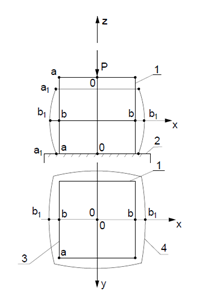
Figure 3 Deformations of longitudinal and transverse fibers of a cubic sample during a compression test.
In Figure 3 a detailed analysis of the deformation process the fibers located in the most dangerous areas. It was also found that the destruction of b-fiber bsvidetelstvuet that the fiber rastyagivayuschienapryazheniya absent, and also the shear stresses, because the fiber is located in the horizontal symmetry plane of the sample. The only possible reason for the destruction of the sample in the fiber b-byavlyaetsya linear deformation destruction, which the function has an extremum at the plane of symmetry, in accordance with the general picture of the geometric deformation of the sample.
Thus, the analysis of the stress-strain state of the sample material has shown that as a failure criterion of concrete in compression should take maximum linear deformation that occurs in the horizontal plane of symmetry of the sample. It should be borne in mind that the relationship between the axial load and the linear deformation of the subject direction is not linear, which greatly complicates the quantification of the alleged strain criterion. Besides the concrete material is not isotropic and, in addition, the ideal warping scheme does not consider a number of factors such as the local stone chip sample cube corner elements. The latter phenomenon see Figure 4a-4c due to lack of support in the shear stresses on the sample contact surface angles, as under the law of pairing the side faces free from any stress.


In this regard it is of interest distribution of the normal stresses σzpo compressible sample contact surface. In solving the problem the mathematical model of the state of the material was used analytical method in the movements, as in the present case to set the boundary conditions in displacements for simply testing machine plate.
The basic equation is written in terms of displacements in the form:4
(λb+Gb)∂Δ∂x+Gb*∇2u=0(λb+Gb)∂Δ∂y+Gb*∇2v=0(λb+Gb)∂Δ∂z+Gb*∇2w=0
Where Δ = ∂u / ∂x + ∂v / ∂y + ∂w / ∂z - volume deformation of the material
u, v, w - deformed material displacement corresponding points on the coordinate axes «x, y and z»;
λ_b (ε_x), G_b (ε_z) - the elastic characteristics of concrete taken on normative data for the study of concrete classes without taking into account the anisotropy of the material properties.
λ_b = (μ_b E_b) / (1 + μ_b) (1-2μ_b), G_b = E_b / (2 (1 + μ_b)) - Lame constants calculated at Puassona μ_b coefficient values 0,2i = Eb = 3.25* 104MPasoglasno normative data.
The picture of the stress field in the direction of the z-axis shown in Figure 5.
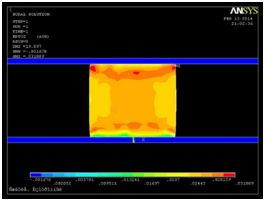
Figure 5 The pattern of the stress field at Solving the problem in displacements with the value ε_b0 = 0.002.
Analysis of the results shows that when the assumptions local increase of axial stresses in the corners of the test sample may be greater than the average voltage at the center of the sample is more than 2 times. And this is due to the local destruction of the sample at the corners of the contact surface. Experimental verification of axial stress distribution law on the contact surface was performed by kreshernoy waxed plate placed on the contact surface. More experiment is described in.5,6 Schedule pressure distribution (axial stress) is shown in Figure 6.
Thus ultimately acceptance criterion deformation due to very uneven distribution of the contact pressure and, consequently, axial strain can be considered fully justified, in particular, to assess the limit values of the deformation elements. The latter leads to the formation of spatial fracture ,7 which is related to the heterogeneity of both the stress and strain state in hazardous areas of concrete objects. Thus, in the conditions stipulated by the standard,1 the destruction of the sample is not directly related to the influence of any stress (fracture surface is not such, on which there are normal or shear stresses), why introduce as a criterion for the destruction of the power criterion is unlikely to be is an objective measure.
Therefore, the most appropriate and well-founded measure is used as a quantitative measure of evaluating the bearing capacity exhaustion material aprimenenie strain criterion. Given the above geometric model of deformation of a cubic sample, the most acceptable from the point of view of application in engineering calculations should recognize the positive value of maximum linear deformation (ε_max). This value can be determined theoretically using various models described in,4 and suitable even for option transversely anisotropic material. Much harder to address the issue of the experimental determination of the indicated value, because the value depends on the type parametraε_maxsuschestvenno stress. To solve this problem it was designed and manufactured with a device that allows you to realize the stress state type triaxial and biaxial compression Figure 7.
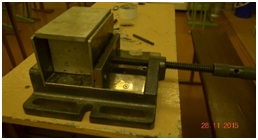
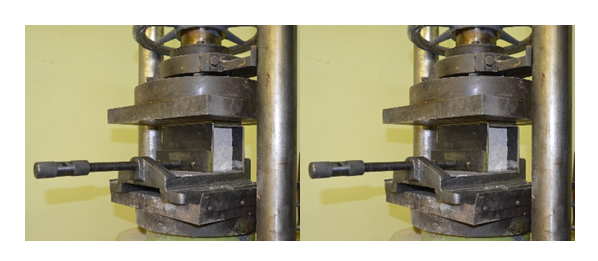
Figure 7 Appearance of the device for testing under uniaxial stress states of homogeneous character.
Tests at neodnoosnyh stressed states can determine a complete diagram of the limit state of concrete. It is supposed to build this diagram in the coordinates P_σ-ε_max, where under P_σ be understood measure the stress state defined by the formula:8
P_σ = (σ_x + σ_y + σ _z) / σ_i, (2)
σ_i- where the intensity of the normal stresses, defined by the formula:
σi=1√2√(σ1−σ2)2+(σ2−σ3)2+(σ3−σ1)2 (2), (3)
As follows from the formula (2), for a value of uniaxial tension _σ = + 1, for a uniaxial compression _σ = -1. The compressed sample points located on its axis, the indicator value may reach values _σ = -3.
Since we are interested in the value of the indicator for cases of biaxial compression, the figure for different values of the axial deformation of the negative in a range -1≤ π _σ≤ + 1. Poetomu a first approximation chart _σ-ε_max can be taken as a linearized Figure 8. Engineering calculation of reinforced concrete structures using diagrams plasticity limit should be performed according to the algorithm of the form: analysis of the VAT element of the projected material by using known software packages perform experiments on a modernized regulatory procedure under uniaxial tension and compression samples of materials that will be used in the manufacture of building elements calculated construction of the linearized diagram limit of plasticity limiting the comparison of positive strain in hazardous locations with the theoretical obtained by calculation assessment of the feasibility of using this material in the design values of the design loads So, on the results of experimental and theoretical studies, the following conclusions value of strength of concrete in compression, resulting from the standard test conditions, are significantly overstated due to neglect of contact friction forces and "abrasive" effect on the contact surfaces for a more objective assessment of the carrying capacity of the projected construction elements to be used deformation criterion - the maximum positive value of deformation to calculate a first approximation, in the absence of experimental data to be used in the practice of engineering materials is permissible to use a linearized diagram of plasticity limit for known values of longitudinal strain in uniaxial tension and uniaxial compression Evaluation limit of plasticity is obviously overpriced, but it's too high, according to preliminary estimates will not exceed 10% of the nominal value of the marginal positive linear deformation.
None.
The author declares no conflict of interest.

©2017 Abramov, et al. This is an open access article distributed under the terms of the, which permits unrestricted use, distribution, and build upon your work non-commercially.