MOJ
eISSN: 2471-139X


Research Article Volume 4 Issue 2
Department of Zoology, Mizoram University, India
Correspondence: Ganesh Chandra Jagetia, Professor, Department of Zoology, Mizoram University, Tanhril, Aizawl-796 004, Mizoram, India, Tel 011 389 2330724/2330227
Received: July 01, 2017 | Published: September 5, 2017
Citation: Jagetia GC, Lalrinengi C. Treatment of mice with naringin alleviates the doxorubicin-induced oxidative stress in the liver of Swiss albino mice. MOJ Anat Physiol. 2017;4(2):267–278. DOI: 10.15406/mojap.2017.04.00130
Doxorubicin a photosensitive antibiotic is frequently used to treat various malignancies in clinics; however, doxorubicin is also taken up by the normal cells of the body leading to increased oxidative stress and subsequently DNA damage and dysfunction in the cells. The agents which can reduce the adverse effect of doxorubicin will of great value. The present study has attempted to study the effect of naringin a citrus flavonoid on the doxorubicin-induced oxidative stress in mice liver. The mice were administered with 0, 1, 5 or 10mg/kg body weight of doxorubicin and treated with 10mg/kg body weight of naringin before or after doxorubicin treatment. The glutathione concentration and lipid peroxidation and activities of glutathione-s-transferase, catalase and super oxide dismutase were studied at 0.5, 1, 2 and 4h post-treatment in the mouse liver. The doxorubicin increased the lipid peroxidation in a dose dependent manner at all the post treatment times. Conversely, it attenuated the activities of glutathione-s-transferase, catalase and super oxide dismutase in dose dependent fashion and time dependent manner. A similar effect was observed for glutathione concentration. Treatment of mice with naringin before or after doxorubicin treatment elevated all the antioxidants and reduced the doxorubicin -induced lipid peroxidation. The effect of naringin pretreatment was more effective when compared to its post treatment. The naringin was very effective in reducing the oxidative stress induced by doxorubicin as indicated by the elevated levels of glutathione concentration, glutathione-s-transferase, catalase and super oxide dismutase. The pretreatment of naringin was better than its post treatment.
Keywords: naringin, doxorubicin, mice, glutathione, catalase, lipid peroxidation
Doxorubicin (also known as Adriamycin) is a cytotoxic photosensitive antibiotic, which was isolated from cultures of soil bacteria Streptomyces peucetius var. Caesius.1 It belongs to anthracycline group of chemicals that include doxorubicin, daunorubicin, epirubicin, and idarubicin. The antracyclinesare a class of chemotherapeutic agents which are highly active against numerous malignant disorders. The doxorubicin acts on the neoplastic cells during specific phase of the cell cycle, particularly the cells which are in the S phase the cell division are highly sensitive to its effect.2 Doxorubicin has been the part of highly effective chemotherapeutic regimens for more than 30years for the treatment of a wide variety of cancers including bladder, breast, lung, stomach, and ovarian cancers, Hodgkin's and non-Hodgkin's lymphomas, certain types of leukemias, multiple myelomas, gastric, thyroid carcinomas, soft tissue sarcomas, osteosarcoma, neuroblastoma, nephroblastoma, Kaposi’s sarcoma and Wilms tumour.3 The clinical success of doxorubicin is usually limited due to the development of many adverse side effects including myelosuppression, nausea, vomiting, mouth ulcers, local aggressivity, alopecia, hallucinations, vertigo, dizziness, bone marrow aplasia and life threatening cardiotoxicity.4 Doxorubicin treatment also causes hypersensitivity (fever, chills, and urticaria), hyperpigmentation of the nails, lacrimation and conjunctivitis.5 Doxorubicin also causes immune suppression due to the severe toxic effects on immune cells; as a result the patient becomes more susceptible to microbial infections, fatigue, reduced healing time and gingival bleeding.6
Anthracyclines kills cancerous cells by triggering the formation of reactive oxygen species (ROS), such as H2O2 and superoxide anion radical, which are generated through redox cycling of DOX in vivo.7,8 Superoxide radicals may react with hydrogen peroxide to form highly reactive hydroxyl radicals via the iron catalyzed Haber-Weiss reaction. The secondarily derived hydroxyl radicals can cause protein and DNA damage and initiate lipid peroxidation,9 which lead to cytotoxic effects on cells and tissues. The cytotoxic effect of doxorubicin on malignant cells and its toxic effects on various organs are also due to nucleotide base intercalation and cell membrane lipid binding activities.10 The intercalation of doxorubicin into DNA inhibits nucleotide replication and action of DNA and RNA polymerases. Further, the interaction of doxorubicin with topoisomerase II inhibits the formation of DNA-cleavable complexes inhibiting the relegation of DNA, which is fundamental to DNA replication and it appears to be an important mechanism of its cytocidal activity.11,12 The reductive conversion of doxorubicin has been implicated as a major determinant of doxorubicin cytotoxicity and has been proposed as an underlying factor controlling drug resistance in cancer cells.13,14 Reductive conversion of doxorubicin is characterized by the one-electron reduction of the quinone moiety of doxorubicin, via NADPH and the cytochrome P450 reductase into a semiquinone radical, which exerts the toxic effect or it can oxidized back to the quinine form.15 The ability of doxorubicin to undergo the reductive conversion depends on the availability of molecular oxygen and NADPH, and the activities of several intracellular enzymes such as superoxide dismutase (SOD), glutathione peroxidase, NADPH oxidases (NOXs) and thioredoxin.16
The antineoplastic drugs are not specifically selective to neoplastic cells and they are also assimilated by normal healthy cells, especially the proliferating ones. This causes major toxicity to various normal organs including heart, liver, kidney, brain bone marrow etc. The cells responsible for triggering many of the body’s crucial immune responses are also affected, depressing the patient’s immune system and increasing the risk of developing viral or bacterial infections.17 Therefore, any strategy that can reduce the generation of ROS by doxorubicin will be of great importance clinically as it may be able to contain the doxorubicin-induced toxic side effect on different organs. The screening of natural products may provide a major avenue to reduce the doxorubicin-induced toxicity.
Plant produce several secondary metabolites and flavonoidsare in particular a large class of poly-phenolic compounds characterized by a common benzoin-gamma-prone structure, which are abundantly present in the fruits and vegetables that are regularly consumed by humans. The major sources are apples, citrus fruits, onions, mulberries, bilberries, and beverages such as tea, beer, and wine.18 Flavonoids include flavones, flavones, is-flavones, and the 2,3-dihydroderivatives of flavones, namely flavones.19 Flavanones, such as hesperidin and naringin, have a more restricted distribution than other flavonoids. They are specifically synthesized by citrus fruits.20 Naringin (4’,5,7-trihydroxyflavanone-7-rhamnoglucoside), aglycone of naringenin is the predominant flavanone synthesized by grapefruit (Citrus paradisi) and is responsible for the bitter taste of grapefruit juices.21 Naringin (NIN) was first discovered by De Vry in the flowers of grape fruit trees growing in Java in 1857. The name naringin is probably derived from the Sanskrit term “narangi” meaning “orange”. It is present in grapefruit juice up to concentrations of 800mg/L.22 Depending up on the maturity of the fruit and the method of purification, naringin naturally occurs as a mixture of chiral isomers that markedly vary in proportion.23 It is also transformed by the intestinal microflora into many kinds of phenolic acids due to ring fission.24,25 The hydrolysis of naringin results into naringenin in the intestine and is catalyzed by enzymes including α-rhamnosidases and β-glucosidases.26,27 Naringin interacts with the activities of transporters and enzymatic proteins in the intestine and hence, with the absorption and breakdown of certain drugs, results in altered blood levels.28
Naringin has also been found to be antiviral, anti-cancer, hepatoprotective, cardioprotective and neuroprotective.29‒33 It is also reported to have antioxidant effects from the study of the inhibition of lipid peroxidation in blood cell membranes and free radical scavenging.34,35 It inhibits dihydropyridine oxidation and aflatoxin B1 activation in human liver microsomes, and might have cancer chemoprevention properties.36,37 It also protects against radiation and doxorubicin induced chromosomal damage in mouse bone marrow cells.35,38,39 It has been found to be anti-inflammatory, antidiabetic, antifibortic, antiosteoporotic, antidyslipidemic and protected against lipodystrophy and iron induced toxicity.40‒44 Naringin may also have protective effects on cognition and oxidative damage.45 Naringin reduced cell viability and cell proliferation by arresting the cell cycle at the G1 phase in 5637 cells and inhibited cyclin D1/CDK4 and cyclin E-CDK2 complexes by the increased expression of p21WAF1 and activation of Ras/Raf/ERK.46 Looking into all these activities of naringin the present study was envisaged to evaluate the effect of naringin on the doxorubicin-induced oxidative stress in the liver of mice.
Chemicals and reagents
Naringin and doxorubicin hydrochloride were procured from Acros Organics Ltd., Geel (Belgium), and Getwell Pharmaceuticals, Gurgaon, India, respectively. 1-chloro-2,4-dinitro- benzene (CDNB), 5,5-dithiobis (2-nitrobenzoic acid) (DTNB), diethylenetriaminopentaacetic acid (DETAPAC) ethylenediaminetetraacetic acid (EDTA), glutathione, nitroblue tetrazolium (NBT), phenazine methosulphate, sodium azide, 2-thiobarbituric acid (TBA), sodium dodecyl sulphate, nicotinamide adenine dinucleotide (NADH), nitroblue tetrazolium, nicotinamide adenine dinucleotide phosphate (NADPH) tetraethoxypropane, and 5-thio-(2-nitrobenzoic acid)] (TNB) were purchased from Sigma Chemicals Co. St. Louis, USA. Other routine chemicals were procured from Merck India, Mumbai.
Animals care and handling
The animal care and handling were performed according to the guidelines of INSA (Indian National Science Academy, New Delhi, India) and the World Health Organization, Geneva, Switzerland. Usually male Swiss albino mice of eight to ten weeks age and weighing 25-30g were selected from an inbred colony that was maintained under the controlled conditions of light (12 light and dark, respectively), temperature (23±2˚C), and humidity (50±5%). The animals had were give sterile food and water ad libitum throughout the entire study. The four animals were housed in a polypropylene cage consisting sterile paddy husk as the bedding material throughout the experiment. The institutional animal Ethics Committee, of the Mizoram University, Aizawl, India had approved the study.
Preparation of the drug
Naringin or doxorubicin was freshly dissolved in sterile double distilled water (DDW) immediately before administration.
Mode of administration
The animals were injected with naringin (NIN) or doxorubicin (DOX) intraperitoneally.
Experimental
The effect of naringin pre and post treatment was determined by dividing the animals into the following groups:
Preparation of homogenate
The animals of all groups were killed by cervical dislocation at 0.5, 1, 2 and 4h post-treatment and their abdominal cavities were opened with the help of scissors and forceps. The livers were perfused with isotonic cold saline transcardially, removed, blot dried, weighed and the 10% homogenate was prepared with PBS.
The total protein were estimated by the modified method of Lowry’s.47
Glutathione
The estimation of glutathione (GSH) contents were performed by earlier described method48 with minor modifications. Briefly, the proteins were precipitated with 0.5ml ice cold 10% 5-sulfosalicylic acid and the tubes were incubated on ice for 10min, centrifuged (Sorvall Instruments RC5C, DuPont, Minnesota, USA) for 15min at 15,000 rpm in cold (4˚C). The protein free supernatant was collected and immediately mixed with 0.5ml of NADPH (4mg of reduced form was dissolved in 100ml of 0.5% NaHCO3), 0.5ml of glutathione reductase (6units/ml in 0.1M phosphate buffer, pH 7.0) and 1ml of 0.6 M DTNB [prepared in 0.2 M phosphate buffer (pH 8)]. The formation of TNB was read against the blank in a UV-Visible double beam spectrophotometer (Shimadzu Corporation, Tokyo, Japan) at 412nm. A sample lacking GSH was used as a blank. The GSH concentration has been expressed as µmol/mg protein. Standard curve was plotted using different concentrations of GSH.
Glutathione-s-transferase
The protocol described by Habig et al.49 was used to measure the activity of glutathione-S-transferase (GST), where the homogenate was mixed with 0.1 M potassium phosphate buffer, CDNB and 10mM GSH, and kept in water bath for 10min at 37˚C. The absorbance was recorded 1min intervals against the blank at 340nm using a UV-VIS spectrophotometer. The GST activity has been expressed asnmol/mg of protein.
GST activity=Absorbance of sample-Absorbance of blank×1000/9.6×Vol of sample
Catalase
The catalytic reduction of hydrogen peroxide was used to measure the catalase activity,50 where, hydrogen peroxide was added to the tissue homogenate and the mixture was incubated at 37˚C. The hydrogen peroxide decomposition was monitored at 0.5s, 10s intervals up to 30s and the absorbance was read against the blank at 240nm using a UV-VIS spectrophotometer. The average difference in absorbance in 30s was calculated.
Superoxide dismutase
The activity of superoxide dismutase (SOD) was determined by the as described earlier.51 Briefly, the homogenate was mixed with phenazine methosulphate, nitroblue tetrazolium and NADH and incubated at 30˚C for 90 sec. The reaction was terminated by the addition of acetic acid and n-butanol. Blank was prepared in a similar fashion without the sample and the reaction was stopped by adding acetic acid and n-butanol. The sample absorbance was read against the blank at 560nm in a UV-VIS spectrophotometer.
Lipid peroxidation
The induction of lipid peroxidation (LOO) was measured as various thiobarbituric acid reactive substances (TBARS) including malondialdehyde, lipid hydroperoxides and aldehydes in the homogenate.52 The liver homogenate was heated with thiobarbituric acid (0.8%), sodium dodecyl sulphate (0.1%) and acetic acid (20%) in a boiling water bath for 30min (lipoproteins are precipitated). The resultant mixture was cooled, extracted with n-butanol-pyridine, and the absorbance of the butanol layer was recorded at 532nm using UV-Visible double beam spectrophotometer. The resultant concentration of TBA reactive substances is expressed asnmol/mg protein obtained from a standard curve of tetraethoxypropane.
The statistical significance among all the treatments was determined by Students “t” test and analysis of variance (ANOVA). The results are the average of three individual experiments. The test of homogeneity was applied and since the data of each experiment did not differ significantly from one another and hence, all the data are combined and means calculated. A p value of <0.05 was considered statistically significant.
The results are expressed as mean±SEM (standard error of the mean) in Tables 1-5 and Figures 1-10.
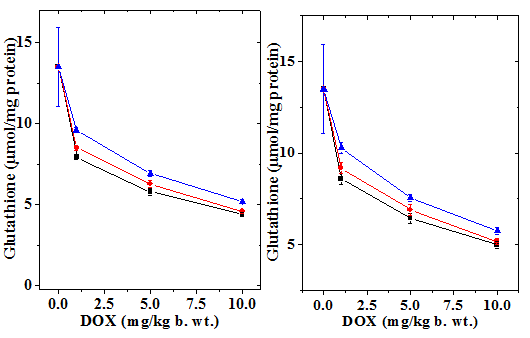
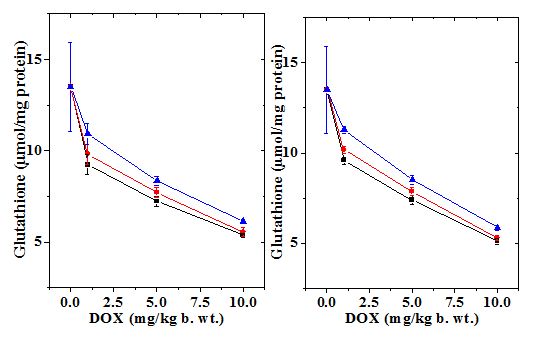
Figure 1 Alteration in the doxorubicin-induced decline inglutathione (GSH) concentration in mouse liver treated with 10mg/kg b.wt. naringin at different post-treatment times. Upper left: 0.5h; Upper right: 1h Lower left: 2h and Lower right: 4h post-treatment. Squares: Doxorubicin; Circles: Naringin + Doxorubicin and Triangles: Doxorubicin + Naringin.
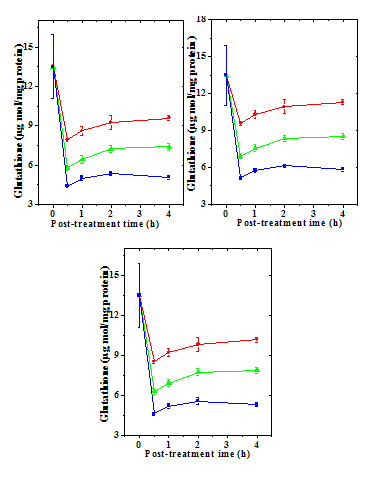
Figure 2 Alteration in the doxorubicin -induced decline in glutathione (GSH) concentration by 10mg/kg b.wt. naringin in mouse liver with assay time. a) Doxorubicin; b) Naringin +Doxorubicin; and c) Doxorubicin + Naringin. Circles: 1 mg Doxorubicin; and Triangles: 5 mg Doxorubicin Squares: 10 mg Doxorubicin.
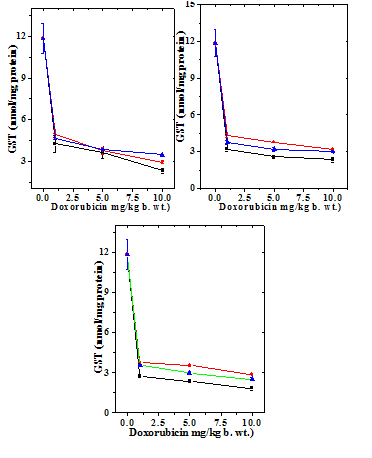
Figure 3 Alteration in the doxorubicin -induced decline in glutathione-s-transferase (GST) activity by naringin (10mg/kg b.wt) in mouse liver at different post-treatment times. Upper left: 0.5h; Upper right: 1h; Lower left: 2h and Lower right: 4h post-treatment. Squares: Doxorubicin; Circles: Naringin+ Doxorubicin and Triangles: Doxorubicin+ Naringin.
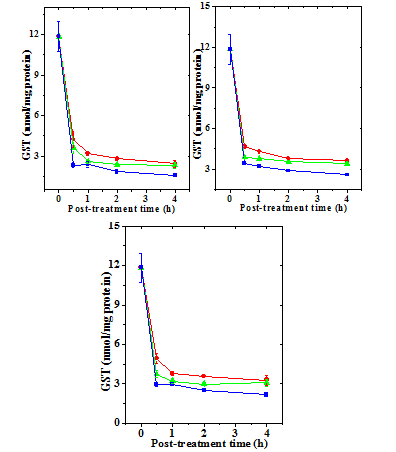
Figure 4 Alteration in the doxorubicin -induced glutathione-s-transferase (GST) activity with time in mouse liver administered with 10mg/kg b.wt. naringin. a) Doxorubicin; b) Naringin +Doxorubicin; and c). Doxorubicin + Naringin. Circles: 1 mg Doxorubicin; and Triangles: 5 mg Doxorubicin Squares: 10 mg Doxorubicin.
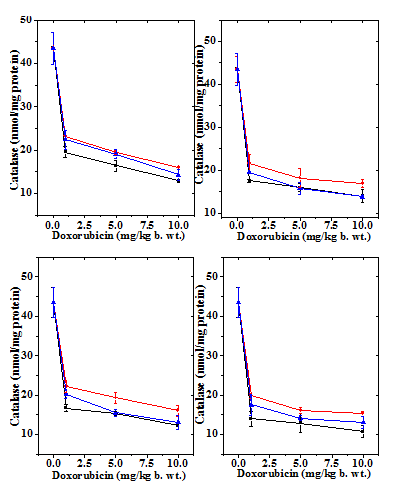
Figure 5 Alteration in the doxorubicin -induced decline in catalase activity in mouse liver by 10mg/kg b.wt. naringin at different post-treatment times. Upper left: 0.5h; Upper right: 1h; Lower left: 2h and Lower right: 4h post-treatment. Squares: Doxorubicin; Circles: Naringin + Doxorubicin and Triangles: Doxorubicin + Naringin.
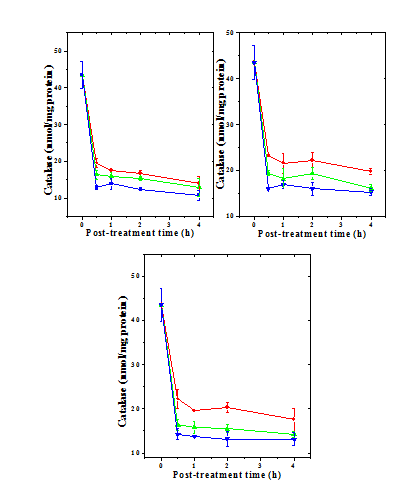
Figure 6 Alteration in the doxorubicin -induced catalase activity with time in mouse liver administered with 10mg/kg b.wt. naringin. a) Doxorubicin; b) Naringin +Doxorubicin; and c) Doxorubicin + Naringin. Circles: 1 mg Doxorubicin; and Triangles: 5 mg Doxorubicin Squares: 10 mg Doxorubicin.
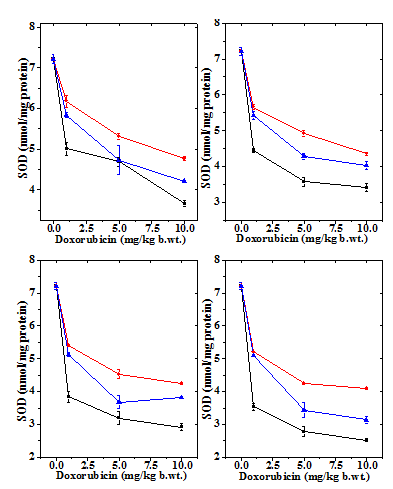
Figure 7 Alteration in the doxorubicin -induced decline in superoxide dismutase activity by 10mg/kg b.wt. naringin in mouse liver at different post treatment times. Upper left: 0.5h; Upper right: 1h; Lower left: 2h and Lower right: 4h post-treatment. Squares: Doxorubicin; Circles: Naringin + Doxorubicin and Triangles: Doxorubicin+ Naringin.
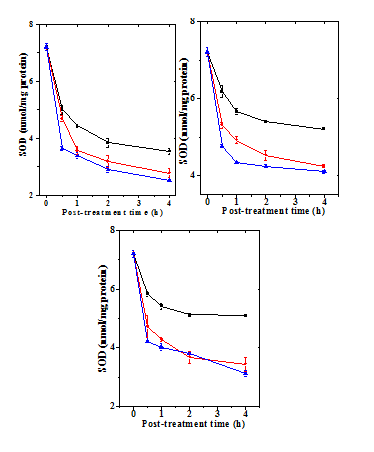
Figure 8 Alteration in the doxorubicin -induced superoxide dismutase activitywith time in mouse liver administered with 10mg/kg b.wt. naringin a) Doxorubicin; b) Naringin + Doxorubicin; and c). Doxorubicin + Naringin. Circles: 1 mg Doxorubicin; and Triangles: 5 mgDoxorubicin Squares: 10 mg Doxorubicin.
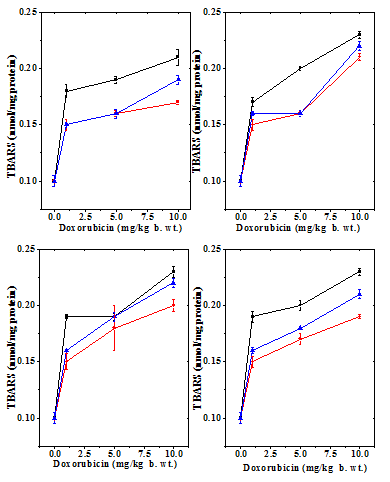
Figure 9 Alteration in the doxorubicin -induced decline in lipid peroxidation by 10mg/kg b.wt. naringin in mouse liver at different post-treatment times. Upper left: 0.5h; Upper right:1 h; Lower left: 2h and Lower right: 4h post-treatment. Squares: Doxorubicin; Circles: Naringin + Doxorubicin and Triangles: Doxorubicin + Naringin.
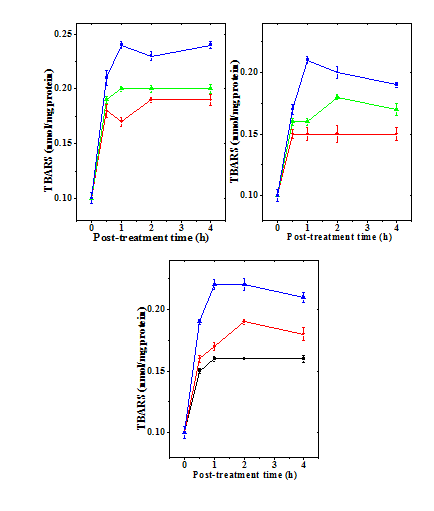
Figure 10 Alteration in the doxorubicin -induced lipid peroxidation (LOO) with time in mouse liver administered with 10mg/kg b.wt. naringin. a) Doxorubicin; b) Naringin +Doxorubicin; and c). Doxorubicin + Naringin. Circles: 1 mg Doxorubicin; and Triangles: 5 mg Doxorubicin Squares: 10 mg Doxorubicin.
Glutathione
The normal GSH concentration in the non-drug treated control Swiss albino liver has been13.5±2.43 µmol/mg protein (Table 1). Administration of naringin alone did not significantly change the GSH concentration when compared to control (data not shown). Treatment of mice with different concentrations of doxorubicin led to a dose dependent depletion in the GSH concentration and a greatest attenuation was observed for 10 mg/kg b. wt. DOX (Figure 1 & 2). The assay of GSH revealed a time dependent elevation in the GSH contents that was lowest at 1/2 h post-treatment and continued to elevate until 4 h post-treatment without restoration to normal level (Figure 1). Naringin treatment before 1 h of DOX treatment caused a significant rise in the GSH concentration as early as 0.5 h post treatment, which steadily rose up to 4 h post-treatment where the GSH concentration was the maximum (Figure 2). Despite this the rise in GSH contents depended on the DOX dose; higher the DOX dose lesser was the increase (Table 1). Treatment of animals with naringin after DOX treatment led to an increase in the GSH concentration in the mouse liver at all DOX doses; however, this elevation was not significant higher when compared to the DOX treatment alone at 0.5 and 1 h post- treatment however, it was significantly higher and 2 and 4 h post -treatment (Table 1). The effect of naringin pretreatment had a greater effect than the post treatment (Table 1, Figures 1 & 2).
Treatment Group |
Dose (mg/kg b.wt.) |
Post Treatment Times (h) |
|||
0.5 |
1 |
2 |
4 |
||
Control |
0 |
13.5±2.43 |
13.5±2.43 |
13.5±2.43 |
13.5±2.43 |
DOX |
1 |
7.92±0.14‡ |
8.60±0.31‡ |
9.23±0.55‡† |
9.58±0.19‡† |
5 |
5.79±0.20‡ |
6.43±0.29‡ |
7.23±0.26‡† |
7.38±0.24‡† |
|
10 |
4.40±0.13‡ |
4.99±0.18‡ |
5.36±0.13‡ |
5.08±0.15‡ |
|
NIN+DOX |
1 |
9.59±0.14*# |
10.29±0.31*# |
10.93±0.56*#† |
11.29±0.20*#† |
5 |
6.91±0.20* |
7.55±0.29*# |
8.35±0.26*#† |
8.50±0.24*#† |
|
10 |
5.17±0.13* |
5.75±0.18* |
6.13±0.13*† |
5.85±0.15 |
|
DOX+NIN |
1 |
8.50±0.14 |
9.19±0.31 |
9.81±0.55† |
10.17±0.19† |
5 |
6.27±0.20 |
6.91±0.29 |
7.71±0.26† |
7.86±0.24† |
|
10 |
4.59±0.13 |
5.18±0.18 |
5.55±0.26† |
5.28±0.14 |
|
Table 1 Alteration in the Glutathione concentration in the liver of mice treated with different doses of doxorubicin before and after naringin treatment at various post treatment times
p<0.05, No symbol: Non-significant
‡: Statistical significance was calculated against control with the positive control i.e DOX treatment alone.
*: Statistical significance was calculated against DOX alone treatment in their respective treatment hours.
#: Statistical significance was calculated against DOX+NI combination treatment in their respective treatment hours.
†: Statistical significance was calculated against their corresponding 0.5h treatment combinations.
Glutathione-S-transferase
The GST activity in the liver of non-drug treated control mice 11.85±1.10 nmol/mg protein (Table 2) and naringin treatment alone did not alter the glutathione-s-transferase activity significantly in comparison with the control (data not shown). Treatment of mice with different doses of DOX reduced GST activity significantly at all the post treatment times (Figure 3). There has been a 2.8, 3.3 and 5 fold reduction in the catalase activity in the livers of mice treated with 1, 5 and 10 mg/kg DOX, respectively (Table 2). The GST activity of depleted steadily with time and it was lowest at 4 hours post-treatment (Figure 4). Treatment of naringin before and after DOX administration resulted in an elevation in the GST activity (Figure 3), which depended on the assay time and DOX dose (Table 2). This elevation in the GST activity was significantly higher than the dos treatment alone at 1, 2 and h post treatment (Table 2). The rise in the GST activity was greater in the naringin pretreated group than the post-treated group (Figures 3 & 4).
Treatment Group |
Dose (mg/kg b.wt.) |
Post Treatment Times (h) |
|||
0.5 |
1 |
2 |
4 |
||
Control |
0 |
11.85±1.10 |
11.85±1.10 |
11.85±1.10 |
11.85±1.10 |
DOX |
1 |
4.25±0.59‡ |
3.19±0.15‡† |
2.78±0.11‡† |
2.43±0.25‡† |
5 |
3.60±0.40‡ |
2.60±0.13‡† |
2.36±0.09‡† |
2.31±0.21‡† |
|
10 |
2.30±0.19‡ |
2.34±0.22‡ |
1.83±0.13‡ |
1.58±0.08‡ |
|
DOX+NIN |
1 |
4.94±0.38 |
3.76±0.15† |
3.57±0.05*† |
3.28±0.38*† |
5 |
3.74±0.27 |
3.21±0.16 |
2.98±0.13† |
3.08±0.25* |
|
10 |
2.93±0.13 |
2.99±0.08 |
2.52±0.10 |
2.16±0.04 |
|
NIN+DOX |
1 |
4.65±0.07 |
4.29±0.16* |
3.77±0.03*† |
3.62±0.007*† |
5 |
3.87±0.04 |
3.77±0.024* |
3.54±0.10* |
3.41±0.09* |
|
10 |
3.45±0.01*# |
3.18±0.021* |
2.87±0.008*† |
2.58±0.03*† |
|
Table 2 Alteration in the glutathione-s-transferase activity in the liver (nmol/mg protein) of mice treated with different doses of doxorubicin before and after naringin treatment at various post treatment times
p<0.05, No symbol: Non-significant
‡: Statistical significance was calculated against control with the positive control i.e DOX treatment alone.
*: Statistical significance was calculated against DOX alone treatment in their respective treatment hours.
#: Statistical significance was calculated against DOX+NIN combination treatment in their respective treatment hours.
†: Statistical significance was calculated against their corresponding 0.5h treatment combinations.
Catalase
The liver of normal untreated mice showed 43.50 nmol/mg protein catalase activity (Table 3) which did not change after naringin administration (data not shown). The administration of mice with different doses of DOX decreased the catalase activity in dose dependent manner (Figure 5) and the greatest reduction in the catalase activity was observed for the 10 mg/kg DOX, where it was more than three folds (Table 3 & Figure 5). The catalase activity also declined in a time dependent manner after DOX treatment and the lowest activity was observed at 4 h post treatment (Figure 6). Despite the signs of recovery the catalase activity was far from normal (Figure 6). This reduction in catalase activity by DOX was 3, 3.4 and 4 folds at 4 h post treatment for 1, 5 and 10 mg/kg DOX, respectively (Table 3). The treatment of mice with 10 mg/kg b. wt. of naringin before DOX administration resulted in a significant rise in the catalase activity at all the assay times and it was higher at 0.5 h post DOX treatment than the other assay times (Table 3). Administration of mice with of naringin after DOX treatment also significantly increased the catalase activity in the mouse liver depending on the DOX dose and assay time (Table 3) and maximum elevation was observed at 0.5 h post-treatment (Figure 6). Thereafter catalase activity steadily declined until 4 h post-treatment (Figure 6).
Treatment Group |
Dose (mg/kg b.wt.) |
Post Treatment Times (h) |
|||
0.5 |
1 |
2 |
4 |
||
Control |
0 |
43.50±3.70 |
43.50±3.70 |
43.50±3.70 |
43.50±3.70 |
DOX |
1 |
19.51±1.22‡ |
17.50±0.31‡† |
16.71±0.88‡† |
14.02±1.89‡† |
5 |
16.36±1.20‡ |
15.95±0.97‡† |
15.37±0.46‡† |
12.93±2.44‡† |
|
10 |
12.88±0.43‡ |
13.93±1.51‡† |
12.36±0.25‡ |
10.76±1.44‡† |
|
NIN+DOX |
1 |
23.24±0.17*# |
21.61±2.17*#† |
22.24±1.59*#† |
19.83±0.70*#† |
5 |
19.45±0.49# |
18.17±2.17*#† |
19.31±1.31*# |
16.12±0.74*#† |
|
10 |
16.03±0.11*# |
16.91±0.91*# |
16.06±1.43*# |
15.29±0.69*# |
|
DOX+NIN |
1 |
22.24±2.16* |
19.54±0.18*† |
20.30±1.20*† |
17.55±2.62*† |
5 |
19.08±1.04* |
15.82±1.41 |
15.50±0.99† |
14.20±0.73*† |
|
10 |
14.25±1.20* |
13.76±0.30† |
13.17±1.76*† |
13.09±1.50*† |
|
Table 3 Alteration in the catalase activity in the liver of mice treated with different doses of doxorubicin before and after naringin treatment various post treatment times
p<0.05, No symbol: Non-significant
‡: Statistical significance was calculated against control with the positive control i.e DOX treatment alone.
*: Statistical significance was calculated against DOX alone treatment in their respective treatment hours.
#: Statistical significance was calculated against DOX+NIN combination treatment in their respective treatment hours.
†: Statistical significance was calculated against their corresponding 0.5h treatment combinations.
Superoxide dismutase
The SOD activity in the normal untreated mice live has been7.12±11nmol/protein (Table 4) and naringin treatment did not have any significant effect on normal SOD activity (data not shown). Treatment of mice with different doses of doxorubicin caused a dose dependent reduction in the SOD activity at all post-treatment assay times and it was significantly lower than the control (Table 4 & Figure 7). The SOD activity reached to a lowest level after administration of 10 mg/kg DOX, which was almost two folds lower at all post-treatment assay times (Table 4). The SOD activity declined continuously with time until 4 h post-treatment where it was lowest (Figure 8). Naringin treatment before DOX administration did not alter the pattern of decline in the SOD activity in naringin+DOX group, except that the SOD activity was significantly enhanced (Figure 7 & 8). The SOD activity was 2 fold greater at 0.5 h, whereas this elevation was approximately 3.5 fold at 1 and 2 h post-DOX-treatment, respectively (Table 1). Administration of 10 mg/kg b. wt. of naringin before DOX treatment led to a significant rise in the SOD activity at all post treatment times, except for 5 mg at 0.5 h where this increase was non-significant (Table 4). At lower DOX doses the elevation was greater when compared to the higher dose of DOX (Figure 8). The treatment of naringin after DOX administration also increased the SOD activity at all post treatment assay time; however significant increases were recorded only for 1, 2 and 4 h post treatment for 1 mg/kg DOX (Table 4).
Treatment Group |
Dose (mg/kg b.wt.) |
Post Treatment Times (h) |
|||
0.5 |
1 |
2 |
4 |
||
Control |
0 |
7.21±0.11 |
7.21±0.11 |
7.21±0.11 |
7.21±0.11 |
DOX |
1 |
5.01±0.16‡ |
4.44±0.06‡† |
3.84±0.16‡† |
3.54±0.10‡† |
5 |
4.69±0.11‡ |
3.57±0.13‡† |
3.19±0.20‡† |
2.78±0.15‡† |
|
10 |
3.66±0.07‡ |
3.41±0.11‡ |
2.92±0.10‡† |
2.52±0.03‡† |
|
NIN+DOX |
1 |
6.18±0.15* |
5.66±0.08* |
5.41±0.03* |
5.21±0.01*† |
5 |
5.31±0.08 |
4.92±0.09* |
4.53±0.13*† |
4.25±0.04*† |
|
10 |
4.77±0.04* |
4.35±0.03* |
4.25±0.04*# |
4.10±0.04*# |
|
DOX+NIN |
1 |
5.84±0.07 |
5.42±0.11* |
5.13±0.05* |
5.10±0.02* |
5 |
4.73±0.36 |
4.29±0.08 |
3.68±0.21† |
3.44±0.24† |
|
10 |
4.21±0.02 |
4.03±0.11 |
3.82±0.03* |
3.14±0.10† |
|
Table 4 Alteration in the superoxide dismutase activity in the liver of mice treated with different doses of doxorubicin before and after naringin treatment at various post treatment times
p<0.05, No symbol: Non-significant
‡: Statistical significance was calculated against control with the positive control i.eDOX treatment alone.
*: Statistical significance was calculated against DOX alone treatment in their respective treatment hours.
#: Statistical significance was calculated against DOX+NIN combination treatment in their respective treatment hours.
†: Statistical significance was calculated against their corresponding 0.5h treatment combinations.
Lipid peroxidation
The spontaneous lipid peroxidation in mouse liver has been is 0.01±0.005 nmol/mg protein (Table 5) and naringin administration did not alter this status significantly (data not shown). The administration of different doses of doxorubicin to mice resulted in a dose dependent increase in the lipid peroxidation when compared to the control, and a highest lipid peroxidation was observed for 10 mg/kg DOX (Table 5 & Figure 9). There has not been much variation in the lipid peroxidation with time (Table 5). Administration of naringin before DOX treatment significantly reduced lipid peroxidation at all post treatment assay times (Table 5), whereas administration of naringin after DOX treatment also reduced the lipid peroxidation significantly at 0.5 and 1h when compared to DOX treatment alone (Table 5 & Figure 10).
Treatment Group |
Dose (mg/kg b.wt.) |
Post Treatment Times (h) |
|||
0.5 |
1 |
2 |
4 |
||
Control |
0 |
0.1±0.005 |
0.1±0.005 |
0.1±0. 005 |
0.1±0. 005 |
DOX |
1 |
0.18±0.006 |
0.17±0.004 |
0.19±0.002 |
0.19±0.005‡ |
5 |
0.19±0.003 |
0.20±0.002‡ |
0.19±0.003 |
0.20±0.004 |
|
10 |
0.21±0.007‡ |
0.23±0.003‡ |
0.23±0.005‡ |
0.23±0.003‡ |
|
NIN+DOX |
1 |
0.15±0.004* |
0.15±0.005* |
0.15±0.007* |
0.15±0.005* |
5 |
0.16±0.003* |
0.16±0.003* |
0.18±0.02* |
0.17±0.005* |
|
10 |
0.17±0.002* |
0.21±0.003* |
0.20±0.005* |
0.19±0.002* |
|
DOX+NIN |
1 |
0.15±0.002* |
0.16±0.002* |
0.16±0.001* |
0.16±0.003* |
5 |
0.16±0.004* |
0.17>±0.003* |
0.19±0.004 |
0.18±0.001 |
|
10 |
0.19±0.004* |
0.22±0.004* |
0.22±0.004 |
0.21±0.004* |
|
Table 5 Alteration in lipid peroxidation (nmol/mg protein) in the liver of mice treated with different doses of doxorubicin before and after naringin treatment at various post treatment times
p<0.05, No symbol: Non-significant
‡: Statistical significance was calculated against control with the positive control i.e DOX treatment alone.
*: Statistical significance was calculated against DOX alone treatment in their respective treatment hours.
#: Statistical significance was calculated against DOX+NIN combination treatment in their respective treatment hours.
†: Statistical significance was calculated against their corresponding 0.5h treatment combinations.
Doxorubicin is a wide spectrum of chemotherapeutic drug, which is used to treat several malignancies. However, it produces deleterious effects on several normal tissues that may result in the production of second malignancies in the long term survivors.53 The induction of secondary neoplasia is a major stumbling block in realizing its full potential in treating various malignant diseases. The doxorubicin acts by intercalating into the cellular DNA and also by inhibiting the enzyme topoisomerase II, which plays a central role during DNA replication.54 Doxorubicin also acts by producing free radicals that result in the increased oxidative stress in the normal cells.55 DOX interferes with non-enzymatic metabolic reactions in which iron is involved, and leads to reactive oxygen species ROS production.56 Both radical and non-radical ROS have the potential to cause cellular damage leading to tissue toxicity. Therefore present study was undertaken to study the effect of naringin treatment on the DOX-induced oxidative stress.
The use of oxygen for energy production by the aerobic organism has led to the production of various free radicals and other ROS, as a result, cells developed antioxidant system that is capable of preventing and repairing ROS-mediated damages. The enzymatic antioxidants include, but are not limited to superoxide dismutase, catalase, glutathione-s-transferase, glutathione peroxidase, and peroxiredoxin (Prx). Superoxide dismutase was the first antioxidant enzymes to be discovered.57 Glutathione (GSH) a tripeptide that contains a sulfhydryl group and an amino acid derivative serves several important functions within the mammalian antioxidant system. GSH is considered to be the most abundant intracellular thiol-based non enzymatic antioxidant, which is considered by some as the cell’s first line of defense against oxidative stress. It cycles between two forms: the reduced thiol form, GSH, and the oxidized form, GSSG and is converted back to reduced form.58‒60 Doxorubicin treatment reduced the GSH concentration in a dose and time dependent manner, whereas treatment of mice with naringin before or after DOX administration elevated it significantly. The naringin pretreatment afforded better protection against DOX induced depletion than the post-treatment. Similarly DOX has been found to reduce GSH level in mice and rat liver and heart earlier.32,61‒63 Naringin treatment has been found to elevate the GSH concentration in the heart and liver of doxorubicin treated mice and rats.32,63‒65 Similarly, extract of Agele marmalos has been reported to elevate myocardial glutathione in mice.62 Glutamine an amino acid has been reported to protect against the DOX-induced depletion in GSH in rats.61 The reduction in doxorubicin-induced oxidative stress may be due to its ability to neutralize doxorubicin-induced free radicals and ROS or its ability to participate through other enzymatic reactions.66
Glutathione-s-transferases or GSTs are a multi gene family of enzymes, which are found in almost all organisms. The many function of GSTs is to catalyze the coupling of GSH with other electrophilic molecules to detoxify the endogenous and exogenous toxicants. It also modulates cell proliferation and cell death.67 The increased toxicity of DOX may be due to its ability to deplete the GST. The DOX treatment has actually reduced the activity of GST in a dose dependent manner and administration of naringin before and after DOX treatment. The naringin has been reported to elevate the GST activity in mouse heart and liver of mouse and rat earlier.32,63 This elevation in GST by naringin may play an important role in reduced DOX toxicity in the liver.
The hydrogen peroxide is generated during respiration and DOX also aids in its production. The enzyme catalase is present in all organisms that utilize oxygen for energy generation and it plays a crucial role in neutralizing the hydrogen peroxide, which is a highly oxidizing agent. The catalase acts upon hydrogen peroxide, which is broken down into harmless products such water and molecular oxygen.68 The DOX treatment has been found to reduce the activity of catalase enzyme in a dose and time dependent manner, whereas naringin pretreatment of post treatment elevated the catalase activity when compared to DOX treatment alone. Similarly, DOX treatment has been found to decrease the catalase activity in mouse and rat heart and liver earlier.32,62,63,65
The naringin treatment reduced the catalase activity in the mouse liver which is in agreement with the earlier studies where a similar effect has been reported.32,63‒65 Both the treatment of naringin before or after DOX administration was equally effective in raising the catalase activity in mouse liver in the present study. Likewise, Aegle mamrmelos extract attenuated the doxorubicin-induced alleviation in the catalase activity of mice heart.62 Wheat germ oil and phytic acid prevented the doxorubicin-induced decline in the catalase activity in rat liver, kidney and spleen.69
The superoxide dismutases are highly conserved and ubiquitously present enzymes in all organisms and their main function is to convert superoxide cation generated during respiration into molecular oxygen and hydrogen peroxide and play important role in detoxification.70 The DOX treatment reduced the activity of SOD in a dose and time dependent manner and treatment of mice the naringin before or after DOX administration led to an increase in its activity. The naringin pretreatment was more effective than the post treatment. DOX has been reported to decrease the activity of SOD earlier leading to oxidative stress.32,62,63 Naringin treatment has been reported to inhibit the DOX induced reduction in the SOD activity in heart and liver of mice and rats.32,63‒65 Similarly, naringin also suppressed the belomycin-induced decline in the SOD activity.43 Phytic acid and wheat germ oil have been found to arrest the doxorubicin-induced decline SOD activity in rat liver, kidney and spleen.69
The lipids are integral part of membranes and they are the primary targets of ROS leading to the formation of lipid peroxides.71 The estimation of lipid peroxidation serves as an indirect marker of oxidative stress. The DOX induced ROS may interact with membrane lipid producing their peroxides.15 The increased lipid peroxidation by DOX in a concentration dependent manner is due to this activity of DOX. The administration of naringin before and after DOX treatment led to a significant decline in the lipid peroxidation and both treatments were equally effective. DOX treatment has been earlier reported to increase the lipid peroxidation in rat and mice.32,61‒65,72 Naringin treatment has been found to protect mouse and rat liver and heart against the DOX-induced lipid peroxidation.32,63‒65 Naringin has also been reported to protect against iron and bleomycin-induced lipid peroxidation in earlier studies.40,41,43 Similarly L-glutamine has been also reported to protect against the DPX-induced lipid peroxidation.61
The exact mechanism by which naringin attenuated the DOX-induced oxidative stress is not clearly understood. The naringin may have employed multiple putative mechanisms to alleviate the DOX-induced oxidative stress. The DOX produces free radicals by the activation of NADPH oxidase system and naringin has been reported to inhibit the activation of NADPH oxidase leading to the attrition of free radical formation.73,74 Our earlier study has also shown that naringin inhibits the generation of free radicals in vitro,35 which would have been responsible for elevated activities of GST, catalase and SOD higher glutathione contents in liver mice receiving naringin before and after DOX treatment. The DOX has been reported to produce greater amount of free radicals when free iron is available and chelation of iron by naringin may be another mechanism of alleviation of DOX-induced oxidative stress, since naringin chelates iron.41 The naringin supplementation has been reported to up regulate mRNA expression of superoxide dismutase, catalase and glutathione peroxidase genes.75 The transcriptional activation of NF-κB and COX-II by DOX increases oxidative stress and their transcriptional suppression by naringin has been may have also reduced the DOX-induced oxidative stress.76‒79 Nrf2 is an important transcriptional factor responsible for the expression of different antioxidant genes and its suppression by DOX may have rested in the increased oxidative causing a decline in all the antioxidants. The presence of naringin may have triggered the activation Nrf2 signalling pathway reducing the DOX induced oxidative stress.80
This work was supported by a grant no. F4-10/2010(BSR) UGC from the University Grants Commission, New Delhi, India.
Author declares that there is no conflict of interest.

©2017 Jagetia, et al. This is an open access article distributed under the terms of the, which permits unrestricted use, distribution, and build upon your work non-commercially.