MOJ
eISSN: 2576-4519


Research Article Volume 3 Issue 6
Biomedical Engineering and Systems Department, Cairo University, Egypt
Correspondence: Sherif H. ElGohary, Biomedical Engineering and Systems Department, Cairo University, Giza 12613, Egypt
Received: November 16, 2019 | Published: December 3, 2019
Citation: Muluneh MB, Gohary SHEI. Thermal effect for optical imaging of knee osteoarthritis. MOJ App Bio Biomech. 2019;3(6):142?149. DOI: 10.15406/mojabb.2019.03.00122
Photo-diagnosis of knee diseases can providenoninvasive, contrasted, deep penetrating and higher resolution optical and temperature images. In this study knee joint were modeled and simulated using finite element method, optical images and temperature images were generated for injured, osteoarthritis (OA) and normal knee conditions. Monte Carlo and diffusion approximation equation were used for absorption mapping and bioheat transfer equation to generate temperature information. Furthermore, the results found by Monte Carlo and diffusion approximation equation for the same parameters were compared. The results obtained in both Monte Carlo and diffusion approximation revealed that temperature mapping is capable for differentiating injuries of knee, OA and normal knee joints compared with optical absorption images. In the study the average net temperature scored was 0.12 Kelvin for normal and 0.13 Kelvin for OA joints, which is significant at 3μs ,which become more significant at its logarithmic value to produce temperature images and small to produce thermal damage on the tissue.To conclude, photo diagnosis knee joint model mimics for detecting injuries and analyzing diseases of knee and other similar boney-ligament/cartilage complex body structures in diagnostic imaging and monitoring procedures by using the combination of thermal and optical absorption properties of joints. This work has valuable impact for optical diagnostic imaging.
Keywords: osteoarthritis, monte carlo algorithm, diffusion approximation, bioheat transfer equation, finite element method
Knee is the most important hinge joint with complex geometry in our musculoskeletal system, which allows stability, flexion, extension and slight internal and external rotation in our entire day to day activities. Knee mainly consists bone (femur, patella, tibia and fibula), cruciate ligaments (anterior cruciate ligament (ACL) and posterior cruciate ligament (PCL), collateral ligaments (lateral collateral ligament (LCL) and medial collateral ligament MCL) and cartilages (meniscus and articular cartilages). Meniscus and articular cartilages used as shock absorbers, which helps to move bones smoothly over one another throughout their range of motion. Cruciate and collateral ligament prevent backward-forward movement and side to side movements of the bones respectively. However, knee is highly vulnerable to injuries that might happen due to vehicle accidents, during physical exercise, and other sudden events in our day to activities. In addition, knee joint highly affected by diseases like; osteoarthritis, rheumatoid arthritis, osteonecrosis and other syndromes which are afflicting millions of people every day throughout the globe. Osteoarthritis only affects around 250 million people world wide.1and more than 27 million people.1 According classic rehabilitation statistical unto date report, one-third of all Americans experiencing knee pain at some time or another and around 100 million people suffer from chronic pain annually. According to Genome-wide association study, half of people aged above 50 suffer knee pain.6 Ligament, cartilage injuries and OA are the most common chronic knee pain and cause of disabilities.2–5 In USA, there are about 60 acute meniscal tear per 100000 people7 and around 200000 ALC injuries per year.8 According to national health survey around 3 persons have OA per 10 people with disabilities.9
In order to improve treatment outcome, X- ray, CT-scan, Arthroscopy, Ultrasound (US) and Magnetic Resonance Imaging (MRI) imaging modalities have been used to monitor and diagnosis knee problems. However, X-ray and CT-scan uses ionizing radiation which causes cancer and might result, different stochastic and deterministic effects. Unlike bony fractures, they are less sensitive for imaging soft tissues like, ligaments and meniscal and articular cartilages which are the most common in knee injuries and most important parts for early detection knee disease like osteoarthritis, rheumatoid arthritis etc. Arthroscopy needs insertion of the scope to joint which makes it quite invasive and sometimes it may lead serious complications. Ultrasound and MRI are safe and noninvasive imaging modalities. US used for imaging joints mostly for infants having soft bone and soft joints. However, it has limited penetration depth for joints and bones which makes it limited for monitoring particularly boney-ligament/cartilage complex geometries. MRI is one the most power full imaging modalities for soft tissue imaging including knee joint ligaments and cartilages. However, MRI even has difficulties to image knee under different flex position and to find highly resolved cartilage images in conventional machines. In addition, MRI needs special requirements to image patients with pacemaker and patients having different metal implant. Optical imaging modalities are noninvasive and non-ionizing which can provide a variety of functional and structural information with good penetration depth, better resolution, high sensitivity and specificity compared to other imaging modalities. Optical imaging modalities has been made considerable progress towards a novel biomedical imaging modality that uses near-infrared (NIR) light,10,11 near infrared diffuse optical tomography can be used for diagnosis of osteoarthritis.12 Photoacoustic tomography is another emerging imaging modalities under research, which has been showing its potential for imaging biological tissue.8,13 and also in vivo studies have been made on detection of finger joints and osteoarthritic, rheumatoid arthritis diseases.8,14,15 Furthermore, Researches has been made to understand temperature distribution in biological tissues since temperatures is one of vital sign which indicates disease. Thermography study by I. A. Nola 2011, satates that heat distribution over the skin surface near the joint differs between normal patients and the patients with rheumatoid and arthritis osteoarthritis.17
This study, investigates noninvasive and deep penetrating photo-diagnosis method for the knee joint by using differences in optical absorption, physical and thermal properties between tissues and differences between normal and abnormal tissues using non-ionizing light source. Different biological tissues have differences optical absorption when light is applied to them and have different physical and thermal properties, which results to have different energy deposition and temperature distribution. There is also difference in optical absorption, thermal and physical properties between normal and diseased joints for example between normal joint and rheumatoid arthritis joint and OA affected joints.10,12,18,19 These distribution differences in optical absorption and temperature between the tissues and between the normal and diseased joint can provide helpful information to monitor and diagnosis problems like, ligament and cartilage injuries and diseases of the joints. In this study, normal knee joint and common meniscus and ligament injuries were modeled and simulated using finite element method. Pluses of laser light were generated and applied to model and optical images and temperature images were generated by using different optical, physical, and thermal properties of the knee joints for arthritic and normal knee joint conditions. Monte Carlo algorithm and diffusion approximation equation and the combination of them with bioheat transfer equation involved to generate optical images and temperature images respectively. Furthermore, results found by both Monte Carlo and diffusion approximation are compared for the same optical absorption and physical and thermal properties. This model expected to mimic for differentiating knee joints and detecting and analyzing injuries and diseases of knee and other similar body structures in diagnosis and monitoring procedures.
Computer aided design have been used for modeling of the normal and injured knee joint and finite element method is used for simulation. Injuries were model by making small cut on meniscus and lateral-collateral and cruciate ligaments. Light applied to the model and Monte Carlo algorithm and diffusion approximation equation were used to predict absorption by joints to generate optical maps and bioheat transfer equation for predicting and generating temperature maps of the knee joint from optical energy absorption maps. In addition, by using the same procedure simulation were done for osteoarthritic knee conditions and the results are compared with normal knee.
Knee anatomy model
In this model bones (femur, tibia fibula and patella), collateral ligaments (LCL and MCL), cruciate ligament (ACL and PCL) and articular cartilages are included. Figures 1 briefly explains the anatomy the knee joint model what it looks like from the inside.
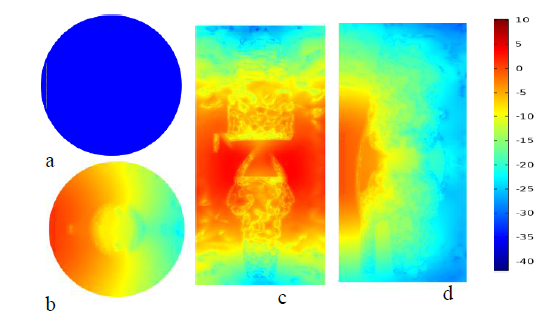
Figure 2 plots in (a) shows fluence plotted using real value (b), (c) and (d) are fluence distribution, at transverse, frontal, sagittal plane of normal knee joint at natural logarithm scale in color rainbow respectively.
Light application for optical and temperature mapping
In order to perform realistic simulation, a Gaussian laser source function has been created. The function generates pulsed laser light which has a wavelength of 800 nm, energy density of 22mj/cm2 and pulse width of 100 nanosecond. The laser source has rectangular shape and applied perpendicular to the sagittal plane on sides of the knee and to the frontal plane on the opposite side of knee cape in of the knee however, all the results in this paper displayed at one side for demonstration. Diffusion approximation equation and Monte Carlo algorithm were applied to generate fluence distribution or energy deposition of the tissue respectively. Bio-heat transfer equation used to generate temperature response and distribution in the knee joints by using the solution found in both Monte Carlo algorithm and diffusion approximation as locally distributed sources.
Monte carlo algorithm
Mont Carlo algorism is the most widely used algorism for many applications, in particular it also used to predict the propagation of light and photon absorption in biological tissues. Monte Carlo solution defines grid over solution space and scores physical quantities (reflection, transmission and absorption = energy deposited) at each grid element as the program traces number of photons. In Monte Carlo algorithm, number photons are used as laser source and wave length and optical parameters (absorption coefficient, scattering coefficient, anisotropy and refractive index) are assigned for the laser source and for each biological tissue type respectively. To be consistent the equivalent number of photons was estimated for the chosen laser source. equation (1) shows the conversion process of light energy density to number of photons.
(1)
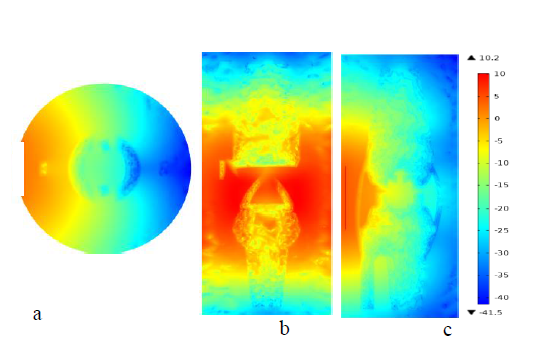
Figure 3 surface plots in (a), (b)and c are natural log scaled fluence distribution of OA knee joint taken at transverse plane, sagittal and, frontal anatomical planes respectively.
Where number of photons per unit volume (photons/𝑐𝑚3), 𝐸 is energy density of light(𝑚𝐽/𝑐𝑚2),is pulse width of the laser source (nano-sec), 𝑐 is speed of light (m/sec), 𝜆 is wave length of the laser light source (nm) and ℎ plank’s constant (~6.626𝑥 10−34𝑘𝑔𝑚2𝑠2⁄ 𝑜𝑟 𝐽/𝑠𝑒𝑐 ). Optical absorption properties used in this study are shown in Table 1 for both osteoarthritic and normal knee joint.
Tissue Name |
µa (mm-1) |
µs (mm-1) |
g |
n |
|
|
|
|
|
|
|
Normal Joint |
|
|
Bone |
0.08 |
35.71 |
0.93 |
2.1 |
Ligament |
0.021 |
17.5 |
0.91 |
1.4 |
Meniscal |
0.015 |
12.5 |
0.9 |
1.37 |
Articular |
0.01 |
11.11 |
0.9 |
1.37 |
cartilage |
|
|
|
|
Background |
0.007 |
1.2 |
0.92 |
1.34 |
|
|
OA Joint |
|
|
Bone |
0.036 |
47.84 |
0.93 |
2.1 |
Ligament |
0.031 |
27.5 |
0.91 |
1.4 |
Meniscal |
0.028 |
18.70 |
0.9 |
1.37 |
Articular |
0.02 |
15.25 |
0.9 |
1.37 |
cartilage |
|
|
|
|
Background |
0.007 |
1.2 |
0.92 |
1.34 |
Table 1 Optical properties: Absorption coefficient (µa), Scattering coefficient (µs), anisotropy (g) and Refractive index (n) for normal and OA Knee joint
Diffusion approximation
Diffusion is also one of the governing equations used to track the propagation of light through the biological tissues when scattering effect, the tissues assumed higher than absorption effect particularly 600 nm to 1000 nm range of the light spectrum. Diffusion approximation for light propagation represented by (2).
(2)
(3)
(4)
(5)
Where, D is diffusion coefficient (m), is reduced scattering (𝑚−1), 𝑑𝑎 is damping mass coefficient (𝑠𝑒𝑐/𝑚), 𝑢𝑎 is absorption coefficient(𝑚−1), 𝑢𝑠 is scattering coefficient(𝑚−1), U is Fluence rate ( 𝑊/𝑚2) and 𝐹 is the source term (𝑊/𝑚3). In diffusion approximation, finite element method was used to solve the equation using a finer mesh, consists of 323131 domain elements, 37964 boundary elements, and 3621 edge elements.
Bioheat transfer equation
Bioheat transfer equation one the most common heat transfer equations and it has been used to study and prediction local temperature distribution in living tissue. It has been using as a standard method for prediction of temperature distribution in living tissues and the influence of the metabolic heat generation and the blood perfusion.20,21 This study investigated energy deposition due to optical absorption when light shined to the tissue and the resulting heating response and temperature distribution in the knee joint. Fluence distributions (optical energy absorption) found by both Monte Carlo and diffusion were used as local heat source for bioheat transfer equation for prediction of temperature distributions in the knee joint and for mapping the resulted temperature. Equation (6) below briefly describes bioheat transfer equation.
(6)
(7)
(8)
Where T and 𝑇𝑏 (𝐾) are temperatures of the tissues and temperature of the blood, 𝞺 and 𝜌𝑏 are density of density of tissue and blood(𝑘𝑔/𝑚3), 𝐶𝑝 and 𝐶𝑝𝑏 are specific heat capacity of tissue and blood (𝐽/𝑘𝑔℃), Q and 𝑄𝑚𝑒𝑡 (𝑊/𝑚3)are energy deposition rate, and metabolic heat source, k (𝑊/𝑚℃)and 𝑤𝑏 (1/𝑠𝑒𝑐) thermal conductivity of tissue and blood perfusion rate respectively. In this study 310.15 Kelvin has been used as temperature of the blood and other parameters are shown in the Table 2 below. Source: from https://itis.swiss/virtual-population/tissue properties /database22 and Silva FS. et al.23,24
Tissue Name |
ρ |
K |
CP |
wb |
Qmet |
|
(Kg/m3) |
w ⁄m.℃ |
J⁄ kg.℃ |
(1/s) |
(w ⁄m3 ) |
|
|
|
|
x10-3 |
|
Bone |
1585 |
0.31 |
1785 |
0.40 |
368.3 |
|
|
|
|
|
|
Ligament |
1142 |
0.47 |
3432 |
0.48 |
450 |
Meniscal |
1100 |
0.49 |
3568 |
0.58 |
0.00 |
Articular |
1100 |
0.49 |
3568 |
0.58 |
0.00 |
cartilage |
|
|
|
|
|
Blood |
1050 |
0.52 |
3617 |
166.7 |
0.00 |
Background |
911 |
0.21 |
2348 |
0.29 |
3.9 |
Table 2 Physical and thermal properties: Density(ρ), Thermal conductivity(K), Specific heat (Cp), Blood perfusion rate (wb), and Metabolic heat source (Q)
The following plots are plotted by diffusion approximation, Monte Carlo algorithm for fluence distribution and both diffusion approximation and Mont Carlo algorithm in combination with bioheat transfer equation for temperature distribution mapping. All plots in fluence distribution are in W/m2 and temperature plots in kelvin. For the purpose of clarity and comparison the results arranged under the subtitle diffusion approximation temperature and subtitle optical absorption results and temperature plots. For each knee joint case the images are plotted using real valued solution and its natural logarithmic scale value in both color map and gray scale for transverse plane to see differences and to compare Monte Carlo solution and diffusion approximations solutions for both temperature and optical absorption maps. Three slice planes were chosen, one for each anatomical plane, sagittal slice plane which touches cruciate ligaments (ACL and PCL), frontal plane passes through lateral collateral ligaments (LCL and LCL) and the transverse plane cut at on the meniscus and ligaments without touching the bone.25–27
In addition to the surface plots temperature vs time and fluence vs time graphs were plotted and analyzed for both normal and OA knee joint by taking points at bone, articular cartilage, and meniscus at the same depth and at ligaments. These plots were demonstrated that there are clear differences in temperature and fluence distribution rise with time between different joints. Furthermore, line which crossed the knee joint, starting the light source which moves deeper through the collateral ligaments and the meniscus were taken and fluence distribution and temperature distribution across the line were plotted and analyzed for both normal and OA knee joints.
Light absorption using diffusion approximation
Figures 2shows that fluence distribution of the normal and OA knee joint at the transverse, frontal and sagittal slice plots. These images are constructed using diffusion approximation solutions for natural logarithmic values because of log scale plots were resulted high contrasts and better resolution than real valued images. Figure 2a shows the surface plot generated using real values, has low resolution relative to the logarithmic plots in figure 2b, c & d. In plot figure 2c fluence distribution across the image is uniform because the plane found at the same depth to laser source and in the middle, there is high absorption relative to upper and the lower edge side because of the laser shine in the middle near joints. Surface Plot in figure 2b & 2d shows the propagation of light across the knee joint from the source to the inside. The white line at the edge shows where light source applied. In similar manner figure 3 shows that fluence distribution of OA knee joint at the same anatomical planes slice as the normal knee joint.
Figure 4 shows the fluence distribution of injured knee joint at three anatomical slice planes in similar manner for normal and OA knee joints. For injured knee joint 0.01mm thickness complete tear was made at the meniscus, cruciate and collateral ligaments. The surface plots generated using the same optical parameters the normal knee joint. The arrows indicate the place where the injury on the joints exists.
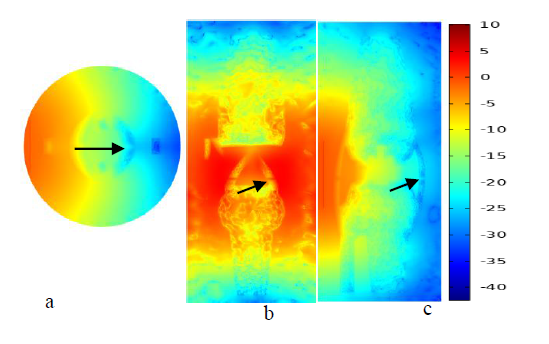
Figure 4 plots in (a) (b)and (c) show log scaled fluence distribution at transverse, frontal plane and sagittal for injured knee joint. The arrow indicates where the injuries occurred.
Temperature results using diffusion approximation
Temperature plots were generated by using energy distribution over unit volume with respect to each position and time in the knee joint as local external source for bioheat transfer equation in order to predict the temperature change due to light absorption. Thermal and physical parameters had been using the same values for these simulations for both normal and OA knee, which are listed in Table 2. However, in actual case the values are physical and thermal properties altered for OA diseased knee joint, for example density of the bone and blood perfusion rate for bone and ligaments. Figures 5-7 show that temperature distribution of knee joint for three anatomical plane slices in similar manner for fluence distribution plots. The slice was taken at same location as fluence distribution slices for all anatomical planes. The arrows on Figure 5 indicates that temperature map clearly resolved articular cartilage, bone, meniscus and collateral ligaments compared with fluence plots in Figure 2.
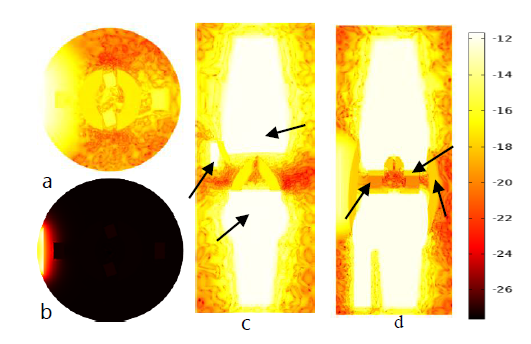
Figure 5 plots in (b) real valued temperature plot at transverse plane and (a, c and d) are natural log scaled temperature surface plots of normal knee joint at the transverse, frontal and sagittal planes.
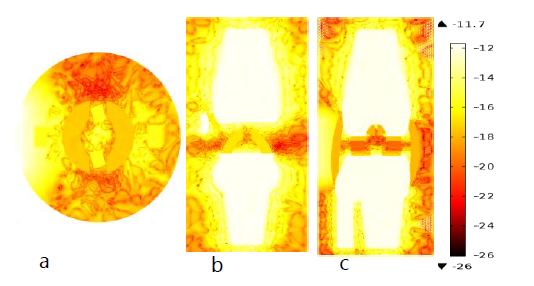
Figure 6 (a), (b)and (c) are natural log scaled temperature surface of OA knee joint at the three anatomical location in thermal light.
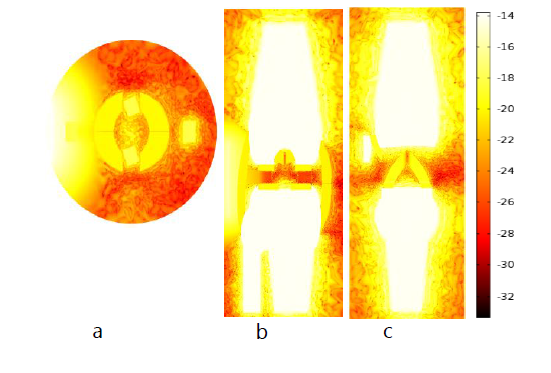
Figure 7 Plot (a), (b) and plot (c) are natural-log scale temperature distributions at transverse, frontal and sagittal planes in thermal light map.
Monte carlo results
Monte Carlo results found using Monte Carlo algorithm for light propagation in the side the joints for optical absorption imaging and using combination of Monte Carlo with bioheat transfer equation to generate temperature images. All images are taken on the same plane as diffusion approximation.
Light absorption results using monte carlo
For Monte Carlo results for real fluence distribution images only the transvers plane slice was included in the report for comparison with diffusion approximation results. Since it is demonstrated that temperature plots show better resolved and contrasted image fluence images for other two planes not included. Figure 8 shows Fluence distribution at both real valued (a) and natural logarithmic scale(b) plots for normal knee joint at transverse plane. In this image we see a better image constructed using real value Figure 8a compared to diffusion approximation resulted image Figure 2a, however ligaments are not resolved well.
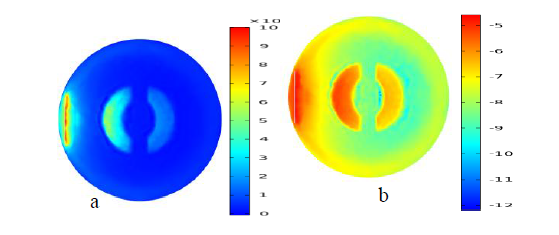
Figure 8 Fluence distribution at both real valued and logarithmic scale plot for normal knee joint at transverse plane.
Temperature distribution using monte carlo
Figures 9-13 shows that temperature plot for normal, OA and injured knee respectively as diffusion approximation. graphs in Figures 11&12 shows that the fluence distribution and temperature distribution through the line for normal (a) and OA (b) knee joint respectively. The arc line starts from the source and moves towards the inside until the end of the knee, and it passes through the collateral ligaments and the meniscus in the same direction as light propagation. This graph demonstrates both attenuation light as it goes deeper and deeper and the absorption differences in the meniscus and collateral ligaments. In OA joints collateral ligaments have higher absorption relative to normal collateral ligaments (traced by black square), however OA meniscus (traced in red rectangle) have lower absorption than normal one. In addition, temperature plots show better resolution between joints, however it is less effective than fluence distribution to detect differences in OA and normal joints, this is due to the fact that thermal and mechanical properties used for the simulation were the same as the normal due to inaccessibility of data for OA joint. we knew that in real case the thermal and physical properties (density, perfusion rate other thermal properties) are not the same so that temperature could improve results and show the difference between normal and OA knee joint.c
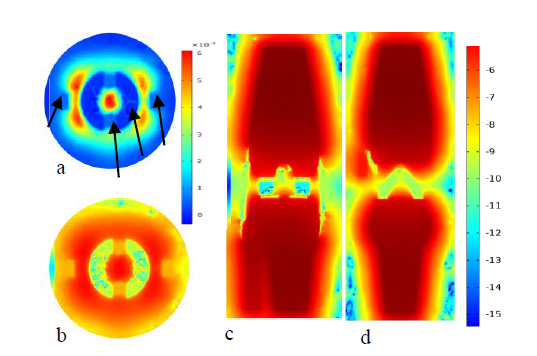
Figure 9 Plot (a) and (b) are temperature distribution of normal knee joint for both real valued and log scale at the transverse plane respectively. Whereas plot(c)and(d)are temperature distribution at frontal and sagittal plane using Monte Carlo algorithm.
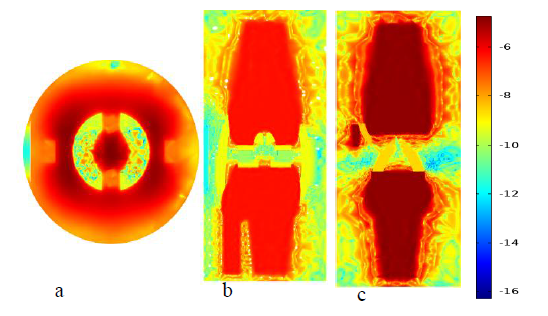
Figure 10 Plot (a), (b) and plot (c) are natural log scale temperature distributions of OA knee joint generated using Monte Carlo results at transverse, frontal and sagittal planes.
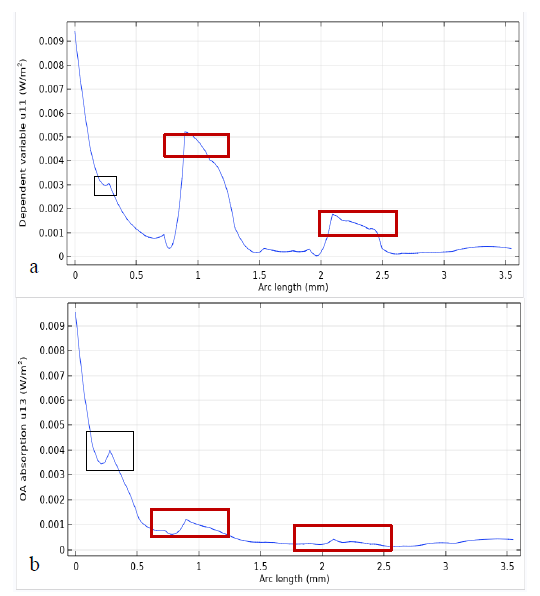
Figure 11 The graphs (a) and (b) shows that the fluence distribution of normal and OA knee joint respectively.
The author declares that there is no conflict of interest.
This work investigated potential problems of the knee joint and attempted to develop thermal effect diagnosis method of imaging by using the combination of both optical absorption, physical and thermal properties of different joint components of the knee. In addition, two most commonly strategies for light propagation in the tissue, Monte Carlo and diffusion approximation Equation are compared and by combining them with bioheat transfer equation temperature imaging was simulated. According the results photo-diagnosis using thermal effect resulted from the combined effect of optical and thermal properties of the tissue has been shown its potential towards diagnosis of knee joint and other similar structures which are difficult in most diagnostic imaging modalities. As future work experimental work and assessment for many patients at different sex and age will be made and efficient reconstruction algorithms in order to minimize artifacts while image reconstruction process.
The author declares that there is no conflict of interest.

©2019 Muluneh, et al. This is an open access article distributed under the terms of the, which permits unrestricted use, distribution, and build upon your work non-commercially.