MOJ
eISSN: 2576-4519


Review Article Volume 3 Issue 1
1Institute of Aeronautical Engineering, India
1Institute of Aeronautical Engineering, India
2Sreyas Institute of Engineering & Technology, India
2Sreyas Institute of Engineering & Technology, India
Correspondence: Dwivedi YD, Institute of Aeronautical Engineering, Dundigal, Hyderabad, India
Received: October 12, 2018 | Published: January 23, 2019
Citation: Dwivedi YD, Bhargava V. Aerodynamic characterization of bio inspired corrugated wings. MOJ App Bio Biomech. 2019;3(1):1-10. DOI: 10.15406/mojabb.2019.03.00092
Wings of a dragon fly found in nature possess corrugations on its surface and known to exhibit efficient aerodynamic characteristics. In the present work, aerodynamic analysis of bio inspired profiles corrugated A, corrugated B and NACA 0010 were studied using 2-D panel method and wind tunnel experimentation. Coefficient of lift, drag and glide ratio for all profiles were evaluated at two Reynolds numbers 1.9x10⁴ and 1.5x10⁵ and for angles of attack between 00 to 160 The panel method results have been validated using current and existing experiment data as well as with computational work from cited literature. A good agreement between experimental and panel methods were found for low angles of attack. The results demonstrated that till 80angle of attack higher lift coefficient and lower drag coefficient are obtainable for corrugated profiles compared to NACA 0010. Validation of surface pressure coefficients for all three profiles using panel method at 40 angles of attack was done. Contours of non-dimensional pressure, velocity are demonstrated from -100 to 200 angles of attack. For low Reynolds number flows good correlation between experiment data and computational methods showed that corrugated profiles exhibit better aerodynamic performance than NACA 0010.
Keywords: corrugated airfoil, lift coefficient, drag coefficient, panel method, reynolds number
The nature gives effective, robust and straightforward solution for engineering problems and this practice is becoming very popular day by day.1 The deep understanding of nature, how it overcomes the problem of flight in natural flyers like birds and insects have led to tremendous improvements in the aerodynamics of manmade aerial vehicles. Creatures of flight such as birds and insects have inspired human to design aircrafts of various types and sizes. Specifically, the smooth airfoil shapes of familiar aircrafts are inspired by the bird’s wing.2 The smaller aircrafts like unmanned aerial vehicles (UAVs) operate at significantly lower Reynolds number, where the performance of the conventional airfoils is no longer better.3 The aerodynamic effects of low Reynolds numbers on corrugated wings were studied by several researchers4–8 It was found that most insects’ wings specifically dragonflies and locusts have high agility and maneuverability. These insects are capable to hover, climb, dive, land and take-off at different wind speeds and ambient conditions. Another investigation9 reported that the remarkable aerodynamic performance of dragonfly wings was caused by the muscular morphing and wing geometry specially the wing corrugation. Extensive biological and aerodynamic study has been carried out by many researchers to demonstrate the reasons for the superior flight by flapping motion of the wings and the corrugated wing profile (airfoil)10 revealed that the flapping produces significant lift by generating low pressure leading edge vortex (LEV) while corrugated cross section, reduces the overall flow separations in both flapping and static motion. The effects of corrugations were demonstrated, and the results are reported in several experimental studies such as.11,12 These reports confirmed that the corrugation initiates an early transition to turbulent flow thus reducing separation and delay in stall. A better aerodynamic characteristic obtained using pleated airfoil at first sight seems to contradict with the idea of streamlined profiles used in conventional aircrafts. However recent studies by 13–16, suggested otherwise. There also have been several studies related to aerodynamic forces which were conducted on actual dragonflies and dragonfly modeled airfoils to measure the forces associated with both flapping and gliding modes of operation. Some of the more no and recent studies for gliding flight of a dragonfly wing are the numerical and experimental studies conducted by 17–22 More recently23–25 have performed 3-D computational study on different types of corrugated wings by using commercially available computational software. However, these studies have been primarily conducted at chord Reynolds number 104 or less, which is considerably lower than the range used for MAVs. The aim of the present work is analyze two different types of corrugation in relation to coefficient of lift, drag and glide ratio, which are also relevant for micro aerial vehicles. From author’s knowledge no studies have been conducted before on bio-inspired corrugated wing using panel method. The other aim is to explore whether the 2-D panel method can predict low Reynolds number flows fairly accurately and agree with experiment data conducted on similar profiles.
Numerical formulation
Panel methods are designed for potential flows which are commonly used in analysis of 2D lifting flows that have negligible or low viscosity. For computational analysis, it is known that velocity potential function can be readily used to describe the aerodynamic flow field around the arbitrary shaped body than streamline function. This is because both for 2D and 3D analysis of flow, velocity field exists at every coordinate on surface, however for stream function the derivatives of velocity vector becomes complex for analysis of 3D flow. The basic approach involved in panel methods is a combination of source along with sink which have equal strength, K present in a uniform distributed flow pattern around an arbitrary body. Source strengths are defined in such a way that appears in the fluid field as streamlines at a uniform rate while sink disappear at a same rate26 For any given arbitrary shaped body, the geometry is divided into specific no of panels representing the surface. The panels represent the approximation of geometry surface, using straight line segments. For a given AOA, α, the steps involved are as follows
Number the panels sequentially from 1 … N
It must be noted that in MATLAB for all the variables i.e. velocity and its components, matrices are essential and required to solve the system of discrete equations. The surface pressure coefficient can be expressed using the Eq. (1) Another boundary condition also known as “Kutta condition” is imposed to account for the flow near the trailing edge so that tangential velocity vector for trailing edge panels equal in magnitude on upper and lower surfaces of airfoil. The surfaces represented by the panels are typically solid rectangular or curvilinear areas upon which the above conditions are applied. Therefore the system of linear algebraic equations are solved for N unknown source strengths, i, using the influence coefficients and written in matrix form as shown in flow chart for computational routine in Figure 1. The pressure acting at any collocation point i on panel surface can be expressed in non-dimensional form as in Eq. (1)
The number of panel nodes used in the simulation is 35 and the maximum panel angle is 76.770 in airfoil geometry. The lift and drag coefficient for the standard airfoil specimens by Pamadi (2004) can be found using Eq. (2) & Eq. (3)
(2)
(3)
where ρ is fluid density, U is free stream velocity and S is plan form area, the coefficients of total lift CL and total drag CD . They are obtained using the pressure coefficient between upper and lower surfaces for each pane, multiplied with its panel length and integrating them at any given angle of attack. Further, the lift and drag coefficients could also be evaluated using normal and tangential force influence coefficients as given by Eq. (4) and Eq. (5)
(4)
(5)
Aerodynamic performance of a wing during gliding can therefore be determined by Eq. (6)
(6)
Geometry of profiles
The geometries of corrugated profiles were selected based upon the previous experimental and numerical investigations27–29 It can be seen from Figure 2A, for corrugated A profile, the corrugations are observed throughout its chord length. For corrugated B profile, sharp peaks are present near the leading edge up to 30 % of chord length followed by a broad hump present towards the trailing edge as shown in Figure 2B. The corrugated profile used by Kessel, Murphy and Hu resembles the shape of corrugated A profile used in the present study, at the leading edge, and up to~50 % of chord length while the profile used by Ho and New (2016) resembles closely to the corrugated B profile. It is also identical to the profile 2 used by Kessel in his investigation. These similarities in profiles enable better validation of results with those obtained from the earlier computational investigations.30
Experimental setup
The low speed subsonic open circuit wind tunnel facility was used for the present experimental work (Table 1). It has three main sections, an inlet section, nozzle and test section and a diffuser section at the exit of the tunnel. The dimensions of the sections and the corresponding principal functions are shown in Table 2. Schematic representation of the open circuit wind tunnel test section used for experiments is shown in Figure 3A. The smoke rake provided in contraction cone just before the test section is used for smoke flow visualization. Velocity and pressure distribution can be measured by the inclined tube manometer as shown in Figure 3B. These two limbs of the manometer are connected to the static pressure holes, one in the settling chamber just before contraction side and the other to the start of the test section. The reading in the manometer shows the dynamic head of the fluid in the test section and it serves as the reference for keeping the tunnel speed constant. The inclination of the manometer is kept at 300 to the horizontal, at this angle the liquid column length change is twice to the vertical head, to provide better accuracy. Tunnel is also provided with Pitot-static tube, which can be traversed across the tunnel section. The fan is connected with variable speed motor, which is varied by AC controller and motor required 3 phase A.C power. Which is equipped with six component force balance, pressure distribution system, and manometer. The snapshot of full experimental setup is shown in Figure 4A and the fabricated corrugated A profile in wind tunnel is shown in Figure 4B.
Profile |
Chord [m] |
Max. thickness[m] |
Thickness /chord ratio [%] |
NACA 0010 |
0.12 |
0.012 |
10 |
Corrugated A |
0.12 |
0.006 |
5.0 |
Corrugated B |
0.12 |
0.008 |
6.6 |
Table 1 Dimensions for NACA 0010, Corrugated A and Corrugated B air foil
Nozzle and test section |
||
Contraction ratio |
9:1 |
Used to increase speed of incoming air flow |
Contraction length |
1.8m |
Distance over which air speed is incremented |
Stainless screens |
8 x 16 grid |
Intended to reduce turbulence in test section |
Test section |
0.6m x 0.6m x 2m |
Space to install model test specimen |
Max wind speed |
50 m/s |
Design speed of wind tunnel |
Diffus or Section |
||
Axial flow fan |
1.3m |
To produce potential flow inside the tunnel at given free stream condition |
Fan duct diameter |
~1.4m |
Diverging at the exit, with blade clearance, |
Motor and stand |
~20kW |
Space to provide mounting and power axial fan |
Diffusor /Transition |
|
Reduces wind velocity |
Inlet section |
||
Settling chamber |
1.8m x 1.8m |
Constant air flow stream ahead of contraction |
Honey comb size |
0.025m x0.025m x0.2m |
Filter particulate matter from air flow stream |
Table 2 Wind tunnel specifications
Pressure coefficient distribution
A comparison of the pressure coefficients for upper and lower surfaces of NACA 0010, Corrugated A and Corrugated B profiles are obtained using panel method along the chord length for 40 angles of attack and for Re ~19000. At 10% of chord length from the leading edge, the difference in pressure coefficient between upper and lower surfaces is highest, which in turn causes high lift coefficient. The pressure coefficient for NACA 0010 profile is found to decrease smoothly and for both the corrugated profiles the pressure distribution is in zig-zag pattern along the chord near the sharp edges of corrugations. Beyond 40% of chord length the pressure coefficient rises up in Corrugated A and corrugated B profiles, in comparison to NACA 0010 profile due to the presence of corrugation in Corrugated A and hump in Corrugated B profiles as shown in Figure 5A. It can also be seen from Figure 5B that pressure coefficient for flat plate is smooth without any abrupt jumps along its length. For Corrugated A and Corrugated B profiles, the effect of corrugations is seen as pressure peaks due to rapid fluctuations in the velocity distribution. The contours for the pressure coefficient for three profiles are shown in Figures 6(A-C). It can be observed that pressure coefficient tends to rise with positive angle of attack however, for negative angles of attack fluctuations are observed near the corrugated surfaces. However, for NACA 0010 profile smooth contours are seen along chord length and resemble a symmetric pattern.
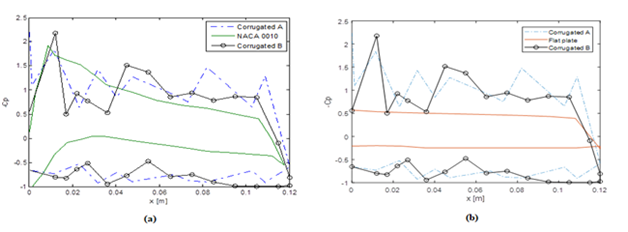
Figure 5 (A) Pressure coefficient distribution of NACA0010, Corrugated A and Corrugated B profiles, (B) Corrugated A, Corrugated B and flat plate using 2D panel method at 40 angles of attack at Re~19000.
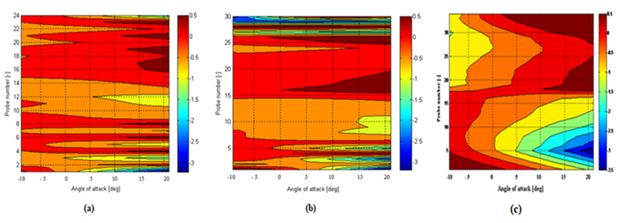
Figure 6 Pressure coefficient distribution of (A) Corrugated A (B) Corrugated B (C) NACA 0010 Probe 1-14, upper surface & probe 15-27 lower surface of corrugated A, Probe 1-15, Upper surface & probe 16-31, Lower surface of corrugated B profile, at different angles of attack, -100 to 200.
At 20% chord length, for both corrugated profiles the velocity increased nearly 40% for positive angle of attack. However, for negative angle of attack it is found to be less than free stream value of 20m/s. At 40% chord length, the velocity is found to decrease in similar trend. Since NACA 0010 is a smooth and symmetric profile, there was no decrease in tangential velocity observed at 40% chord length. The pressure distribution also revealed that as the angle of attack increases the pressure coefficient is increasing on the upper surface near the rough edges of the corrugation. The trend is same for all angles of attack, from -100 to 200 because of symmetry in geometry. In contrast the pressure coefficient contours for both corrugated profiles obtained using panel method on the lower surface is less prominent due to the decrease in the velocity gradient between the corrugations. Further for corrugated B profile they appear smooth but showed similar trends with corrugated A due to corrugations near the leading edge and broad hump near the trailing edge. The pressure distribution also revealed that as the angle of attack increases the pressure coefficient is increasing on the upper surface near the rough edges of the corrugation which is seen for all the profiles. For a given Reynolds number, the forces acting on profile surfaces are directly related to the pressure difference between the upper and lower surfaces
Further, from Figures 7A & 7B the tangential velocity distribution on the surface of both corrugated profiles showed abrupt variations near the corrugations. For NACA 0010 and flat plate this trend is not seen as depicted in Figure 7C From Figures 8A & 8B, the velocity contours for corrugated profiles the fluctuations in velocity are seen near the corrugated peaks whereas for NACA0010 profile a symmetric pattern with a continuous increase of velocity near the leading edge is observed with increasing angle of attack i.e. from -40 to 150 (Figures 9(A-C) represent the contours of pressure coefficient for corrugated profiles and compared with flat plate. Similarly Figures 10(A-C), Figure 11(A-C) show the tangential velocity distribution and velocity contours of the same profiles respectively.
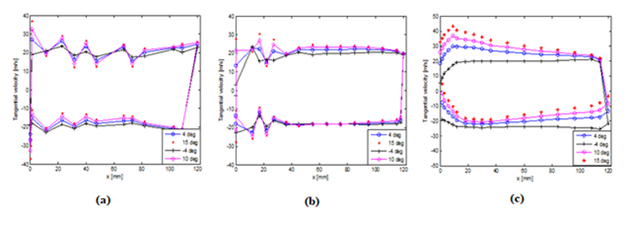
Figure 7 Tangential velocity distribution along chord (A) for Corrugated A (B) Corrugated B, (C) NACA 0010 profiles at -40, 40, 100 and 150angleof attack for Re ~1.5 x10⁵.
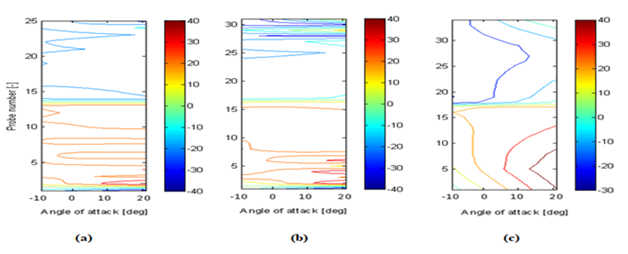
Figure 8 Velocity contours of (A) corrugated A, (B) corrugated B, (C) NACA 0010 profiles. Probe 1-14,Upper surface & probe 15-27, Lower surface of Corrugated A, Probe 1-15, Upper surface & probe 16-31, Lower surface of Corrugated B, Probe 1-17, Upper surface & probe 18-35 of the NACA 0010.
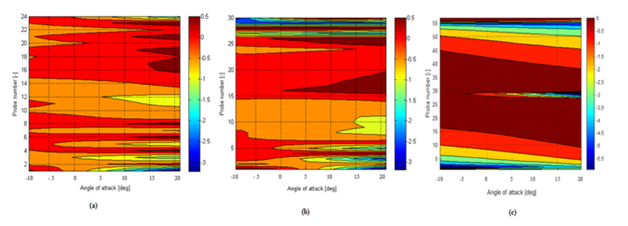
Figure 9 Pressure coefficient distribution of (A) Corrugated A (B) Corrugated B (C) Flat plate, Probe 1-14, upper surface & probe 15-27 lower surface of corrugated A, Probe 1-15, Upper surface & probe 16-31, Lower surface of corrugated B profile, at different angles of attack, -100 to 200.
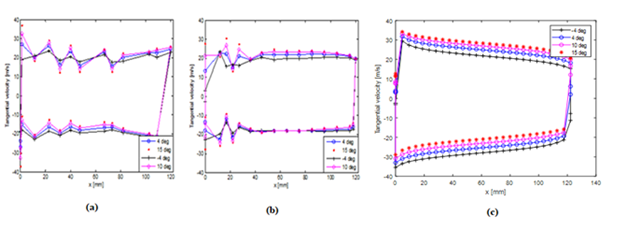
Figure 10 Tangential velocity distribution of (A) Corrugated A (B) Corrugated B (C) Flat plate, Probe 1-14, upper surface & probe 15-27 lower surface of corrugated A, Probe 1-15, Upper surface & probe 16-31, Lower surface of corrugated B profile, at -4, 4, 10 and 15 degrees angle of attack.
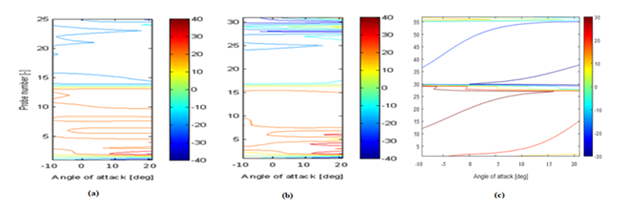
Figure 11 Velocity contours of (A) corrugated A (B) corrugated B (C) Flat plate profiles. Probe 1-14,Upper surface & probe 15-27, Lower surface of Corrugated A, Probe 1-15, Upper surface & probe 16-31, Lower surface of Corrugated B.
Effect of angle of attack on aerodynamic force coefficients
Figures 12A & 12B shows the coefficient of lift and drag for NACA 0010, corrugated A and corrugated B using panel method was evaluated between 00 and160 angles of attack respectively. The coefficient of lift for both the corrugated profiles was found to be higher than the NACA 0010. Despite few corrugations than corrugated A profile, corrugated B profile showed higher lift for all angles of attack than the other two profiles. Until 80 angles of attack, the trends for lift coefficient for all profiles are similar and found to vary almost linearly. Also, the drag coefficient for both corrugated A and corrugated B profiles were found to increase significantly than the NACA 0010 profile for angles of attack greater than 80. It must be noted that the increase in drag coefficient for both corrugated profiles above 120 angles of attack is due to the flow separation from the suction side of profiles surface at higher angles of attack. In addition the trends for drag coefficient for corrugated A and corrugated B profiles was similar up to 120 angles of attack. Beyond this, rapid increase in drag coefficient of corrugated A is observed due to flow separation which is not found in corrugated B due to presence of hump near the trailing edge which reattaches the flow. In the Figures 13a&b the experiment data for lift and drag coefficients for corrugated A and corrugated B profiles are compared with results from panel method and from (Ho & New, 2016) The glide ratio shown in Figures 14A &14B, Figures 15A &15B for corrugated A, corrugated B profiles were found to be high at 50 angle of attack. It is ~3% more than the corrugated B profile but found to deviate significantly with NACA 0010 by >10%. This trend continued till 50 angles of attack and for α >80 the glide ratio curve resembled the NACA 0010 profile. The glide ratio for NACA 0010 found higher than both the corrugated profiles above 80 angles of attack due to smooth surface of NACA profile which helps in flow re-attachment. Thus, glide ratio of corrugated airfoils found relatively better than the NACA 0010 profile at low positive angles of attack (<80) for given Reynolds number.
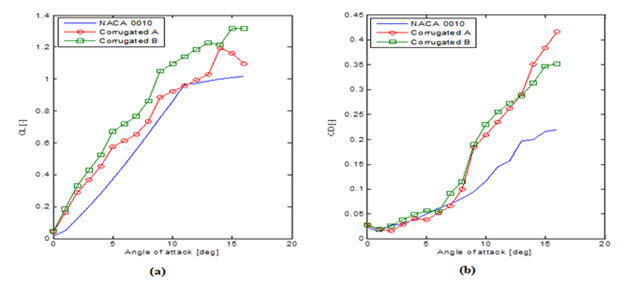
Figure 12 Results for NACA 0010, Corrugated A and Corrugated B profiles by panel method between 00 and 160 angle of attack for Re ~19000 (A) lift (B) drag.
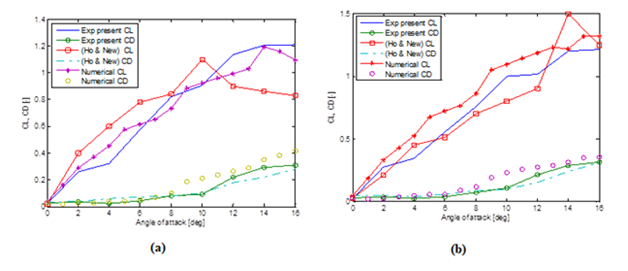
Figure 13 Comparison of lift and drag coefficient results by panel method (Re ~19000), Ho and New (2016) (Re- 14000) and present experimental work between 00 -160 angles of attack (A) Corrugated A (B) Corrugated B.
Corrugated A
The coefficient of lift for corrugated A at 20 angles of attack, was found similar by present panel method, experimental work and by Ho and New (2016). For α< 100 panel method results showed an increase in the lift coefficient but for α> 100, the results from Ho and New showed decrease in lift coefficient. It must be noted that for three profiles the drag coefficient was found nearly the same up to α< 80. However, panel method tends to predict higher drag coefficient by ~30 % compared to experimental work as well from Ho and New, (2016). At higher angles of attack, α>140 all the three methods showed good agreement in the results.
Corrugated B
For this profile, the prediction of coefficient of lift by Ho and New is lower compared to present experimental and numerical work up to α≤120. The present numerical results were in very close agreement with the present experimental work. Drag coefficient trends for corrugated B profile was nearly same as corrugated A profile. At angle of attack 14 degrees, Ho and New (2016) results showed, higher value for lift coefficient than the other two methods due to flow separation that was observed in his work and due to difference in the Reynolds number.
NACA 0010
The results for the glide ratio (CL/CD) of NACA 0010 profile obtained from panel method were compared with experimental work from (Murphy and Hu, 2010). The Reynolds number was kept nearly same during experiment (Re ~1.5 x 10⁵) to ensure integrity in validation. The 2-D panel method predicted 25% higher values for the coefficient of lift at higher angles of attack (α >100) and lower drag at lower angles of attack for NACA 0010. The glide ratio trends for experimental and numerical methods also show nearly the same results. The CL and CD trends for numerical and experimental results are very close (< 5%) up to 80 angles of attack. Beyond this value the deviation in results are found to deviate high for panel method to model the flow separation phenomenon. The corrugated B profile can be used to delay stall and the flow separation for higher angles of attack as the flow reattaches with the hump. The present study also revealed that basic panel methods are able to predict aerodynamic flow phenomenon fairly accurately for α<80. However, they are not suitable to analyze the unsteady effects and complex flow phenomenon like flow separation and vortex shedding from either leading or trailing edge of airfoil. The results also revealed that the coefficient of lift for corrugated B profile was found higher compared to remaining two profiles. The drag coefficient for both corrugated A and B profile were found to be almost same up to 120 angle of attack whereas the glide ratio was found highest for corrugated A profile.
Basic panel method and experimental study were conducted to analyze the incompressible flow characteristics of NACA 0010 and two types of bio-inspired corrugated profiles at chord Reynolds number 1.9x10⁴ and 1.5 x10⁵. Present work reveled that presence of corrugations on wing surface improves the flow characteristics for low to moderate Reynolds number. The reason for the increased lift coefficient at higher angles of attack for corrugated profiles is due to the large pressure difference between upper and lower surfaces which is not observed in conventional NACA profile. The panel method was able to predict the coefficient of lift and drag very well for lower angles of attack (α <80) and the results agreed well with computational work from Ho and New (2016). The presence of trailing edge hump for corrugated B profile increases the pressure coefficient at higher angles of attack which is similar to that observed near the trailing edge of NACA0010 profile.
None.
The author declares no conflicts of interest.

©2019 Dwivedi, et al. This is an open access article distributed under the terms of the, which permits unrestricted use, distribution, and build upon your work non-commercially.