Journal of
eISSN: 2377-4282


Mini Review Volume 4 Issue 1
1Department of Chemistry-Biochemistry and Physics, University of Quebec at Trois-Rivieres, Canada
2Department of Medicine, Rutgers Robert Wood Johnson Medical School, USA
Correspondence: Tajmir Riahi HA, Department of Chemistry-Biochemistry and Physics, University of Quebec at Trois-Rivieres, CP 500, Trois-Rivieres (Quebec), G9A 5H7, Canada, Tel 819-376-5011, Fax 819-376-5084
Received: July 04, 2016 | Published: August 24, 2016
Citation: Bourassa P, Thomas TJ, Tajmir Riahi HA (2016) A Short Review on the Delivery of Breast Anticancer Drug Tamoxifen and its Metabolites by Serum Proteins. J Nanomed Res 4(2): 00080. DOI: 10.15406/jnmr.2016.04.00080
The loading of tamoxifen (Tam), 4-hydroxytamoxifen (4-OH-Tam) and endoxifen (End) by carrier proteins, human serum albumin (HSA) and bovine serum albumin (BSA) was reviewed in aqueous solution at physiological pH. The binding study is directly related to the conjugation of tamoxifen and its metabolites with serum proteins. Tamoxifen and its metabolites bind serum proteins via hydrophobic, hydrophilic and H-bonding contacts. The loading efficacy (LE) was 45-52% for drug-protein conjugates. Modeling showed the presence of H-bonding, which stabilized drug-protein complexation with the free binding energy of -11.79 to -11.25 Kcal/mol for drug-HSA and -13.79 to -12.72 Kcal/mol for drug-BSA conjugates. Drug conjugation induced major perturbations on the conformation of serum proteins. Our studies indicate that serum proteins can transport tamoxifen and its metabolites to target tissues in the human body.
Keywords: Tamoxifen, Serum protein, Delivery, Loading efficacy, Spectroscopy, Modeling
HSA, Human Serum Albumin; BSA, Bovine Serum Albumin; Tam, Tamoxifen; 4-OH-Tam, 4-Hydroxy Tamoxifen; End, Endoxifen; FTIR, Fourier TransformInfrared
Due to the poor solubility of tamoxifen and its metabolites in aqueous solution, delivery of these anticancer drugs is a major challenge in breast cancer therapeutics. Serum albumins are emerging as versatile protein carriers for drug delivery and for improving the pharmacokinetic profile of peptide or protein-based drugs .1-3 Serum proteins contain multiple binding sites with different affinity and can transport drugs, fatty acids, steroid hormones and many other lipophilic compounds .4-12 In order to evaluate the potential application of serum proteins in the delivery of tamoxifen and its metabolites in vivo, it was of interest to compare the conjugation of these drugs with serum proteins in aqueous solution. A recent study showed that the anticancer drug, doxorubicin could be transported by serum proteins .13 Carrier proteins such as HSA and BSA show different hydrophobicity.14 and exhibit different affinity towards drug interactions.
Tamoxifen is an antitumor drug that has been in worldwide use for the treatment of estrogen receptor (ER)-positive breast cancer for over 30 years and has been used in both the metastatic and adjuvant settings. Tamoxifen suffers from low solubility and low selectivity, and thus the long-term usage of drug exposes patients at increased risk of having uterine malignancies .15,16 In the clinical development of tamoxifen, it became clear that tamoxifen underwent metabolism to 4-hydroxytamoxifen and endoxifen (Scheme 1), and these metabolites exerted tamoxifen’s drug action. Tamoxifen exerts its action as a breast cancer drug/chemoprevention agent by antagonizing the action of estradiol, by its binding to the ligand binding domain of ERα and provoking a conformational state of the protein that is incapable of binding to the estrogen receptor. In addition to its anti-estrogenic action, tamoxifen and its metabolites form adducts with DNA and hepatic toxicity is found in animal models .17 Loading of tamoxifen and its metabolites with serum proteins increases the solubility of the drug and improves its tissue-specific targeting as well as provides a tool for the sustained release of the drug .17-20
In this review we compared the conjugation of tamoxifen and its metabolites 4-hydroxytamoxifen and endoxifen with human and bovine serum albumins, using the results of multiple spectroscopic methods, and docking studies. This review provides useful information for the use of serum proteins in delivery of tamoxifen and its metabolites.
Molecular modeling
The structure of free HSA (PDB id:1AO6, chain A) obtained by X-ray crystallography was used as a template.21 The structure of BSA was predicted by automated homology modeling using SWISS-MODEL Workspace from the amino acid sequence NP-851335.22-24 The two proteins share 78.1% of sequence identity, which is sufficient to obtain reliable sequence alignment. The docking studies were performed with Argus Lab 4.0.1software (Mark A. Thompson, Planaria Software LLC, Seattle, WA, http://www.arguslab.com). Three dimensional structures of tamoxifen and its metabolites were obtained from PM3 semi-empirical calculations, using Chem3D Ultra 6.0.25,26
Fluorescence spectroscopy
Fluorimetric experiments were carried out on a Varian Cary Eclipse. Solutions containing drug 1 to 80 µM in Tris-HCl (pH =7.4) were prepared at room temperature and maintained at 24 °C. Solutions of HSA and BSA 20 µM in 10 mM Tris-HCl (pH = 7.4) were also prepared at 24 °C. The fluorescence spectra were recorded at excitation = 280 nm and emission from 287 to 500 nm. The intensity at 347 nm (tryptophan) was used to calculate the binding constant (K) as reported .25,26
FTIR spectroscopy
Infrared spectra were recorded on a FTIR spectrometer (Impact 420 model), equipped with deuterated triglycine sulphate (DTGS) detector and KBr beam splitter, using AgBr windows. Solution of drug was added drop wise to the protein solution with constant stirring to ensure the formation of homogeneous solution and to reach the target drug concentrations of 15, 30 and 60 µM with a final protein concentration of 60 µM. Spectra were collected after 2 h incubation of HSA or BSA with drug solution at room temperature, using hydrated films. Interferograms were accumulated over the spectral range 4000-600 cm−1 with a nominal resolution of 2 cm−1and 100 scans. The difference spectra [(protein solution+ drug solution)-(protein solution)] were generated using water combination mode around 2300 cm−1, as standard .27
Analysis of protein secondary structure
Analysis of the secondary structures of HSA and BSA and their drug complexes were carried out as reported.28,29 The curve-fitting analysis was performed using the GRAMS/AI Version 7.01 software of the Galactic Industries Corporation.
Location of drug binding sites on HSA and BSA by docking
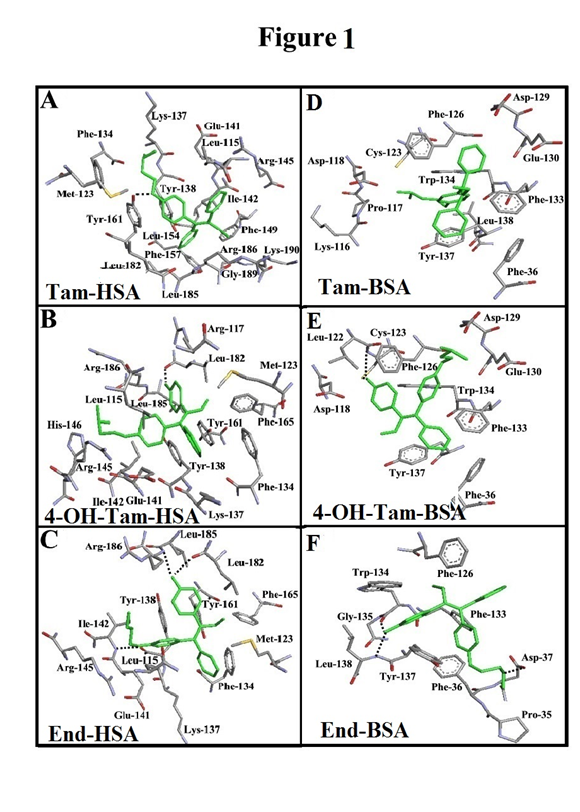
Docking results for tamoxifen and its metabolites conjugated with HSA and BSA are presented in Figure 1 and Table 1. In drug-HSA conjugates, tamoxifen is surrounded by Arg-145, Arg-186, Glu-141, Gly-189, Ile-142, Leu-115, Leu-154, Leu-182, Leu-185, Lys-137, Lys-190, Met-123, Phe-134, Phe-149, Phe-157, Tyr-138 and within the hydrogen bonding distance of *Tyr-161 (Figure 1A). 4-Hydroxytamoxifen is located next to Arg-117, Arg-145, Arg-186, Glu-141, His-146, Ile-142, Leu-115, Leu-182, Leu-185, Lys-137, Met-123, Phe-134, Phe-165, Tyr-138 and Tyr-161 and H-bonding to *Leu-186 (Figure 1B & Table 1). Endoxifen is located in the vicinity of Arg-145, Arg-186, Glu-141, Ile-142, Leu-115, Leu-182, Leu-185, Lys-137, Met-123, Phe-134, Phe-165, Tyr-138 and Tyr-161 with H-bonding distance of *Leu-182, *Leu-185 and *Ile-142 residues (Figure 1C & Table 1) The free binding energy (ΔG) shows the stability of the complexes formed: 4-hydroxytamoxifen> endoxifen>tamoxifen (Table 1). In the drug-BSA adducts, tamoxifen is surrounded by Asp-118, Asp-129, Cys-123, Glu-130, Leu-138, Lys-116, Phe-36, Phe-126, Phe-133, Pro-117, Trp-134 and Tyr-137 (Figure1D & Table 1). 4-Hydroxytamoxifen is located next to Asp-118, Asp-129, Cys-123, Glu-130, Leu-122, Phe-36, Phe-126, Phe-133, Trp-134 and Tyr-137 with hydrogen bonding network with residue *Cys-122 and *Leu-122 (Figure 1E) Finally, endoxifen is in the vicinity of Asp-37, Gly-135, Leu-138, Phe-36, Phe-126, Phe-133, Pro-35, Trp-134, Tyr-137 with h-bonding distance of the *Asp-37, *Leu-138 and *Trp-134 residues (Figure 1F & Table 1).

Figure 1 Best docked conformations of Tam–HSA (A), 4-Hydroxytam-HSA (B), End-HSA (C), Tam–BSA (D), 4-Hydroxytam-BSA (E) and End-BSA (F).
Binding parameters of drug- protein conjugation by fluorescence spectroscopy
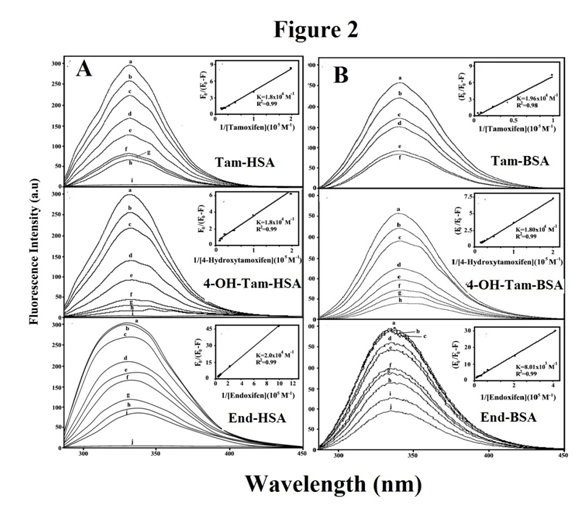
Tryptophan emission dominates both HSA and BSA fluorescence spectra in the UV region.30-32 The decrease of fluorescence intensity of HSA and BSA has been monitored at 347 nm for tamoxifen and its metabolites upon protein conjugation (Figure 2). Figure 2 shows the effect of tamoxifen and its metabolites on HSA, and BSA fluorescence intensity. The fluorescence intensity of HSA and BSA markedly decreased as the drug concentration increased, due to the complex formation between drug and HSA and BSA (Figure 2). The protein undergoes conformational changes in the presence of tamoxifen and its metabolites, such as observed with the tryptophan residues (fluorophore) inside become more exposed to the surface after drug-protein conjugates. Assuming that the observed changes in fluorescence come from the interaction between drug and protein, the quenching constant can be taken as the binding constant of the complex formation. As it is shown in Table 2, drugs form strong conjugates with HSA, BSA. It seems that protein hydrophobicity did not play a major role in drug complex formation. HSA is less hydrophobic than BSA.14 However, HSA with more hydrophilic character forms more stable complexes than BSA.25,26 This is not consistent with docking results that showed BSA forms more stable drug conjugates (Tables 1 & 2).

Figure 2 Fluorescence emission spectra of protein (25 µM) in Tris-HCl (pH 7.4) in the presence of tamoxifen, 4-hydroxytamoxifen and endoxifen, with A) tamoxifen– HSA: (a) free HSA (25 μM), (b-h) with tamoxifen at 5, 10, 20, 30, 50, 60 and 80 µM; 4-hydroxytamoxifen–HSA: (a) free HSA (25 µM), (b-h) with 4-hydroxytamoxifen at 5, 10, 20, 30, 50, 60 and 80 µM and endoxifen-HSA: (a): free HSA (25 µM); (b-i) with endoxifen at 1, 5, 20, 30, 40, 60, 80 and 100 µM. For B) tamoxifen-BSA: (a) free BSA (25 μM), (b-f) with tamoxifen at 10, 20, 60, 80 and 100 mM ; 4-hydroxytamoxifen–BSA : (a) free BSA (25 mM), (b-h) with 4-hydroxytamoxifen at 5, 10, 20, 40, 60, 80 and 100 mM and endoxifen-BSA: (a): free BSA (25 mM); (b-j) with endoxifen at 2, 5, 10, 20, 30, 40, 60, 80 and 100 mM. The plot of 1/(A-A0) as a function of 1/drug concentration. The binding constant K being the ratio of the intercept for drug-HSA (A) and drug-BSA (B).
The plot of F0/F versus Q is linear for drug-HSA and drug-BSA conjugates indicating that the quenching is mainly static in these drug-protein complexes.31 The Kq was estimated according to the Stern-Volmer equation
where F0 and F are the fluorescence intensities in the absence and presence of quencher, [Q] is the quencher concentration and Kq is the Stern-Volmer quenching constant, which that can be estimated from KD=kqt0; where kQ is the bimolecular quenching rate constant and t0 is the lifetime of the fluorophore in the absence of quencher, 5.9 ns for BSA and 5.6 ns for HAS.30 Since Kq values are much greater than the maximum collisional quenching constant (Table 2), thus the static quenching is dominant in these drug-protein conjugates.33
|
Complex |
Residues Involved in the Interaction |
ΔG binding (kcal/mol) |
|
Tamoxifen – HSA |
Arg-145, Arg-186, Glu-141, Gly-189, Ile-142, Leu-115, Leu-154, Leu-182, Leu-185, Lys-137, Lys-190, Met-123, Phe-134, Phe-149, Phe-157, Tyr-138, Tyr-161* |
-11.25 |
|
4-Hydroxytamoxifen - HSA |
Arg-117, Arg-145, Arg-186, Glu-141, His-146, Ile-142, Leu-115, Leu-182*, Leu-185, Lys-137, Met-123, Phe-134, Phe-165, Tyr-138, Tyr-161 |
-11.79 |
|
Endoxifen - HSA |
Arg-145, Arg-186, Glu-141, Ile-142*, Leu-115, Leu-182*, Leu-185*, Lys-137, Met-123, Phe-134, Phe-165, Tyr-138, Tyr-161 |
-11.28 |
|
Tamoxifen - BSA |
Asp-118, Asp-129, Cys-123, Glu-130, Leu-138, Lys-116, Phe-36, Phe-126, Phe-133, Pro-117, Trp-134, Tyr-137 |
-13.47 |
|
4-Hydroxytamoxifen - BSA |
Asp-118, Asp-129, Cys-123*, Glu-130, Leu-122*, Phe-36, Phe-126, Phe-133, Trp-134, Tyr-137 |
-13.79 |
|
Endoxifen - BSA |
Asp-37*, Gly-135, Leu-138*, Phe-36, Phe-126, Phe-133, Pro-35, Trp-134*, Tyr-137 |
-12.72 |
Table 1 Amino acid residues involved in drug-HSA and drug-BSA conjugates with the free binding energy for the best selected docking positions.
*Hydrogen bonding with this amino acid residue.
The loading efficacy for drug protein conjugates was determined as reported.33
The loading efficacy was estimated 45-52% for these drug-protein conjugates (Table 2).
Binding analysis of drug-protein conjugates by FTIR spectroscopy
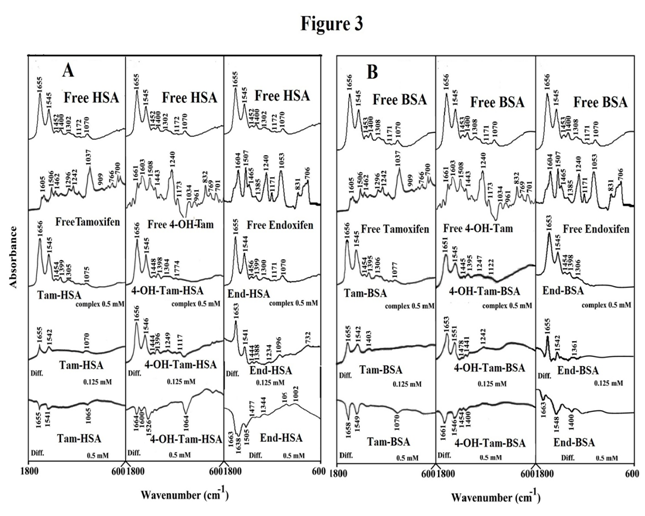
The conjugation of tamoxifen and its metabolites with BSA and HSA was characterized by infrared spectroscopy and its derivative methods. Drug-protein interactions alter protein conformation and induce spectral change for protein amide I band at 1659-1657 cm-1 (mainly C=O stretch) and amide II band at 1546-1545 cm−1(C-N stretching coupled with N-H bending modes) .34 The intensity variations of protein amide I and amide II bands obtained by difference spectra [(protein solution + drug solution) - (protein solution)] are shown in Figure 3.
At low drug concentration (15 µM), while protein amide I and amide II showed no major shifting, while a major intensity changes were observed for the protein amide I and amide II, in the difference spectra of the drug-HSA and drug-BSA conjugates (Figure 3A & 3B) diffs 0.125 mM. The positive features due to the increase in intensity of amide I and amide II bands are located in the difference spectra at 1655 and 1546 cm−1(Tam-HSA), at 1656 and 1546 cm−1(4-hydroxy-Tam-HSA) and at 1653 and 1541 cm−1(End-HSA) (Figure 3A) diffs 0.125 mM. Similarly, for drug-BSA adducts, positive feature were observed at 1655 and 1542 cm−1(Tam-BSA), at 1653 and 1551 cm−1 (4-hydroxy-Tam-BSA) at 1655 and 1542 cm−1(End-BSA) (Figure 3B) diffs 0.125 mM. However, as drug concentration increased (0.5 mM), decreases in intensity of protein amide I and amide II were observed with negative features at 1655 and 1541 cm−1(Tam-HSA), at 1664 and 1526 cm−1(4-hydroxy-Tam-HSA) and at 1663 and 1505 cm−1(End-HSA) (Figure 3A) diffs 0.125 mM. Similarly, for drug-BSA adducts, positive features were observed at 1653 and 1549 cm−1(Tam-BSA), at 1661 and 1546 cm−1(4-hydroxy-Tam-BSA) at 1663 and 1548 cm−1(End-BSA) (Figure 3B) diffs 0.125 mM. The spectral variations observed are due changes in the intensity of the amide I and amide II band, upon drug binding with protein C-O, C-N and NH groups and also related to reduction of protein α-helix contents.26,27

Figure 3 FTIR spectra in the region of 1800-600 cm-1 of hydrated films (pH 7.4) for free HSA (A) and BSA (B) (0.5 mM) and their drug complexes with difference spectra (diff.) (bottom two curves) obtained at different drug concentrations (indicated on the figure).
The secondary structures of the free HSA and BSA and their drug conjugates are shown in Figure 4. The free HSA has 57 % α-helix (1656 cm−1), β-sheet 14 % (1628 and 1617 cm−1), turn structure 13 % (1679 cm−1), β-antiparallel 4 % (1689 cm−1) and random coil 12 % (1637 cm−1) (Figure 4A). The free BSA contains α-helix 63% (1656 cm−1), β-sheet 16% (1612 and 1626 cm−1), turn 12% (1678 cm−1),β-antiparallel 3% (1691 cm−1) and random coil 6% (1638 cm−1) (Figure 4B). Upon drug interaction, a decrease of α-helix from 57% (free HSA) to 55-40% with an increase in random and beta-sheet structures from 14% (free HSA) to 20-17% (drug-HSA) was observed (Figure 4A). Similarly, a decrease of α-helix from 63% (free BSA) to 47-39% and an increase of turn and random from 6% (free BSA) to 20-10% (drug-BSA) was observed (Figure 4B). The results showed that the conformational changes occurring are more pronounced in the case of drug-BSA and drug-HSA leading to a partial protein destabilization.25,26 Similar protein conformational changes were observed for HSA and BSA in several drug complexes.35-41
This review provides a comparison on the binding affinity of serum proteins with tamoxifen and its metabolites. Drugs bind BSA and HSA via hydrophilic and H-bonding contacts with HSA forming more stable conjugates than BSA. 4-Hydroxytamoxifen forms stronger protein conjugates than tamoxifen and endoxifen. Drug interaction induced more perturbations of BSA than HSA conformations. The loading efficacy of tamoxifen and its metabolites with serum proteins was 45-52%. Future research should be focused on the development of new and effective nanocarriers based on biodegradable and biocompatible nanomaterials for delivery of tamoxifen and its metabolites in vivo in order to use the full potential of these important breast anticancer drugs.42-46
|
Complexes |
K |
K |
K |
Kq |
n |
% LE |
|
Tamoxifen - HSA |
1.8 ±0.2 |
1.5±0.4 |
1.2±0.2 |
3.2±0.2 |
1.4 |
45 |
|
4-Hydroxytamoxifen - HSA |
1.8 ±0.4 |
1.6±0.5 |
1.6±0.3 |
3.2±0.4 |
1.8 |
50 |
|
Endoxifen - HSA |
2.0 ±0.5 |
2.5±0.7 |
1.7±0.3 |
3.5±0.2 |
1.5 |
46 |
|
Tamoxifen - BSA |
1.9 ±0.2 |
1.6 ±0.2 |
1.3 ±0.2 |
3.3±0.5 |
1.1 |
50 |
|
4-Hydroxytamoxifen - BSA |
1.8 ±0.2 |
1.5 ±0.4 |
1.5 ±0.4 |
3.1 ±0.2 |
1.5 |
52 |
|
Endoxifen - BSA |
0.80±0.08 |
1.1 ±0.5 |
1.2 ±0.5 |
1.3±0.2 |
1.1 |
48 |
Table 2 Clinical and biochemical variables of individuals with overweight-obesity.
SD: Standard Deviation; BMI: Body Mass Index; WC: Waist Circumference; AC: Abdominal Circumference; HC: Hip Circumference; RER: Respiratory Exchange Ratio; HR: Hear Rate.
The financial support of the Natural Sciences and Engineering Research Council of Canada (NSERC) is highly appreciated.
None.

©2016 Bourassa, et al. This is an open access article distributed under the terms of the, which permits unrestricted use, distribution, and build upon your work non-commercially.