Journal of
eISSN: 2377-4282


The prospective cancer therapy applications of inorganic nanoparticles (NPs) have been encouraged by surface modifications with polyethylene glycol (PEG). When grafted at high densities, PEG reduces NP surface interaction with its environment, hence minimizing its detection by the immune system. The drawback of high density PEG surfaces is its reduced uptake by cancer cells. This is disadvantageous for applications that favor intracellular localization of such NPs. On the other hand, reduced PEG density leads to nonspecific adsorption of proteins on NP surface. Adsorbed proteins may either facilitate cancer cell entry or mark inorganic NPs for clearance from the body. This trade-off between intracellular localization and in vivo residency time was observed in this study. Two grafting densities of 1 PEG/nm2 and 1 PEG/2 nm2 for two PEG chain lengths with molecular weights of 2kDa and 5kDa were used to coat gold NPs (GNPs). Spherical GNPs with a diameter of 50 nm were used as a model system to investigate the effect of PEG characteristics on NP nonspecific protein adsorption and uptake by cancer cells in vitro in HeLa, MDA-MB-231 and MCF-7 cells. Higher grafting densities resulted into less protein adsorption and lower NP uptake by all cell lines. Longer PEG chain lengths also resulted into less cancer cell entry in all cell lines. Quantitative results were confirmed qualitatively via hyperspectral imaging of NPs in cancer cells. Hence, lower PEG grafting densities and shorter chain lengths lead to higher cellular uptake at the cost of greater nonspecific protein adsorption. Higher density grafting of shorter PEG chain lengths was found most favorable. This combination resulted into reduced nonspecific protein adsorption and higher uptake when compared to its lower density and longer chain length counterparts, respectively. To maximize cancer therapy improvement via inorganic NP platforms, using such PEG grafting characteristics may be beneficial. Keywords:Nanotechnology, Nanoparticles, Gold, Polyethylene glycol, Cellular uptake, Hyperspectral imaging
NP, Nanoparticle; GNP, Gold NP; PEG, Polyethylene Glycol; PEG-GNP, PEG-coated GNP; EPR, Enhanced Permeability and Retention; RME, Receptor Mediated Endocytosis; HP2K-GNP, 1 PEG/nm2 2kDa PEG; LP2K-GNP, 1 PEG/2nm2 2kDa PEG; HP5K-GNP, 1 PEG/nm2 5kDa PEG; LP5K-GNP: 1 PEG/2nm2 5kDa PEG; UV-Vis: Ultraviolet-Visible Spectroscopy; DLS: Dynamic Light Scattering; PBS: Phosphate-Buffered Saline; HSI: Hyperspectral imaging; SAM: Spectral Angle Mapping; ICP-AES: Inductively Coupled Plasma Atomic Emission Spectroscopy
The biomedical research of inorganic nanoparticles (NPs) has developed NP-based cancer therapeutics and imaging.1-7 Through such applications, disease may be managed safely and more efficiently.2,4,8-11 Though not yet clinical, NP platforms are being developed to target therapeutics to tumors while minimizing interaction with normal tissue.12-14 To achieve an efficient NP system, prolonged in vivo residency time, preferential localization in tumor environments and cancer cell internalization for applications that favor intracellular localization is required.15,16 The first requirement of longer blood circulation time is most important because NPs should not be cleared from the body before its interaction with tumor tissue. To achieve favorable blood circulation times and cancer cell targeting, various NP sizes, shapes and surfaces have been studied.17-20 For example, gold NPs (GNPs) whose surface was modified with folic acid was found to target cancer cells versus healthy cells as it was found to deliver doxorubicin more effectively to HeLa cells in comparison to MDCK cells.21 Similarly, magnetic iron oxide NPs that targeted urokinase plasminogen activator receptors were found effective for drug delivery and imaging of cells that over expressed such receptors.22,23 However, prior to cancer cell targeting, long blood circulation times must be achieved so that NPs may enter tumor tissue to begin with. This is achieved by surface modification of NPs with polyethylene glycol (PEG) or PEGylation, as found in numerous in vivo studies.11,15,16,18,19,24-28
PEG is widely used in providing NPs with stealth properties, hence prolonging blood circulation times.26,27 For example, Lipka et al showed that a longer PEG chain length of 10kDa improved NP blood circulation time as over 15% of applied volume was found after 24 hours in the bloodstream of mice subjects.27 On the other hand, its unmodified counterpart was cleared within an hour of intravenous application. Likewise, Cho et al found that PEG-coated NPs accumulate in immune system organs responsible for NP body clearance for more than six months.18 The molecule accomplishes this by surrounding NPs with a hydrophilic layer, protecting the NP surface from the environment.15,18,25,27,29,30 High density grafting of polymers allow such molecules to assume what is referred to as a brush conformation as opposed to a mushroom configuration at low density (31,32). In addition to grafting density, conformations are determined by polymer chain length (n), monomer length (α), and solvent type (ν) as shown in equation (1).31-33
R = αnν (1)
Here, R is the Flory radius, which defines the minimum distance required between grafted molecules to achieve a mushroom conformation. Molecules spaced less than R have lower conformational freedom such that a brush conformation is achieved. For example, PEG, whose monomer length is 0.35 nm, with a molecular weight of 2kDa (polymer chain length of 45.45) in water (ν=3/5), R is 3.5 nm, while for a molecular weight of 5kDa, it is 6.0 nm. For a 50 nm spherical NP of surface area 7854 nm2, if 2kDa molecules were to take on a brush configuration grafted a maximum of 3.5 nm apart (1 PEG molecule per (3.5 nm)2 or 12.25 nm2), at least 641 molecules are required per NP. Likewise, 5kDa molecules require 1 PEG molecule per 36 nm2 or 218 molecules per NP. However, it was found that a minimum density of 1 PEG/nm2 is required to achieve a significant reduction in nonspecific protein adsorption.30,34 One of such proteins that the NP surface is protected from is opsonin.26,30,34,35 Opsonin marks NPs for macrophage detection followed by their clearance from the body. With PEGylation, NPs may evade the immune system, achieving longer blood circulation times. This in turn allows higher chances of NP entry and retention in tumor tissue, since such an environment has leaky capillaries and irregular lymphatic structures leading to the enhanced permeability and retention (EPR) effect.16 ,36The EPR effect is taken advantage of by PEGylated liposomes used in chemotherapy, since it allows preferential accumulation of NPs in the tumor. PEGylated liposomes sized 100-200 nm are currently used as delivery vehicles for FDA-approved chemotherapeutic drugs like doxorubicin and oncospar.3,37 It was the effectiveness of PEG in this respect that motivated the study of other biocompatible NPs, such as GNPs.
The use of inorganic NPs is of interest as they are easily synthesized and designed, especially in the case of GNPs whose physical and chemical properties are easily modifiable.24,38,39 For example, the citrate reduction method of synthesis more popularly known as the Turkevich method only requires varying concentrations of sodium citrate to vary GNP size. Surface modification may also be done with ease via electrostatic attraction, chemisorption, and displacement of surface bound ligands.24 However, unlike liposomes and as with other inorganic NPs, GNPs need surface ligands for cellular internalization, since inorganic NPs enter cells by receptor mediated endocytosis (RME).1,2 Citrate-coated GNPs synthesized from the Turkevich method accomplish this by nonspecific adsorption of proteins in serum, which is minimized by PEG. Because of this, PEGylated GNPs are found to have decreased cellular uptake in vitro.40-43 Nativo et al found that PEGylated GNPs had significantly less uptake by HeLa cells. Similarly, Arnida et al found the same trend using PC-3 cells.35 This suggests that when doing in vivo studies, PEGylated GNPs localize external to cancer cells in interstitial tissue. Chemotherapeutic toxicity relies on the entry of drugs into cancer cells.42,44 NP cellular uptake was also found to correlate with sensitization of cancer cells to radiation therapy.45-48 It may be considered favorable to minimize the volume of unused inorganic NPs in the body because such particles accumulate in immune system organs, causing side effects that include kidney and liver failure.17,18,25,27 A balance between cancer cell uptake and NP stealth from the immune system by avoiding nonspecific protein adsorption is required.
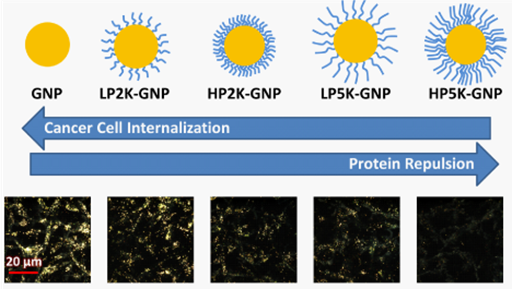
The trade-off between cellular internalization and nonspecific protein adsorption was observed in this study by varying PEG grafting characteristics on NPs, where GNPs were used as a model system (Figure 1). Grafting densities of 1 PEG/nm2 and 1 PEG/2 nm2 for two PEG chain lengths of molecular weights 2kDa and 5kDa were used to coat GNPs. In all cases, sufficient PEG molecules were grafted to achieve a brush conformation of molecules. Spherical GNPs with a diameter of 50 nm were used to investigate the effect of PEG grafting characteristics on nonspecific protein adsorption and cellular uptake in vitro in HeLa, MDA-MB-231 and MCF-7 cells. Quantitative results were also confirmed qualitatively by Hyperspectral Imaging (HSI) of NPs in cancer cells using Cyto Viva. The results of this study may be used as a guideline in designing inorganic NPs with prolonged blood circulation time and sufficient cancer cell uptake for potential clinical use.

Figure 1 Schematic on the effect of PEG characteristics on cancer cell uptake of NPs. Two grafting densities and two chain lengths were studied. Lower grafting densities and shorter PEG chain lengths resulted into higher nonspecific protein adsorption. This in turn led to greater NP internalization by cancer cells. Quantified cellular uptake was also evaluated qualitatively by dark field microscopy, where there was a general agreement between quantified data and observed fluorescence.
GNP synthesis: GNPs were synthesized via the citrate reduction method. 600 µL of 1% Chloroauric acid (Sigma-Aldrich, Oakville, ON) was added to 60 mL of distilled water and was brought to a boil while continuously stirring. At boiling point, 210 µL of 1% citric acid (Sigma-Aldrich, Oakville, ON) was added to synthesize medium-sized GNPs. The color of the solution changed from clear to black, then to maroon. The solution was left to boil for another five minutes while stirring. It was then allowed to cool to room temperature while stirring followed by refrigeration.
Characterization and nonspecific protein adsorption: GNPs were characterized with ultraviolet-visible (UV-vis) spectroscopy (Lambda 40; PerkinElmer, Waltham, MA) and dynamic light scattering (DLS) using the 90 Plus Particle Size Analyzer (Brookhaven Instruments Corp., New York, NY; Figure 2 and Table 1). To assess serum protein adsorption, peak absorption and diameter characterization was also done for all NPs following their incubation with Fetal Bovine Serum (FBS; Sigma-Aldrich, Oakville, ON). This was done under the same concentrations as the cellular uptake study described in the cellular uptake study. Dark field imaging of synthesized GNPs was also done with CytoViva HSI (Cytoviva Inc., Auburn, AL). To establish reference spectra for use in matching GNPs internalized by cells, spectral information on synthesized GNPs were collected (Figure 2).
Pre-Incubation |
Post-Incubation |
|||
NP Type |
UV-Vis Peak |
Hydrodynamic |
UV-Vis Peak |
Hydrodynamic |
GNP |
535 |
53.6 + 0.5 nm |
539 |
66.9. + 0.4 nm |
HP2K-GNP |
536 |
55.2 + 0.2 nm |
538 |
58.3 + 0.5 nm |
LP2K-GNP |
535 |
54.7 + 0.3 nm |
542 |
61.7 + 0.6 nm |
HP5K-GNP |
537 |
64.1 + 0.3 nm |
540 |
65.6+ 0.2 nm |
LP5K-GNP |
536 |
62.0 + 0.3 nm |
540 |
63.6+ 0.5 nm |
Table 1 Characterization of NPs before and after incubation with serum via UV-Vis and DLS. After incubation, a greater increase in hydrodynamic diameter was observed with shorter PEG chain lengths and lower grafting densities
NP: Nanoparticle; GNP: Gold NP; HP2K-GNP: 1 PEG/nm2 2kDa PEG; LP2K-GNP: 1 PEG/2nm2 2kDa PEG; HP5K-GNP: 1 PEG/nm2 5kDa PEG; LP5K-GNP: 1 PEG/2nm2 5kDa PEG; UV-Vis: Ultraviolet-Visible Spectroscopy; DLS: Dynamic Light Scattering
PEGylation of GNPs: A 1% PEG solution was prepared with thiol-terminated PEG methyl ether (Polymer Source Inc., Dorval, QC) for each polymer molecular weight of 2kDa and 5kDa. The solution was added to GNPs to achieve a surface grafting density of 1 PEG/nm2 or 1 PEG/2 nm2. From UV-Vis results, the peak absorption wavelength of 535 nm corresponds to a diameter of 50 nm. Hence, 7854 PEG molecules were required per GNP to achieve a density of 1 PEG/nm2, synthesizing HP2K-GNP with 2kDa PEG and HP5K-GNP with 5kDa PEG. On the other hand, 3927 PEG molecules were required to achieve a density of 1 PEG/2 nm2, synthesizing LP2K-GNP with 2kDa PEG and LP5K-GNP with 5kDa PEG. To confirm the PEGylation of GNPs, DLS and UV-Vis measurements were done since an increase in diameter is characteristic of GNP PEGylation (Table 1).
Cellular uptake study: HeLa, MDA-MB-231 and MCF-7 cells were cultured in Dulbecco’s Modified Eagle’s Medium (Life Technologies Inc., Burlington, ON) with 10% FBS. Cells were grown to confluency so that per NP type per cell line, there were two 10-cm culture dishes. For optical imaging purposes, MDA-MB-231 cells were seeded on glass cover slips in 3.5-cm culture dishes and grown to confluency. All NP types were added to cell cultures to achieve a concentration of 2.0 × 10¹³ GNPs/L for a 16-hour incubation period at 37°C and 5% CO2. Phosphate-Buffered Saline (PBS; Sigma-Aldrich, Oakville, ON) was used to wash all cell cultures three times. The 10-cm culture dishes without cover slips were trypsinized for quantification described in the NP uptake quantification. The 3.5-cm culture dishes with cover slips were fixed with 4% paraformaldehyde (Sigma-Aldrich, Oakville, ON) in PBS for 20 minutes at room temperature, and then washed with PBS. Coverslips were mounted onto glass slides for CytoViva microscopy as described in the microscopy.
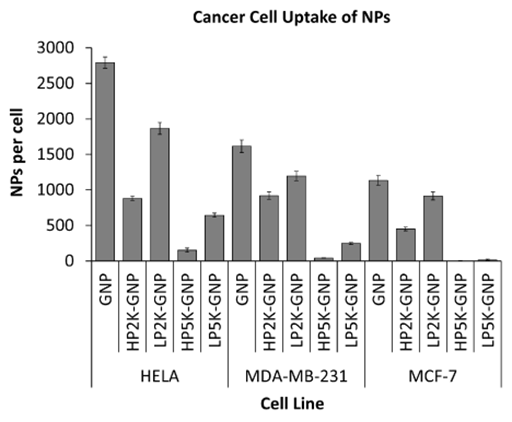
NP uptake quantification: Prior to processing for inductively coupled plasma atomic emission spectroscopy (ICP-AES) with the Optima 7300 DV (PerkinElmer, Waltham, MA), trypsinized cells were counted. To prepare samples for ICP-AES, 70% nitric acid (Sigma-Aldrich, Oakville, ON) was added at the same volume as the samples. Samples were boiled at 200°C in an oil bath for cell digestion and GNP atomization. ICP-AES of the samples was then performed yielding gold atom counts that were converted to internalized NPs per cell (Figures 3 and 4).

Figure 3 The dependence of NP uptake on cell line. Highest uptake was observed in HeLa cells for all NP types followed by uptake by MDA-MB-231 cells, then MCF-7 cells.

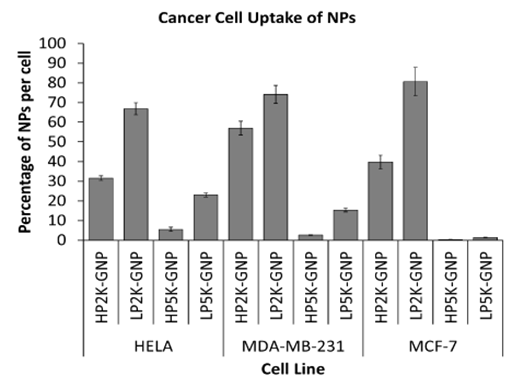
Figure 4 The dependence of cancer cell uptake on PEG characteristics. Cellular internalization of PEG-GNPs were normalized to that of as-made GNPs. Higher uptake was observed with shorter PEG chain lengths and lower densities for all cell lines..

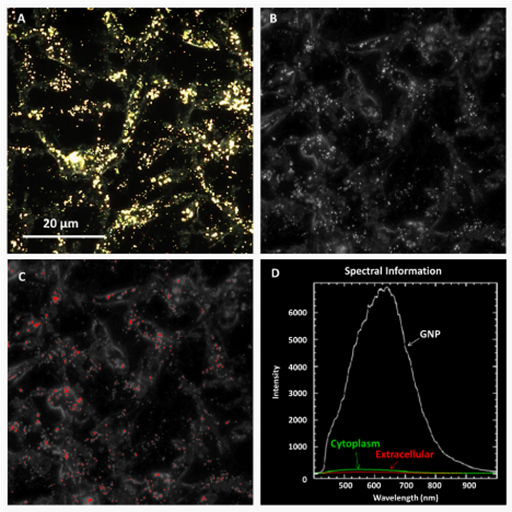
Figure 5 Spectra matching in HSI image at 60X.
A) MDA-MB-231 cells incubated with GNPs were imaged.
B) HSI was done.
C)Using obtained spectra from synthesized GNPs, pixels whose spectra matched reference spectra were identified and marked in red.
D) Intensity differences between the GNP, cytoplasm and extracellular regions display that observed bright particles were indeed GNPs.
Characterization of synthesized NPs: Spherical GNPs with a diameter of 50 nm were made as characterized by its peak absorption wavelength of 535 nm with UV-Vis (Table 1 and Figure 2). The PEGylation of GNPs resulted into shifts in peak absorption, which is characteristic of molecule adsorption on NP surfaces. A maximum change in peak absorption wavelength of 2 nm was observed with PEGylation, which did not signify the aggregation of NPs, confirming its stability. DLS measurements also confirmed NP PEGylation and stability. A hydrodynamic diameter increase of 1.6 ± 0.5 nm was observed with HP2K PEGylation while an increase of 1.1 ± 0.6 nm was observed with LP2K PEGylation. It appears that a lower grafting density provides more free space for PEG molecules to take less erect conformations versus its high density counterpart. For the longer PEG chain length of 5kDa, a hydrodynamic diameter increase of 10.5 ± 0.6 and 8.4 ± 0.6 nm was observed with HP5K and LP5K PEGylation, respectively. In comparison to the shorter PEG chain length of 2kDa, larger hydrodynamic diameter changes were observed for 5kDa as expected.
Nonspecific protein adsorption: The incubation of NPs with serum resulted into larger hydrodynamic diameters due to nonspecific protein adsorption (Table 1). The largest increase of 13.3 ± 0.6 nm was observed for as-made GNPs due to the absence of PEG molecules that repel nonspecific protein adsorption. Following this, diameters increased by 3.1 ± 0.5 and 7.0 ± 0.7 for HP2K-GNPs and LP2K-GNPs respectively. Due to lower PEG grafting density and the availability of free space on NP surface, there was a higher chance of serum protein binding for LP2K-GNPs in comparison to HP2K-GNPs. On the other hand, HP5K-GNPs and LP5K-GNPs increased in diameter by 0.9 ± 0.4 and 1.6 ± 0.6 nm respectively. The longer PEG chain length was able to more effectively hinder protein interaction with NP surface.
Quantifying internalization of NPs by cancer cells: Highest NP uptake was observed in HeLa cells across all NP types (Figure 3). Following this was the NP uptake by MDA-MB-231 cells, then MCF-7 cells. Despite differences in the amount o
f NP uptake, the same trend was observed for all cell lines in terms of PEG characteristics. The cellular uptakes of PEG-GNPs in comparison to their as-made counterparts are shown in (Figure 4). A lower grafting density was found to have higher uptake for both PEG chain lengths. In addition, shorter PEG chain lengths resulted into higher uptake for both grafting densities. The reason for such observations is as explained above in the nonspecific protein adsorption results. Nonspecific protein adsorption was found to increase with shorter PEG chain lengths and lower grafting densities. Since protein adsorption mediates the entry of inorganic NPs by RME, the chances of PEG-GNPs entering cells correlate with the amount of protein on its surface. Hence, cancer cell uptake was also found to increase with shorter PEG chain lengths and lower grafting densities.
Imaging of NPs in cancer cells: Spectral information of as-made GNPs with varying intensities was collected as seen in (Figure 2). Varying intensities may have been caused by differences in distance so that NPs closer to the objective in the viewing plane had higher intensities than those farther from it. Using collected spectra from as-made GNP solutions as shown in (Figure 2), matches in MDA-MB-231 cells were imaged with SAM and it was confirmed that fluorescent particles were indeed GNPs (Figure 5). Observed fluorescence in acquired images of NPs in cells was found to generally agree with gold quantifications (Figure 6). An increase in the number of fluorescent particles was found to increase with uptake.
This study demonstrated the trade-off between PEG grafting density for minimized nonspecific protein adsorption and cancer cell uptake of inorganic NPs. Lower PEG grafting densities and shorter chain lengths have higher cancer cell uptake due to a greater probability of nonspecific protein adsorption. However, this also means that immune system markers such as the opsonin protein also have a higher chance of binding with such NPs, promoting clearance from the body. Based on results, a PEG chain length of 2kDa grafted at 1 PEG/nm2 repels protein adsorption sufficiently without reducing uptake as much as 5kDa PEG does. In addition, minimized nonspecific protein adsorption by 5kDa may be found problematic when dealing with body clearance of NPs. Results from this study show that the nonspecific protein adsorption properties of such conjugates require a time point study. Such will establish the time it takes for longer PEG chain lengths to adsorb the same amount of protein as shorter PEG chain lengths. This may then be associated with in vivo residency time of PEGylated NPs. In the event that such uptake is inadequate in enhancing cancer treatment outcomes, the use of cancer cell targeting ligands may be used. The integration of targeting ligands will provide NPs with both longer residency times and enhanced internalization by cells. Such properties will promote the clinical use of prospective inorganic NP platforms.
None.
None.

© . This is an open access article distributed under the terms of the, which permits unrestricted use, distribution, and build upon your work non-commercially.