Research Article Volume 8 Issue 2
The effects of vitamin D on glucose-insulin dynamics: mathematical model and simulation
Saloni Rathee,1 Nilam ,2
Regret for the inconvenience: we are taking measures to prevent fraudulent form submissions by extractors and page crawlers. Please type the correct Captcha word to see email ID.

Murray E Alexander3
1Department of Mathematics, PDM University, India
2Department of Applied Mathematics, Delhi Technological University, India
3Department of Physics, University of Winnipeg, Canada
Correspondence: Nilam, Department of Applied Mathematics, Delhi Technological University, Delhi, 110042, India
Received: September 15, 2021 | Published: December 3, 2021
Citation: Rathee S, Nilam, Alexander ME. The effects of vitamin D on glucose-insulin dynamics: mathematical model and simulation. J Diabetes Metab Disord Control. 2021;8(2):105-114. DOI: 10.15406/jdmdc.2021.08.00229
Download PDF
Abstract
Background: Maintenance of glucose level for diabetic people is very important and challenging. Many factors seem to affect the level of glucose in our body, out of which vitamin D is found to be one of the most important factors. It inspires us to develop a model that is capable of predicting the effect of vitamin D on glucose-insulin dynamics of human body.
Objective: The main objective of the study is to develop a model to capture the effect of vitamin D on the glucose-insulin dynamics of non-diabetic, T2DM and T1DM people.
Method: A minimal model previously developed by Bergman is extended to include the effects of vitamin D via parameters. Stability analysis and numerical simulation has been performed on the vitamin D model to analyze the behavior of the model. Comparisons are made to observe the blood glucose and insulin level in non-diabetic, T2DM and T1DM people.
Result: The model assess the changes in glucose-insulin dynamics after the induction of different values of vitamin D parameters in their respective range.
Conclusion and future work: The vitamin D model captured the glucose-insulin dynamics effectively and should be recommended in our daily routine, especially for the diabetic people. Further, the dosage of vitamin D may be calculated clinically because of the variation in the population and severity of the disease.
Keywords: diabetes, glucose-insulin dynamics, T1DM, T2DM, vitamin D, insulin sensitivity, insulin resistance
Abbreviations
T1DM, type 1 diabetes mellitus; T2DM, type 2 diabetes mellitus
Introduction
Diabetes is the most widespread disease after cancer, and therefore extensive research is being carried out to develop drugs for its therapeutics. Diabetes mellitus is classified as T1DM (type 1 diabetes mellitus), T2DM (type 2 diabetes mellitus) and gestational diabetes. T1DM is an autoimmune disease in which the immune system attacks the insulin - producing β cells in the pancreas and destroys them. In T2DM, the pancreas usually produces enough insulin but for unknown reasons the body cannot use the insulin effectively a condition called insulin resistance. Insulin resistance is a risk factor for T2DM and recent studies have shown a strong relation among insulin resistance and vitamin D deficiency. Recent studies have shown that deficiency of vitamin D results in reduction of insulin secretion and thus in hyperglycemia, which leads to diabetes if it persists long.1 Optimal profile of insulin release for diabetics has been discussed in.2 Vitamin D deficiency was significantly associated with increased diastolic blood pressure, increased triglycerides levels, and reduced high density lipoprotein cholesterol and measurements of vitamin D may help to detect type 2 diabetic patients.3 A review4 states evidence of strong link between abnormal glucose-insulin dynamics and deficiency of vitamin D. Vitamin D also plays a role in the pathogenesis of T1DM and T2DM, with a special emphasis on the direct effects of vitamin D on pancreatic cells.5 Vitamin D has both direct and indirect effects on various mechanisms related to the pathophysiology of T2DM and hypertension, including pancreatic beta cell dysfunction and impaired insulin action.6 The causal link between vitamin D, T2DM and hypertension remains to be determined. Most of the researches have been done in the United States on persons suffering from either T1DM or T2DM.
Vitamin D is a powerful substance our body usually produces its own with the help of sunlight which makes our body produce a powdery substance which then converts to vitamin D. Vitamin D is obtained from exposure to sunlight, fortified foods and dietary supplements. When our skin is exposed to solar ultraviolet radiation (wavelength 290-350 nm), 7-dehydrocholesterol is converted to previtamin (D3) which is rapidly converted to cholecalciferol (D3). Ergocalciferol (D2) obtained from food along with cholecalciferol (D3) is converted into 25-hydroxyvitamin D in the presence of vitamin D-25-hydroxylase in the liver which is the major circulating metabolite and used to determine a patient’s vitamin D status.1,3–6 Almost all 25 - hydroxyvitamin D is bound to circulating DBP (vitamin D - binding protein) and is filtered by the kidneys and reabsorbed by the proximal convoluted tubules. The biologically inactive 25-hydroxyvitamin D must be converted in the kidneys to active 1, 25-hydroxyvitamin D by 1-alpha hydroxylase. Finally, the active 1, 25-hydroxyvitamin D can bind to VDR-RXR (vitamin D receptor - retinoic acid X - receptor complex) in the intestine, bone and parathyroid glands. VDRs are present in pancreatic β cells and vitamin D is essential for normal insulin secretion.7 See Figure 1 for the mechanism of synthesis of vitamin D).
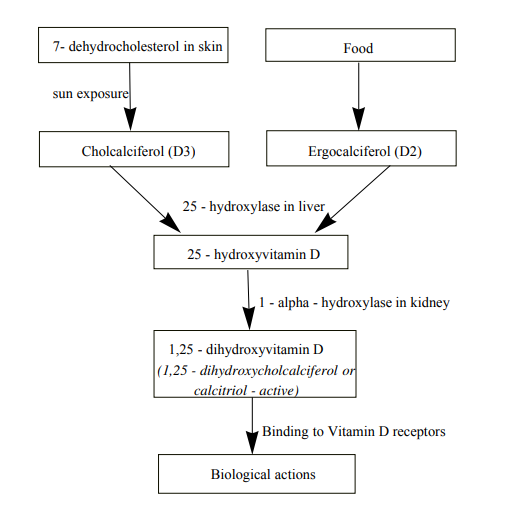
Figure 1 Mechanism of synthesis of Vitamin D.
Sunlight exposure is just one of the factors out of many which influence vitamin D status, photochemical and photobiological sciences.8 Studies have indicated that 25-hydroxyvitamin D (25(OH)D) level in obese people is lower than normal weight people. However relationship between 25(OH)D and fat mass are found to be inconsistent.9 Islet cell insulin secretion is reduced in vitamin D - deficient animals and can be corrected by vitamin D supplementation.7,10,11 The impact of vitamin D deficiency on β cell function seen in vitro and in vivo in animal models has been matched by vitamin D studies in human volunteers undergoing hyperglycaemic clamps.12 Epidemiological studies have shown that vitamin D deficiency might increase the incidence of an autoimmune disease such as T1DM.13 Vitamin D appears to affect exclusively the insulin response to glucose stimulation, while it does not appear to influence basal insulinemia.14,15 Vitamin D may have a beneficial effect on insulin action by stimulating the expression of insulin receptor thereby enhancing insulin responsiveness for glucose transport.16 Association between low vitamin D level and decreased insulin sensitivity has been reported in cross-sectional studies.12,16–22 Based on available data from recent studies, vitamin D supplementation is considered to be a potential and inexpensive therapy, which not only decreases the risk but also improves glycemic parameters in T2DM.23 The positive effects of vitamin D on insulin secretion and sensitivity and secondary its action on inflammation can be seen through available clinical and epidemiological data.24 Studies have shown that a low serum level of vitamin D increases the risk of developing diabetes.25–27 A multivariate logistic regression model was used to predict the relationship between glucose control and vitamin D deficiency.28 Recently in 2019,29 it is quoted that sunlight exposure had a beneficial but insufficient effect on 25[OH]D levels and the same levels were documented in two consecutive summer seasons confirming that vitamin D supplementation in both summer and winter should be considered. It has been shown that there is an association of vitamin D deficiency with a myriad of acute and chronic illnesses including preeclampsia, childhood dental caries, periodontitis, autoimmune disorders, infectious diseases, cardiovascular disease, deadly cancers, type 2 diabetes and neurological disorders.30–34
The purpose of the present study is to use the minimal model in order to predict the role of vitamin D on glucose-insulin regulatory system. The paper is divided into six sections. Section (1) contains the introduction of the work done till now in this area. In section (2), mathematical model is discussed by using vitamin D parameters. Positive and bounded solution of the model is given in the section (3). Stability is checked in section (4), analysis of model is done in section (5) and computer simulations are discussed in section (6). In section (7), discussion about the work done is given. Conclusion and future aspects of the work are presented in section (8).
Mathematical model
Glucose is stored in liver and peripheral tissues including muscle tissues. Glucose utilization process is controlled by insulin, which enhances glucose uptake. Also, an increase in glucose concentration augments pancreatic release of insulin. This feedback loop leads to difficulties in interpretation of test results. To overcome this problem, the whole system is decomposed into two independent components:35 (i) the effect of insulin to accelerate glucose uptake and (ii) the effect of glucose to enhance insulin secretion.
The two subsystems are described in mathematical terms and the mathematical model given by Bergman et al.36 is given as:
(1)
(2)
(3)
where,
represents glucose concentration at time t,
represents remote insulin concentration at time t,
represents the interstitial insulin at time t,
represents the threshold level of glucose above which the endogenous insulin secretion will be stimulated,
represents the basal glucose level and
denotes the basal insulin level. The parameters,
i=1,2,3,4,5 are defined in Table 1.
Parameters |
Units |
Explanation |
References |
p1 |
|
represents glucose effectiveness |
[34] |
p2 |
|
fractional rate of insulin appearance in interstitial |
|
|
compartment |
|
|
|
|
|
|
|
[34] |
p3 |
|
contribution of plasma insulin to the remote compartment |
|
|
from interstitial compartment |
|
|
|
|
|
|
|
[34] |
p4 |
|
clearance of plasma insulin |
[34] |
p5 |
|
degree by which glucose exceeds threshold or baseline |
|
|
glucose level |
|
|
|
|
|
|
|
[34] |
Table 1 Values of the parameters
To model the effects of vitamin D on glucose-insulin dynamics, we take into account four major factors:33
- vitamin D helps the cells in glucose uptake i.e. it increases glucose effectiveness
- it improves the insulin sensitivity of the body
- insulin secretion is increased due to vitamin D
- it decreases the insulin resistance.
To observe the changes in glucose-insulin dynamics due to the above said effects of vitamin D, four new parameters
, j=1,2,3,4 have been introduced in the model (1- 3) for which explanation is as follows:
-
represents the effect of vitamin D on muscles and fat cells to utilize glucose so it is incorporated with parameter p1 which represents glucose effectiveness.
-
deals with the effect of vitamin D on muscles and fat cells to increase insulin sensitivity, hence incorporated in the term containing
.
- Since vitamin D levels modulate the secretion of insulin by pancreas, hence
is combined with
which explains the same phenomena.
-
represents the effect of vitamin D in increasing utilization of the insulin, therefore combined with parameter
.
After incorporating the above new parameters in the minimal model, the extended model is as below:
(4)
(5)
(6)
The first term of the eqn.(6) contributes the plasma insulin concentration when the glucose concentration exceeds the threshold
, and is defined as
Positive and bounded solutions of the model
To show
Eqn.(4) can be written as
(7)
where
Since
,
,
,
and
, therefore right hand side of the eqn.(7) is positive. Hence
.
To show
Now eqn.(6) implies
The solution is given by
(8)
Since the integral term in the right hand side of the eqn.(8) is positive,
(9)
which implies
(10)
Hence,
.
To show
Eqn.(5) can be written as
From eqn.(9),
After solving
Since the right hand side of the above expression is positive, therefore
(11)
Hence,
always exceeds the level X0 for all time t. It can be seen in Section (4).
To show
is bounded
From eqn.(4),
Therefore,
Let
. Then,
which implies
which implies
Since
and
, this implies
is bounded.
Hence we can conclude that all the solutions)
,
,
are positive. They are also bounded above (and hence remain finite for all
) is proved in the following section.
Stability analysis of vitamin D model
Theorem 1 (Comparison Theorem37): Let
be a solution of the ordinary differential equations
and
be a solution of a second system
satisfying the same initial conditions
, over the interval
. fi, gi are defined on
and
is an open domain. Hence
are continuous functions such that
on U. Then,
for all
.
In the model (4–6), for conciseness of notation, define
The eqns. (4–6) can be written in the form:
(12)
(13)
(14)
Where
(Preposition I.5,38) is taken in the eqn.(6) of the model to check the stability of the model at the equilibrium point.
is the unit step function:
(15)
Consider the system of eqns.(12–14), first term on the right-hand side of eqn.(14) is non-zero only when g>0, any instability would arise only if g were maintained above zero i.e.,
for all
.
Suppose
(i.e.,
). Then,
and from eqns.(12–14) we see that g, x, and i tends to zero, hence the system is stable for
.
From eqn.(12), and using the Comparison Theorem, we have (where
):
where
Since glucose level can’t be negative at any time of day, hence it can be considered that
tends to zero after a finite time T, so that
passes through 0 after a time
, where
. Also at
, H becomes zero. From this, it can be concluded that
(i.e.,
).
From eqn.(14),
(16)
Now, the integral on the right in eqn.(16) is bounded above by
This shows that
is bounded:
for
.
Similarly, using eqn.(13) and Theorem 1, we have
It can be seen from eqn.(16) that i is bounded below :
for some finite
and
. Therefore from eqn.(13) and using the Comparison Theorem,
(17)
which implies
is also bounded from above and below for
.
Hence it can be concluded that if
, the system (4–6) is stable. If
, then the solution to eqn. (4) remain bounded for all
.
Analysis of model
Mathematical model will be analyzed in the neighborhood of equilibrium point to check its stability. Therefore, to determine the effect of vitamin D on glucose disappearance and insulin sensitivity after a glucose bolus at the equilibrium point, a modification has been introduced in the model (4–6) to include a glucose source. The model is given as:
,
,
,
where
is the glucose infusion rate per unit of volume at time t, which is assumed to be constant for stability analysis.
Equilibrium condition
At equilibrium
, we have
where
represents the constant rate of injection of glucose
Define
, then the function
is given by
(18)
is a decreasing function of I and
(19)
also
(20)
where
represents the threshold level of insulin.
Eqn.(19) shows that in absence of insulin, the presence of vitamin D does not lower the glucose concentration and a risk of hyperglycaemia may occur in case of T1DM and T2DM. On the other hand eqn.(20) represents the case of critical situation in which a patient dies if the level of insulin crossed the threshold level.
Non-diabetic case
In non-diabetic people, cells which are secreted by pancreas work properly so plasma glucose and plasma insulin concentration are maintained and hence the blood sugar concentration does not cross the threshold level in the body.
Analysis of the stationary point of the model:
gives the following:
The glucose effectiveness
is defined as
and the insulin sensitivity in presence of vitamin D
is defined as
In the absence of vitamin D, insulin sensitivity
becomes
Hence it can be concluded that vitamin D improves insulin sensitivity, a result which was also found by.16
T2DM (Type 2 diabetes mellitus)
Consider
In case of T2DM,
Therefore,
(21)
where,
for the values of parameter described in Table 3. In the absence of vitamin D the above expression becomes
(22)
for the values of parameter described in Table 3.
T1DM (Type 1 diabetes mellitus)
People with T1DM depends totally on insulin injection as thecells are damaged fully and do not produce any insulin, hence in this case we can take
and
so that
(23)
Eqn.(23) illustrates that in absence of insulin, even the presence of vitamin D does not lower the glucose level and a risk of hyperglycaemia may occur. Also if the amount of vitamin D increases the level of glucose in the plasma goes near to basal level and not less than basal.
Computer simulations
The model was numerical simulated by using ode45 method in Matlab 2012b. To carry out the numerical simulation, the values of parameters
i=1,2,3,4,5 are given in Tables 2–4.
,39
39 have been taken for the numerical simulation of the model. Since two different level of dosages (mild and strong) of vitamin D have been considered, therefore
, i =1,2,3,4 has taken three set of values corresponding to the absence of vitamin D, mild dosage of vitamin D and strong dosage of vitamin D. The values of the new parameters
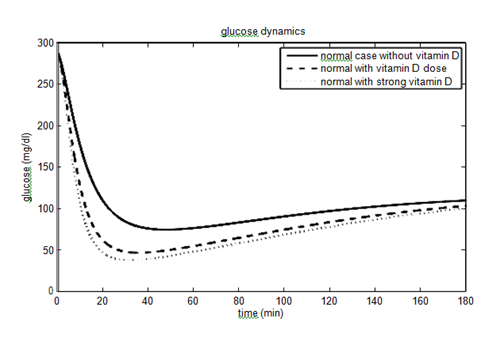
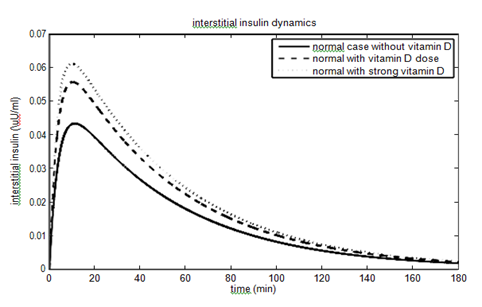
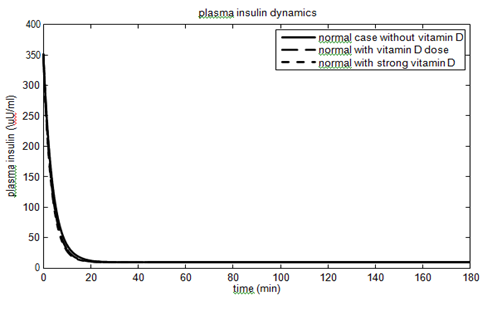
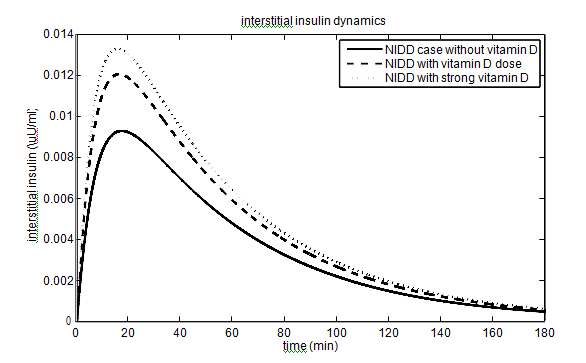
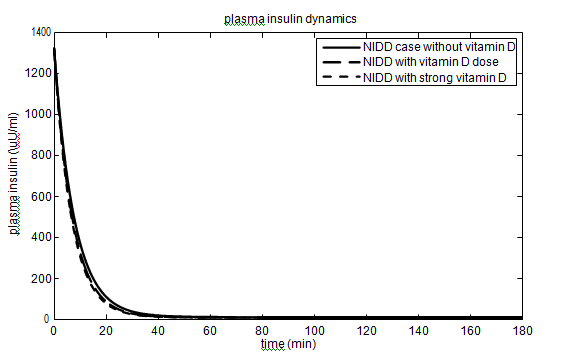
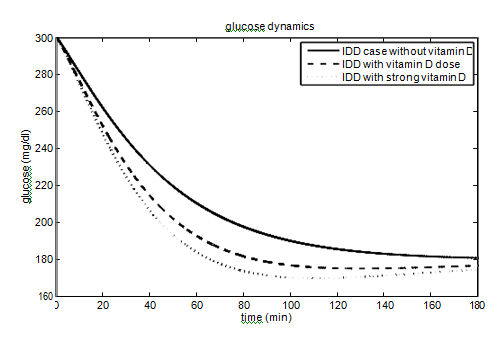
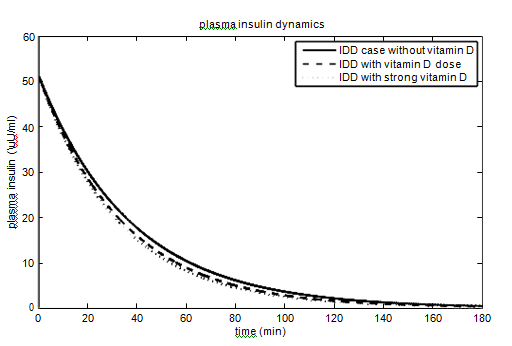
, i=1,2,3,4 which was introduced to assess the effect of vitamin D on glucose-insulin dynamics are given in the Tables 2–4. Comparisons have been made in the glucose-insulin dynamics corresponding to these three different set of values. Graphs have been plotted for each case (non-diabetic, T1DM and T2DM) to capture the effect of vitamin D to lower down the glucose level near to basal value.
Parameters |
Without Vit. D |
With mild dose of Vit. D |
With strong dose of Vit. D |
References |
p1 |
0.399e-01 |
0.399e-01 |
0.399e-01 |
[36] |
p2 |
0.200e-01 |
0.200e-01 |
0.200e-01 |
[36] |
p3 |
0.4e-04 |
0.4e-04 |
0.4e-04 |
[36] |
p4 |
0.257 |
0.257 |
0.257 |
[36] |
p5 |
0.001 |
0.001 |
0.001 |
[36] |
G0 |
287 |
287 |
287 |
[36] |
I0 |
351 |
351 |
351 |
[36] |
v1 |
0 |
0.1e-04 |
0.3e-04 |
[40] |
v2 |
0 |
0.65 |
0.95 |
[40] |
v3 |
0 |
0.16e-04 |
0.24e-04 |
- |
v4 |
0 |
0.257e-01 |
0.3855e-01 |
- |
Table 2 Values of parameters for normal
Parameters |
Without Vit. D |
With mild dose of Vit. D |
With strong dose of Vit. D |
References |
p1 |
0.14e-01 |
0.14e-01 |
0.14e-01 |
[41] |
p2 |
0.200e-01 |
0.200e-01 |
0.200e-01 |
[41] |
p3 |
0.128e-05 |
0.128e-05 |
0.128e-05 |
[41] |
p4 |
0.129 |
0.129 |
0.129 |
[41] |
p5 |
0.1e-03 |
0.1e-03 |
0.1e-03 |
[41] |
G0 |
438 |
438 |
438 |
[41] |
I0 |
1322 |
1322 |
1322 |
[41] |
v1 |
0 |
0.28e-02 |
0.28e-02 |
[40] |
v2 |
0 |
0.75 |
0.85 |
[40] |
v3 |
0 |
0.512e-06 |
0.768e-06 |
- |
v4 |
0 |
0.129e-02 |
0.1.935e-01 |
- |
Table 3 Values of parameters for NIDD
Parameters |
Without Vit. D |
With mild dose of Vit. D |
With strong dose of Vit. D |
References |
p1 |
0.16e-01 |
0.16e-01 |
0.16e-01 |
[42] |
p2 |
0.43e-01 |
0.43e-01 |
0.43e-01 |
[42] |
p3 |
0.38e-05 |
0.38e-05 |
0.38e-05 |
[42] |
p4 |
0.2676e-01 |
0.2676e-01 |
0.2676e-01 |
[42] |
p5 |
0.1e-06 |
0.1e-06 |
0.1e-06 |
[42] |
G0 |
300 |
300 |
300 |
[42] |
I0 |
51 |
51 |
51 |
[42] |
v1 |
0 |
0.28e-02 |
0.28e-02 |
[40] |
v2 |
0 |
0.75 |
0.75 |
[40] |
v3 |
0 |
0.152e-05 |
0.228e-0.5 |
- |
v4 |
0 |
0.26e-02 |
0.4008e-02 |
- |
Table 4 Values of parameters for IDD
Non-diabetic case
In non-diabetic case, the values of parameters
have been taken from the paper.36 The values of parameters
was taken same as the average normal values in humans. The values of parameters
have been picked from the paper40 as the effect of parameters on the glucose-insulin dynamics is the same. The values of the parameters
and
have been considered as 40% (60%) and 10% (15%) for vitamin D dose (strong vitamin D dose). The parameters and their values for the non-diabetic case are given in Table 1. The effect of vitamin D on the glucose- insulin dynamics for the non-diabetic case is shown in Figure 2.
T2DM case
In T2DM case, the values of the parameters (
to
) have been taken from the paper.41 Glucose effectiveness (
) and insulin sensitivity (
) in this case was found lower than the non-diabetic case.41 The parameter
has mere effect on original minimal model so we set the value of
the same as in the non-diabetic case, also
was derived from
, where
was obtained by parametric estimation for the T2DM data with basal values (
and
) and peak glucose values comparable to the normal data. The parameter
was taken as 10% of the
value for the non-diabetic case. The values of the parameters
have been taken from the paper40 as the effect of parameters on the glucose-insulin dynamics is the same. The values of the parameters
and
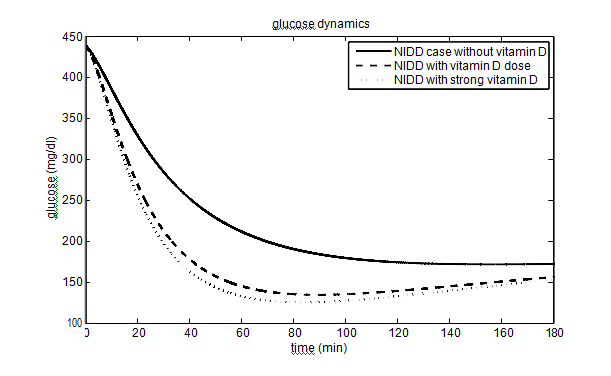
has been taken as 40% (60%) and 10% (15%) for vitamin D dose (strong vitamin D dose). The parameters and their values for the T2DM case are given in Table 2. The effect of vitamin D on glucose-insulin dynamics for T2DM people is shown in Figure 3.
T1DM case
In T1DM case, we had considered
and
. The values of the parameters (
to
) have been chosen from the paper.42
and
in T1DM case was lower than in the non-diabetic case. Value of
has been considered within the normal range and the parameters
,
have been obtained by linear regression of log transformed T1DM data. The value of
has been taken as very small, as the T1DM cases have lower response to pancreas.40, 42 The values of parameters
have been taken from the paper,40 as the effect of parameters on the glucose-insulin dynamics is the same. The values of the parameters andhave been taken as 40% (60%) and 10% (15%) for vitamin D dose (strong vitamin D dose). The parameters and their values for the T1DM case are given in Table 3. The effect of vitamin D on glucose-insulin dynamics for T1DM people is shown in Figure 4.
Discussion
About 422 million people worldwide have diabetes, the majority living in low and middle income countries. Approximately 1.6 million deaths are directly attributed to diabetes each year. People having low income and suffering from diabetes are struggling to get the treatment involves insulin therapy which is very costly. This motivates us to find an approachable way to control the disease and make us focus on the vitamin D which not only increases the insulin sensitivity but gives a clear illustration of glucose-insulin dynamics. Vitamin D helps the muscles and fat cells to absorb glucose from plasma and increases the insulin sensitivity. To the best of our knowledge, it is the first mathematical model which incorporates the effects of vitamin D via parameters. In this paper, we have shown the level of glucose concentration decreased to 140 mg/dl from 180 mg/dl in T2DM people and from 190 mg/dl to 165 mg/dl in T1DM people after incorporating the vitamin D parameters (still not in the normal physiological range as vitamin d dose is not the solely responsible factor to control the glucose concentration). This illustration confirms that we should include a vitamin D dose in our daily routine (by the recommendation of a physician), especially for the persons who are involved in the industrial sector and do indoor jobs. Each individual should adjust the dosage of vitamin D according to his/her requirements.
Conclusions and future work
In this paper, we discussed the glucose-insulin regulatory system model for diabetic persons using vitamin D effect via parameters. We have studied the mathematical model analytically and numerically. For the first time, effect of vitamin D has been dealt mathematically to discuss the situation of diabetes. Our results reveal that vitamin D has a great impact on the glucose-insulin regulatory system. The mathematical model captured the effect of vitamin D on glucose-insulin dynamics in which it is confirmed that the important parameters which determine insulin sensitivity, pancreatic responsivity and glucose effectiveness have a large impact on the model. In future, the present mathematical model can be extended further to incorporate the exact dose of vitamin D to capture the impact of vitamin D on glucose-insulin regulatory system, according to the severity of the disease. Such mathematical model will be of great help to the diabetic community which is currently increasing very rapidly.
Ethical approval
This article does not contain any studies with human participants or animals performed by any of the authors.
Contributory details
Ms. Saloni Rathee has contributed to the study design, numerical analysis and manuscript preparation. Ms. Nilam has contributed to the manuscript editing and review. Both have made equal contribution in the literature search.
Acknowledgments
The authors are thankful to Delhi Technological University, Delhi for the financial support.
Conflicts of interest
The authors declare that they have no conflicts of interest.
Funding
References
- MF Holick. Resurrection of vitamin D deficiency and rickets. J Clin Invest. 2006;116(8):2062–2072.
- Nilam, ME Alexander, R Mathur, et al. Modelling the effect of CSII on the control of glucose concentration in type 1diabetes. Applied Mathematics and Computing. 2006;187(2):1476–1483.
- R Bouillon. Vitamin D: from photosynthesis, metabolism, and action to clinical applications eds. In: Endocrinology, LJ DeGroot and JL Jameson, Eds. WB Saunders, Philadelphia, Pa, USA. 2001:1009–1028.
- HF DeLuca. Overview of general physiologic features and functions of vitamin D. Am J Clin Nutr. 2004;80(6 Suppl):1689S–1696S.
- MF Holick. Vitamin D deficiency. N Engl J Med. 2007;357(3):266–281.
- KA Hruska. Hyperphosphatemia and hypophosphatemia, In primer on the metabolic bone diseases and disorders of mineral metabolism, MJ Favus, Ed. American society for bone and mineral research. Washington, DC, USA, 6th edition. 2006:233–242.
- AW Norman, JB Frankel, AM Heldt, et al. Vitamin D deficiency inhibits pancreatic secretion of insulin. Science. 1980;209(4485):823–825.
- M Abboud, MS Rybchyn, R Rizk, et al. Sunlight exposure is just one of the factors which influence vitamin D status. Photochemical and Photobiological Sciences. 2017;16(3):302–313.
- M Golzarand, BW Hollis, P Mirmiran, et al. Vitamin D supplementation and body fat mass: a systematic review and meta-analysis. Eur J Clin Nutr. 2018;72(10):1345–1357.
- BS Chertow, WI Sivitz, NG Baranetsky, et al. Cellular mechanisms of insulin release: the effects of vitamin D deficiency and repletion on rat insulin secretion. Endocrinology. 1983;113(4):1511–1518.
- BL Nyomba, J Auwerx, V Bormans, et al. Pancreatic secretion in man with subclinical vitamin D deficiency. Diabetologia. 1986;29(1):34–38.
- KC Chiu, A Chu, VLW Go, et al. Hypovitaminosis D is associated with insulin resistance and b cell dysfunction. Am J Clin Nutr. 2004;79(5):820–825.
- C Mathieu, K Badenhoop. Vitamin D and type 1 diabetes mellitus: state of the art. Trends Endocrinol Metab. 2005;16(6):261–266.
- PM Bourlon, B Billaudel, A Faure-Dussert. Influence of vitamin D3 deficiency and 1, 25 dihydroxyvitamin D3 on de novo insulin biosynthesis in the islets of the rat endocrine pancreas. J Endocrinol. 1999;160(1):87–95.
- U Zeitz, K Weber, DW Soegiarto, et al. Impaired insulin secretory capacity in mice lacking a functional vitamin D receptor. FASEB J. 2003;17(3):509–511.
- L Lind, A Hanni, H Lithell, et al. Vitamin D is related to blood pressure and other cardiovascular risk factors in middle - aged men. Am J Hypertens. 1995;8(9):894–901.
- O Gedik, S Akalin. Effects of vitamin D deficiency and repletion on insulin and glucagon secretion in man. Diabetologia. 1986;29(3):142–145.
- AM Borissova, T Tankova, G Kirilov, et al. The effect of vitamin D3 on insulin secretion peripheral insulin sensitivity in type 2 diabetic patients. Int J Clin Pract. 2003;57(4):258–261.
- L Lind, T Pollare, A Hvarfner, et al. Long-term treatment with active vitamin D (alphacalcidol) in middle-aged men with impaired glucose tolerance, effects on insulin secretion and sensitivity, glucose tolerance and blood pressure. Diabetes Res. 1989;11(3):141–147.
- E Orwoll, M Riddle, M Prince. Effects of vitamin D on insulin and glucagon secretion in non-insulin independent diabetes mellitus. Am J Clin Nutr. 1984;59(5):1083–1087.
- R Scragg, M Sowers, C Bell. Serum 25 - hydroxyvitamin D, diabetes, and ethnicity in the third national health and nutrition examination survey. Diabetes Care. 2004;27(12):2813–2818.
- KC Baynes, BJ Boucher, EJ Feskens, et al. Vitamin D, glucose tolerance and insulinaemia in elderly men. Diabetologia. 1997;40(3):344–347.
- T Takiishi, C Gysemans, R Bouillon, et al. Vitamin D and diabetes. Endocrinol Metab Clin North Am. 2010;39(2):419–446.
- CEA Chagas, Borges MC, Martini LA, et al. Focus on vitamin D, inflammation and type 2 diabetes. Nutrients. 2012;4(1):52–67.
- B Schottker, C Herder, D Rothenbacher, et al. Serum 25-hydroxyvitamin D levels and incident diabetes mellitus type 2: a competing risk analysis in a large population-based cohort of older adults. European J Epidemiol. 2013;28(3):267–275.
- Tsur A, BS Feldman, I Feldhammer, et al. Decreased serum concentrations of 25-hydroxycholecalciferol are associated with increased risk of progression to impaired fasting glucose and diabetes. Diabetes Care. 2013;36(5):1361–1367.
- S Afzal, SE Bojesen, BG Nordestgaard. Low 25-hydroxyvitamin D and risk of type 2 diabetes: a prospective cohort study and metaanalysis. Clin Chem. 2013;59(2):381–391.
- Mansour S Almetwazi, Ahmad O Noor, Diena M Almasri, et al. The association of vitamin D deficiency and glucose control among diabetic patients. Saudi Pharm J. 2017;25(8):1179–1183.
- P Lundstrm, K Caidahl, MJ Eriksson, et al. Changes in vitamin D status in overweight middle-aged adults with or without impaired glucose metabolism in two consecutive Nordic summers. J Nutr Metab. 2019:1840374.
- MF Holick. The vitamin D deficiency pandemic: approaches for diagnosis, treatment and prevention. Rev Endocr Metab Disord. 2017;18(2):153–165.
- CE Williams, EA Williams, BM Corfe. Vitamin D status in irritable bowel syndrome and the impact of supplementation on symptoms: what do we know and what do we need to know? Eur J Clin Nutr. 2018;72(10):1358–1363.
- M Wacker, MF Holick. Sunlight and vitamin D. A global perspective for health. Dermatoendocrinol. 2013;5(1):51–108.
- CC Sung, MT Liao, KC Lu, et al. Role of vitamin D in insulin resistance. J Biomed Biotechnol. 2012;2012:634195.
- RN Bergman, LS Phillips, C Cobelli. Physiologic evaluation of factors controlling glucose tolerance in man: measurement of insulin sensitivity and beta-cell glucose sensitivity from the response to intravenous glucose. J Clin Invest. 1981;68(6):1456–1467.
- RN Bergman, C Cobelli. Minimal modeling, partition analysis and the estimation of insulin sensitivity. Fed Proc. 1980;39(1):110–115.
- G Pacini, RN Bergman. MINMOD: a computer program to calculate insulin sensitivity and pancreatic responsivity from the frequently sampled intravenous glucose tolerance test. Comput Methods and Programs in Biomed. 1986;23(2):113–122. 17
- Arnold VI. Ordinary differential equations. MIT Presss, Cambridge MA. 1973.
- D Gaetano, O Arino. Mathematical modelling of the intravenous glucose tolerance test. J Math Biol. 2000;40(2):136–168.
- Nittalal, S Ghosh, D Stefanovski, et al. Dimensional analysis of MINMOD leads to definition of the disposition index of glucose regulation and improved simulation algorithm. BioMedical Engineering OnLine. 2006;44(5):1–15.
- M Derouich, A Boutayeb. The effect of physical exercise on the dynamics of glucose and insulin. J Biomech. 2002;35(7):911–917.
- S Welch, SS Gebhart, RN Bergman, et al. Minimal model analysis of intravenous glucose tolerance test-derived insulin sensitivity in diabetic subjects. J Clin Endocrinol Metab. 1990;71(6):1508–1518.
- DT Finegood, IM Hramiak, J Dupre. A modified protocol for estimation of insulin sensitivity with the minimal model of glucose kinetics in patients with insulin-dependent diabetes. J Clin Endocrinol Metab. 1990;17(6):1538–1549.

©2021 Rathee, et al. This is an open access article distributed under the terms of the,
which
permits unrestricted use, distribution, and build upon your work non-commercially.


