Journal of
eISSN: 2374-6947


Review Article Volume 2 Issue 4
Otvos LipoScience, Laboratory Corporation of America
Correspondence: Margery A Connelly, PhD. Laboratory Corporation of America, Tel 919 256 1038, Fax 919 256 1039
Received: September 01, 2015 | Published: September 14, 2015
Citation: Connelly MA, Winegar DA, Shalaurova I, et al. Nuclear magnetic resonance measured serum biomarkers and type 2 diabetes risk stratification. J Diabetes Metab Disord Control. 2015;2(4):143-147. DOI: 10.15406/jdmdc.2015.02.00050
Metabolomic studies have shown several serum or plasma biomarkers are raised in subjects with insulin resistance and type 2diabetes (T2D). In addition, several of these biomarkers, including various lipoprotein parameters, markers of inflammation and branched chain amino acids have been shown to be associated with new-onset T2D. A recently developed clinical Nuclear Magnetic Resonance (NMR) instrument the Vantera® Clinical Analyzer has the ability to measure these biomarkers in a single serum sample. Combining these NMR-measured biomarkers of future diabetes risk into a single algorithm called the Diabetes Risk Index or DRI, allows better diabetes prediction than any one of the individual biomarkers. This review summarizes the data suggesting that DRI may be a simple, inexpensive way to alert patients of their heightened risk of developing diabetes before they become prediabetic, allowing time for effective lifestyle modification to theoretically prevent, not just delay, onset of the disease.
Keywords: nuclear magnetic resonance, lipoprotein particles, GLYCA, branched chain amino acids, type 2 diabetes
BMI, body mass index; CVD, cardiovascular disease; FPG, fasting plasma glucose; HDL, high density lipoprotein; HOMA-IR, homeostasis model assessment of insulin resistance; JUPITER: justification for the use of statins in prevention: an intervention trial evaluating rosuvastatin; LDL, low density lipoprotein; NMR, nuclear magnetic resonance; MESA, multi-ethnic study of atherosclerosis; PREVEND, prevention of renal and vascular end-stage disease study; T2D, type 2 diabetes; VLDL, very low density lipoprotein; WHS, women’s health study
According to statistics released by the Centers for Disease Control and Prevention (CDC) in 2014, over 86 million people in the United States are prediabetic.1 More than 90% of these people are unaware of their condition or their increased risk of developing Type 2 Diabetes (T2D) within five years unless there is some intervention to prevent or delay the disease. Prediabetes is most often diagnosed as moderately elevated Fasting Plasma Glucose (FPG) levels (FPG, 100-125mg/dL) or as elevated levels of hemoglobin A1c (HbA1c, 5.7-6.4%). However, many individuals who are normoglycemic (FPG<100mg/dL) are at high-risk of progressing to T2D while others who are prediabetic are at low risk, indicating the need for risk assessment beyond glucose or HbA1c levels alone. Most individuals with T2D develop insulin resistance well in advance of the diagnosis of their disease. Insulin resistance often remains unrecognized because the body compensates for the decreased tissue sensitivity to insulin by producing more insulin to maintain blood glucose levels in the normal range. Over time however, the pancreatic ß-cells may fail to keep up with the increased demand for insulin and excess glucose begins to accumulate in the bloodstream. Fortunately, if insulin resistance is detected early, lifestyle changes and/or medication can often be used to prevent or delay the onset of T2D.2,3
In order to allow time for successful intervention to occur, it is important to identify early biomarkers that predict T2D. Insulin resistance and T2D are associated with altered lipid and lipoprotein metabolism and elevated circulating concentrations of Branched-Chain Amino acids (BCAA) and markers of inflammation.4-14 These findings have been documented for numerous cross-sectional studies, but only recently has data been published from prospective longitudinal studies showing that levels of circulating biomolecules can predict future development of diabetes in otherwise normal, healthy individuals.4,8,15-20
There are well-characterized changes in lipoprotein metabolism that occur in subjects with insulin resistance long before prediabetes or diabetes is diagnosed. These changes can be assessed by measuring the concentrations and sizes of various lipoprotein particles using proton Nuclear Magnetic Resonance (NMR) spectroscopy. NMR spectroscopy has been successfully applied to the measurement of lipoprotein particles in clinical samples for more than 10 years.21-23 The lipoprotein NMR signal is derived from terminal methyl groups on lipids within the core and shell of lipoprotein particles. From a single, 0.5 mL serum or plasma sample, concentration and size information for Very Low-Density Lipoprotein (VLDL), Intermediate Density Lipoprotein (IDL), Low-Density Lipoprotein (LDL) and High-Density Lipoprotein (HDL) particles can be derived in less than 2 min per sample.
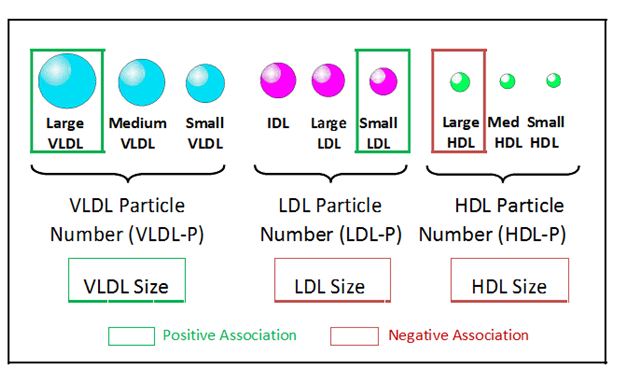
Alterations in six NMR-measured lipoprotein parameters have been observed in insulin resistant individuals. These include higher levels of large VLDL and small LDL particles and lower levels of large HDL particles (Figure 1).4,16,21,24-28 In addition, mean VLDL particle size is generally greater and mean LDL and HDL sizes are smaller in insulin resistant subjects (Figure 1).4,16,24-27 These six NMR-measured lipoprotein parameters have been combined into a single weighted score, the Lipoprotein Insulin Resistance Index or LP-IR score (varying from 1to100) that can be used as a simple means to identify individuals with insulin resistance.27 Development of LP-IR was guided by data from the Multi-Ethnic Study of Atherosclerosis (MESA) where there was a strong correlation between LP-IR and HOMA-IR (homeostasis model assessment of insulin resistance) in fasting blood samples collected at baseline from 4,972 non-diabetic subjects. These data were verified by comparing LP-IR to glucose disposal rates measured during hyperinsulinemic-euglycemic clamps in 56 insulin sensitive, 46 insulin resistant and 46 untreated subjects with T2D.27

The association of LP-IR with insulin resistance was further validated in two independent cohorts of subjects studied at Duke University.29 In both cohorts (n=220 and 290) there was a significant inverse correlation between LP-IR and the insulin sensitivity index (Si) measured during an intravenous glucose tolerance test and a significant positive association with HOMA-IR.29 Taken together, these data suggest that LP-IR provides a simple means to identify individuals with insulin resistance from a single, fasting blood sample.4
Because insulin resistance precedes T2D the LP-IR score and its lipoprotein components are able to predict future T2D.4,16-20 Among>26,000 women enrolled in the Women’s Health Study (WHS) all six components of LP-IR were associated with the development of T2D, both before and after adjustment for standard lipid and non-lipid risk factors.18 A similar analysis of the JUPITER (Justification for the Use of Statins in Prevention: An Intervention Trial Evaluating Rosuvastatin) trial revealed that specific lipoprotein parameters (increased LDL particle concentrations, larger VLDL and smaller HDL particle size) were associated with increased risk of developing T2D, even after adjusting for traditional risk factors including triglycerides, LDL and HDL cholesterol. Furthermore LP-IR and its lipoprotein components were significantly associated with T2D development in the MESA. In this study, a cohort of 5,314 non-diabetic study participants was followed for a mean follow-up of 7.7 years in which 656 cases of clinically diagnosed T2D were documented. LP-IR and two of its components, large VLDL -P and VLDL size, were associated with the development of T2D independent of established risk factors, glucose, insulin, or HOMA-IR.20 It has even been suggested that LP-IR may be a convenient clinical tool to screen and monitor patients at risk for T2D including during statin therapy.
Circulating markers of inflammation, including acute phase proteins, have been shown to be associated with risk of progressing to T2D.15,30,31 Moreover, low-grade chronic systemic inflammation is recognized as a causal factor in the development of insulin resistance and pancreatic ß-cell dysfunction.15,32,33 A recently described biomarker, called GlycA, is quantified from the same NMR spectra collected for lipoprotein particle analysis and is correlated with markers of inflammation including high sensitivity C-reactive protein (hsCRP), fibrinogen, interleukin -6 and serum amyloid A.34-39 The GlycA NMR signal originates from glycosylated proteins and captures both the circulating levels and complex glycosylation patterns of the most abundant acute phase proteins.40,41 These data support the hypothesis that GlycA is a unique marker of systemic inflammation.
Similar to hsCRP, GlycA is associated with insulin resistance, incident Cardio Vascular Disease (CVD) and risk of T2D. Levels of GlycA were found to be higher in subjects with metabolic syndrome and were positively correlated with Body Mass Index (BMI) and insulin resistance as assessed by HOMA-IR.37-39 In the WHS, GlycA was associated with CVD events, independent of traditional risk factors.42 Similar results were reported for subjects enrolled in the JUPITER trial, where baseline concentrations of GlycA were significantly associated with incident CVD events, even when adjusting for established risk factors and a family history of premature coronary heart disease.43 Remarkably, this association was only slightly attenuated by hsCRP. Moreover, GlycA was found to predict incident T2D in a large population of healthy women.44 These data, therefore, raise the possibility that GlycA and hsCRP may provide complementary value for the evaluation of CVD and diabetes risk.
The BCAAs, valine, leucine and isoleucine have been implicated in the regulation of glucose metabolism.10,45,46 Increased BCAAs are associated with insulin resistance, T2D and coronary artery disease.5-7,9-13,47-51 There are several potential mechanisms contributing to the increase in circulating BCAA concentrations in these dysmetabolic states. These include excess dietary consumption, elevated protein degradation and decreased BCAA catabolism in muscle and adipose tissue due to reduced expression of the genes in the BCAA catabolic pathway.10,52 It has been hypothesized that increased circulation of BCAAs may in fact be a causal factor in the development of insulin resistance and T2D by contributing to overloading of mitochondria with lipid substrates leading to mitochondrial stress and impaired insulin action.10,51
Consistent with these observations, BCAAs are predictive of diabetes development and are responsive to therapeutic interventions that enhance insulin sensitivity.10,47,48,53,54 Fasting concentrations of the BCAAs, phenylalanine and tyrosine were found to be elevated 12 years prior to the onset of T2D in Framingham Offspring Study participants.47
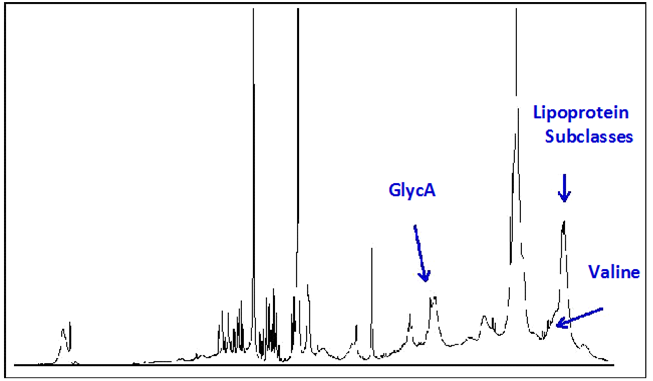
Similar to GlycA, circulating concentrations of BCAAs can be quantified from NMR spectra collected for lipoprotein particle analysis on a clinical NMR instrument (Figure 2). Preliminary analysis of spectra collected for 3,309 non-diabetic participants in the MESA, of whom 352 developed T2D during the mean 9.4 years follow-up period, showed a significant association of baseline valine levels with future T2D, independent of diabetes risk factors including age, gender, race and glucose (Table 1). These data suggest that measurement of circulating BCAAs in a clinical setting may be useful for determining metabolic and organ dysfunction prior to development of T2D, enabling preventative measures to potentially impact disease progression.
MESA (n=352/3309) (incident diabetes/total participants) |
||
|---|---|---|
|
Wald X2 |
P |
Age |
11.4 |
0.0007 |
Gender |
20.8 |
<0.0001 |
Race |
20.1 |
0.0002 |
Glucose |
218.8 |
<0.0001 |
Valine |
32.9 |
<0.0001 |
Table 1 NMR-measured valine is strongly associated with incident T2D in the MESA.
Multi-Ethnic Study of Atherosclerosis (MESA) subjects with Fasting Plasma Glucose (FPG) <110 mg/dL who were non-diabetic at baseline; n=352 subjects developed Type 2 Diabetes (T2D) during the mean 9.4 years follow-up. Presented at the 2014 Annual Meeting of the American Association of Clinical Chemistry

With the current shift in healthcare toward chronic disease prevention, there is an increased demand for a simple, reliable and inexpensive test to identify individuals at highest risk of developing T2D. It is intriguing to consider that the wealth of information derived from a single NMR spectrum taken of a fasting blood sample could be integrated into a multi-marker algorithm which would better predict disease than any one of the individual biomarkers. To this end, a Diabetes Risk Index (DRI) has been developed which combines several lipoprotein parameters (LP-IR, medium VLDL and HDL particle numbers) with GlycA and valine (Figure 2). Preliminary data suggested that the DRI score (varying from 1-10) significantly increased the predictive power of a 5-year diabetes prediction model based on subjects in MESA and the Insulin Resistance Atherosclerosis Study (IRAS) even when adjusting for age, gender, race and glucose.55-57 In addition, DRI added to diabetes prediction in IRAS even when BMI was included in the prediction model (Table 2).56
Model |
Parameter |
Odds Ratio (95% CI) |
P value |
AUC |
Base |
Age, sex, race, glucose |
_ |
_ |
0.715 |
Base+ DRI |
DRI |
2.26 (1.68-3.04) |
<0.0001 |
0.775 |
Base + DRI + BMI |
DRI |
2.13 (1.57-2.90) |
<0.0001 |
|
BMI |
1.21 (0.96-1.53) |
0.11 |
0.78 |
Table 2 Diabetes Risk Index (DRI) Adds Significantly and Independently of Body Mass Index (BMI) to Diabetes Risk Prediction in IRAS.
Logistic regression analyses with base model adjusted for age, gender, race and glucose. Beta coefficients for the NMR variables in this model applied to the subgroup of Insulin Resistance Atherosclerosis Study (IRAS) subjects with fasting plasma glucose (FPG) <110 mg/dL of which 88 converted to type 2 diabetes (T2D) during follow-up. Area under the receiver operating curve was calculated for each model. Presented as a poster at the 74th Scientific Sessions of the American Diabetes Association56
Moreover, when stratified by quartiles, it was clear that IRAS subjects in the highest quartile of DRI have a higher risk of conversion to T2D than those in the lowest quartile.56
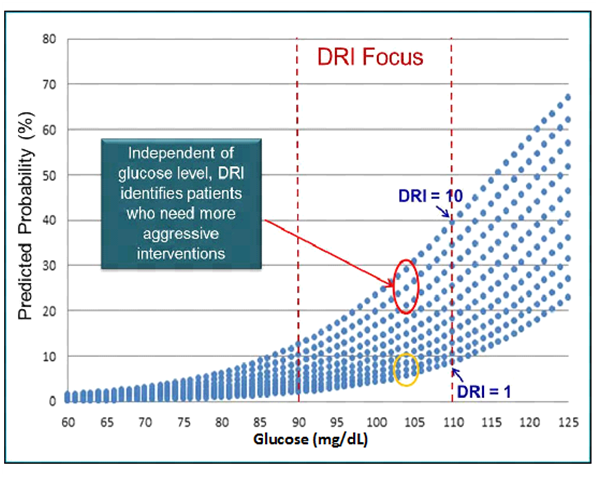
This was true in who were (adjusted rates for Q1-Q4; 6.0, 5.3, 17.5, 23.0) overweight (Q1-Q4; 1.3, 3.2, 11.5, 14.5) or normal weight (Q1-Q4; 6.2, 4.9, 7.0, 13.0).56 Thus, DRI was able to forecast diabetes on top of FPG in all subjects regardless of BMI, suggesting that DRI is capable of stratifying diabetes risk even in patients who are not overweight or obese.56 Illustration of how DRI is capable of stratifying a patient’s risk of diabetes onset can be found in Figure 3. A patient with a DRI score of 10 has a 4-5 fold higher probably of progressing to T2D in 5 years than a patient with a DRI score of 1 (Figure 3).

Based on this early evidence, the DRI score, measured on a clinical NMR instrument the Vantera® Clinical Analyzer (LipoScience) may serve to differentiate future risk of T2D and help guide the selection and intensity of interventions intended to prevent progression to diabetes as proposed in the complications-centric algorithm for weight loss therapy by the American Association of Clinical Endocrinologists.58,59 Additional studies need to be performed to compare the DRI score with additional biomarkers and parameters used for predicting T2D in order to prove this is to be the case. However, once fully developed, a simple tool such as the DRI could be used by physicians to alert patients of their heightened risk of progressing to diabetes even before they become prediabetic allowing time for effective lifestyle modification to prevent or delay diabetes onset.
None.
Author declares that there is no conflict of interest.

©2015 Connelly, et al. This is an open access article distributed under the terms of the, which permits unrestricted use, distribution, and build upon your work non-commercially.