Journal of
eISSN: 2374-6947


Research Article Volume 5 Issue 1
1Department of Internal Medicine, Medical College, India
2Department of Endocrinology, AIIMS, India
3Department of Endocrinology, Medical College, India
4Medical Services, Biocon LTD, India
Correspondence: Biplab Mandal, Eden Tolly Lakeside, Block-F/1, Flat-3A, 319 M.G.Road, Kolkata-700104, India, Tel +91 943 425 5272
Received: July 17, 2017 | Published: January 22, 2018
Citation: Mandal B, Shukla R, Basu AK, et al. Association of ABO blood groups with type-2 diabetes mellitus and its complications. J Diabetes Metab Disord Control. 2018;5(1):1-7. DOI: 10.15406/jdmdc.2018.05.00130
Background: As type 2 DM has posed challenging and formidable problem globally lots of scientific research work have been targeted and concepts are evolving every other day to unleash newer etiological factor in its causation and side by side risk factors so that proper aggressive strategy can be instituted to contain the disease at the very outset. Keeping these ideas in the back of our mind we embarked upon this small but compact path finding study.
Methodology: The study conducted in the Dept. of Endocrinology, Medical College and Hospital, Kolkata. Patients suffering from Type-2 DM (diagnosed by ADA criterion) attending our diabetic clinic and diabetic patients admitted including the Dept. of Endocrinology and Internal Medicine were selected for this study. Study was conducted from March 2013 to December 2014. 276, Type-2 diabetic patients and 117 healthy control subjects among the relative of patients and volunteers were selected for this study to compare distribution of ABO blood groups. All the study subjects were selected by random sampling technique. ABO blood grouping (determined by using Tulip Diagnostic Kit). Screening of complications done by appropriate clinical examinations and laboratory investigations.
Results: Total 276 patients with type 2 DM were included in this study. Of those 276 diabetic patients 152(55%) were male and 124(45%) were female. 117 healthy control subjects among the relative of patients and volunteers were selected for this study to compare distribution of ABO blood groups. Mean age of diabetic patient was 50.46(±10.38) and non-diabetic control subjects was 40.52(±12.21). Mean BMI was 24.18(±3.77) in diabetic subjects and was 25.40(±3.92) in control population. Chi- square statistical analysis among different blood groups between non-diabetic (n=111) and diabetic population (N=276) revealed no significant relationship of any blood group with type 2 DM (p˃0.05). But relative risk (RR) were calculated in reference to blood group O, it has been observed that slight increase of risk of developing type 2 DM among AB( RR 1.075), A(1.044) and B(1.033).With regards to distribution of patients (in number) with type 2 DM with different microvascular complications, Nephropathy was the most common complication observed among different blood groups (37.2% in B, 36.6% in O, 36.5% in A and 34.5% in AB).Further exploring the association between specific blood groups in type 2 diabetes subjects and microvascular complications, no significant association observed with type 2 DM and neuropathy, nephropathy and retinopathy (p˃0.05). However, taking blood group O as a reference group, Blood group AB (RR 0.583 and blood group A(RR0.698) were less likely to develop neuropathy compare to blood group O. However no difference in relative risk found for development of nephropathy and retinopathy.
Conclusion: We found that person with O+ve blood group has least chance of developing Type 2 DM whereas subject with AB+ve blood group are more vulnerable to develop Type 2 DM. Therefore, the effects of blood groups should be investigated in future clinical and epidemiological studies on diabetes. Further pathophysiological research is also needed to determine why the individuals with blood type O have a lower risk of type 2 diabetes. No significant relationship with any microvascular complication of Type 2 DM and any blood group is observed. Blood group AB+ and A+ are less likely to develop neuropathy compare to O+.
Keywords: type 2 diabetes, ABO blood groups, complications, association
Karl Landsteiner first described the ABO blood group in 1900.1 Blood grouping is based on antigenic property of red blood cells (RBC). The major human blood group system is ABO. The blood group of a person depends upon the presence or absence of two genes A and B. The majority of ABO determinants are expressed on the ends of long polylactosamine chains.2 The gene for ABO group is present on chromosome 9 and on chromosome 1 for Rh system. The ABO system consists of complex carbohydrate molecules. Ever since the discovery of blood groups in 1900, there have been efforts to discover a possible association between ABO and Rh blood groups and different diseases.3 Certain diseases show strong association with the ABO blood groups, notably, peptic ulcer is much higher in blood group O4 whereas stomach cancer,5 tumors of salivary glands6 are more frequent in blood group A individuals. Many reports have appeared in recent years suggesting an association between blood groups and diabetes mellitus.7 The etiology of diabetes mellitus is complex and appears to involve interactions of genetic, immunological and environmental factors.8 In fact, human chromosome 1q21-q23 showed well replicated linkage to type-2 diabetes mellitus.9
The ABO blood group genes are mapped at 9q34.2 region in which genetic alteration is common.10 McConnell’s in 1955 suggested increased frequency of blood group A among diabetic patients.11 In Copenhagen, significant excess of blood group O was found in male diabetics.12 In Italy13 and Trinidad14 results showed an increased frequency of blood group B among diabetics. Studies in Germany,15 Glasgow,16 Bangladesh17 and a number of other recent studies showed no association was apparent between type 2 Diabetes mellitus and blood group in the diabetics studied.18 As the incidence of Type-2 DM is growing day by day; our search for its aetiology and pathogenesis is also ever growing to predict its risk factors and early screening for better care and prevention of its complications. As per our present knowledge Type-2 DM has a strong genetic component. ABO blood group is also determined by our in built genetic makeup. So it can be hypothesize that there may be a good association in between ABO blood groups and Type-2 DM. Also complications of diabetes mellitus are multifactorial. Though poor glycemic control is the key factor for development of complications of DM, it has also been observed that there is evidence of a familial clustering of diabetic nephropathy in type 2 diabetes and affected sib pair linkage analyses have identified loci associated with diabetic nephropathy in type 2diabetes. A diabetic sibling of a person with type 1 diabetes and nephropathy has approximately 72% cumulative risk of developing renal disease, whereas a diabetic sibling of a person with type 1diabetes but without nephropathy has only a 25% risk. This indicates that inherited factors play an important role in determining susceptibility to diabetic nephropathy but does not provide much insight into the nature of these factors.19 Also some observations suggest a genetic predisposition to the development of neuropathy and retinopathy.20
Our study was conducted with following objectives:
To determine whether
Place of study
The study conducted in the Dept. of Endocrinology, Medical College and Hospital Kolkata.
Study population
Patients suffering from Type-2 DM attending our diabetic clinic and diabetic patients admitted including the Dept. of Endocrinology and Internal Medicine were selected for this study.
Study periods
Study was conducted from March 2013 to December 2014.
Sample size
276, Type-2 diabetic patients and 117 healthy control subjects among the relative of patients and volunteers were selected for this study to compare distribution of ABO blood groups.
Sample design
All the subjects were selected by random sampling technique.
Inclusion criteria’s
Subjects with Type-2 Diabetes mellitus within age group of 30-70years were included in this study.
Exclusion criterias
Study design
Hospital based cross-sectional study.
Parameter studied
For specific objectives no-1:
Criteria for the diagnosis of diabetes: Patient’s diabetic status was evaluated by using diagnostic criteria defined by ADA as HbA1c ≥5%. The test should be performed in a laboratory using a method that is NGSP certified and standardized to the DCCT assay. *OR FPG ≥126mg/dL (7.0mmol/L). Fasting is defined as no caloric intake for at least 8h. *OR 2-h PG ≥200mg/dL (11.1mmol/L) during an OGTT. The test should be performed as described by the WHO, using a glucose load containing the equivalent of 75g anhydrous glucose dissolved in water. *OR In a patient with classic symptoms of hyperglycemia or hyperglycemic crisis, a random plasma glucose ≥200mg/dL (11.1mmol/L). *In the absence of unequivocal hyperglycemia, results should be confirmed by repeat testing.
For specific objective no-2: Screening of neuropathy (DPN), retinopathy and nephropathy by history taking, clinical examinations, followed by
Study tools
Clinical Laboratory reports, Tuning fork (128Hz), 10g monofilament (Semmes-Weinstein monofilaments), Clinical hammer for evaluation of neuropathy and Ophthalmoscope (HEINE) for evaluation of retinopathy.
Statistical analysis of data
Statistical analysis was performed using SPSS statistical software (version 19) and MS Excel 2010. The analysis was performed on the set of all eligible subjects enrolled in the study according to the study protocol. The prevalence of diabetes and its complications in various ABO blood groups were summarized as counts and percentages. Chi-square test and relative risk was used to assess the trends in the prevalence of diabetes and its complications and association with categorical data while continuous data were depicted in terms of Mean and SD. Results were considered significant when p value<0.05.
The study had a population consisting of 55% male and 45% female. Most of the populations (48%) were in the normal BMI (18.5 to ˂25). Only 10% of population was in the obesity group (BMI˃30) and 5% of populations were under low BMI group (˂18.5). Most of the patients were in ˂5years of duration (38%), 30% patients were diabetic for 5-10years, 23% of patients were with more than 10years of DM, and only 9% patients were newly diagnosed. With regards to blood grouping in the control group, maximum subjects were B(40%) followed by O(29%), A(22%) and AB(9%). Among diabetics, most of the patients in diabetic group were B(41%) followed by blood group O(26%), A(23%) and AB(10%). Comparison of distribution of different blood groups in non-diabetic and diabetic population was found to be similar in both the groups (Figure 1). Chi- square statistical analysis among different blood groups between non-diabetic (n=111) and diabetic population (N=276) no significant relationship of any blood group with type 2 DM was observed (p˃0.05). But relative risk (RR) were calculated in reference to blood group O, it has been observed that slight increase of risk of developing type 2 DM among AB(RR 1.075), A(1.044) and B(1.033) (Tables 1‒3). With regards to distribution of patients (in number) with type 2DM with different microvascular complications, Nephropathy was the most common complication observed among different blood groups (37.2% in B, 36.6% in O, 36.5% in A and 34.5% in AB) (Figure 2). Further exploring the association between specific blood groups in type 2 diabetes subjects and microvascular complications, no significant association observed with type 2 DM and neuropathy, nephropathy and retinopathy (p˃0.05). However, taking blood group O as a reference group, blood group AB (RR 0.583 and blood group A(RR0.698) were less likely to develop neuropathy compare to blood group O (Table 4). However no difference in relative risk found for development of nephropathy and retinopathy.
Blood group |
Non-diabetic(N=111) |
Diabetic(N=276) |
RR |
P Value |
A |
22 |
63 |
1.044 |
>0.05 |
B |
41 |
113 |
1.033 |
>0.05 |
AB |
9 |
29 |
1.075 |
>0.05 |
O |
29 |
71 |
Above values of RR are in reference |
|
Table 1 Relative Risk of Diabetes
Comment Chi square statistical analysis among different blood groups between non-diabetic(n=111) and diabetic population(N=276) no significant relationship of any blood group with type 2 DM was observed(p˃0.05). But relative risk(RR) were calculated in reference to blood group O, it has been observed that slight increase of risk of developing type 2 DM among AB( RR 1.075), A(1.044) and B(1.033)
Blood group |
Neuropathy |
Nephropathy |
Retinopathy |
A(N=63) |
13 |
23 |
13 |
B(N=113) |
32 |
42 |
23 |
AB(N=29) |
5 |
10 |
6 |
O(N=71) |
21 |
26 |
17 |
Table 2 Distribution of patients(in number) with type 2 DM with different microvascular complications
Blood group |
Neuropathy(%) |
Nephropathy(%) |
Retinopathy(%) |
A(N=63) |
20.6 |
36.5 |
20.6 |
B(N=113) |
28.3 |
37.2 |
20.4 |
AB(N=29) |
17.2 |
34.5 |
20.7 |
O(N=71) |
29.6 |
36.6 |
23.9 |
Table 3 ADistribution of patients(in percentage) with type 2 DM with different microvascular complications
Comment Nephropathy was the most common complication observed among different blood groups(37.2% in B, 36.6% in O, 36.5% in A and 34.5%in AB)
Association of neuropathy and blood group |
||||
|---|---|---|---|---|
Blood group |
Neuropathy(NO) |
Neuropathy(YES) |
P value |
RR |
A(N=63) |
50 |
13 |
>0.05 |
0.698 |
B(N=113) |
81 |
32 |
>0.05 |
0.957 |
AB(N=29) |
24 |
5 |
>0.05 |
0.583 |
O(N=71) |
50 |
21 |
>0.05 |
Above values of RR are in reference to Blood group “O” |
Table 4 Association of neuropathy and blood group
Comment Blood group AB(RR 0.583 and blood group A(RR0.698) were less likely to develop neuropathy compare to blood group O
Total 276 patients with type 2 DM were included in this study. Of those 276 diabetic patients 152 (55%) were male and 124 (45%) were female (Figure 3). 117 healthy control subjects among the relative of patients and volunteers were selected for this study to compare distribution of ABO blood groups. Age, sex and BMI of both the groups showed Figure 4 and Table 5. Mean age of diabetic patient was 50.46 (±10.38) and non-diabetic control subjects was 40.52 (±12.21). Mean BMI was 24.18 (±3.77) in diabetic subjects and was 25.40 (± 3.92) in control population. Distribution of study population according to BMI was described (Figure 5). Most of the population (48%) was in the normal BMI (18.5 to ˂25). Only 10% of population was in the obesity group (BMI˃30) and 5% of population was under low BMI group (˂18.5).
Parameter |
Control |
Test |
Age |
40.52±12.21 |
50.46±10.38 |
BMI |
25.40±3.92 |
24.18±3.77 |
Gender |
||
M |
79(71%) |
152(55%) |
F |
32(29%) |
124(45%) |
Table 5 Age, BMI and gender distribution in control and diabetic patients
Distribution of study population according to duration of type 2 DM has been shown Figure 6. Most of the patient were in ˂5years of duration (38%), 30% patients were diabetic for 5-10years, 23% of patients were with more than 10years of DM, and only 9% patients were newly diagnosed. Distribution of blood group has been shown in both non-diabetic and diabetic population Figures 7 & 8. Comparison has been described in Table 6 & Figure 1. Most of the patients in diabetic group were B(41%) followed by blood group O(26%), A(23%) and AB(10%). Similar trend also observed in control group i.e. maximum B (40%) followed by O(29%), A(22%) and AB(9%). This finding of higher frequency of blood group B in both diabetics and control groups (41% and 40% respectively) was similar to Jha S et al.,6 Sharma S et al.,7 Henry MU et al.,8 Egawa et al.9 When compared by Chi square statistical analysis among different blood groups between non-diabetic (n=111) and diabetic population (N=276) no significant relationship of any blood group with type 2 DM was observed (p ˃0.05). But relative risk (RR) were calculated in reference to blood group O, it has been observed that slight increase of risk of developing type 2 DM among AB(RR 1.075), A(1.044) and B(1.033).
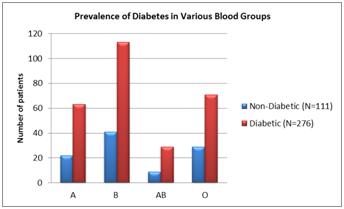
Figure 1 Prevalence of Diabetes in Various Blood Groups.
Comment Comparison of distribution of different blood groups in non-diabetic and diabetic population. It was similar both the groups.
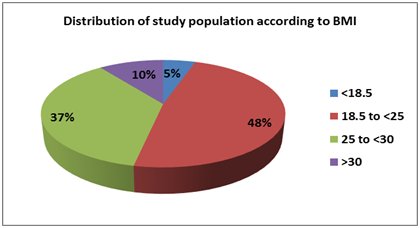
Figure 5 Distribution of study population according to BMI.
Comment Most of the population (48%) were in the normal BMI (18.5 to ˂25). Only 10% of population were in the obesity group (BMI˃30) and 5% of population were under low BMI group (˂18.5).
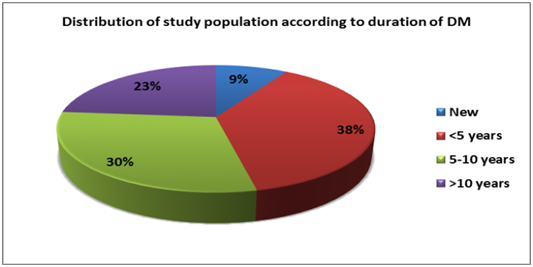
Figure 6 Distribution of study population according to duration of DM.
Comment Most of the patient were in ˂5years of duration (38%), 30% patients were diabetic for 5-10years, 23% of patients were with more than 10years of DM, and only 9% patients were newly diagnosed.
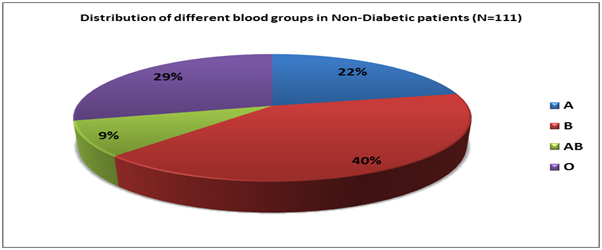
Figure 7 Distribution of different blood groups in Non-Diabetic patients.
Comment Maximum subjects were B (40%) followed by O (29%), A(22%) and AB(9%).
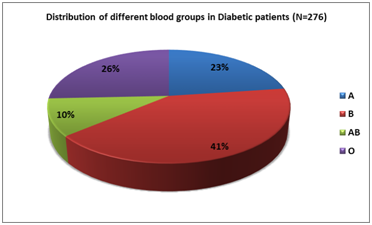
Figure 8 Distribution of different blood groups in Diabetic patients.
Comment Most of the patients in diabetic group were B(41%) followed by blood group O(26%), A(23%) and AB(10%).
Blood group |
% of Non-DM Subjects |
Prevalence(%) of DM |
A(N=63) |
22 |
23 |
B(N=113) |
40 |
41 |
AB(N=29) |
9 |
10 |
O(N=71) |
29 |
26 |
Table 6 Distribution of different blood groups in non-diabetic and diabetic population
Comment Similar distribution of blood group observed in both the groups
Prevalence of complications of diabetes mellitus in various blood groups has described in Figure 2. Nephropathy was the most common complication observed among different blood groups (37.2% in B, 36.6% in O, 36.5% in A and 34.5%in AB). Associations of different microvascular complications of type-2 DM with different blood group has been shown in Tables 7‒9. None of the microvascular complications were significantly associated with any blood groups (p ˃ 0.05). But when relative risk (RR) has been calculated with blood group O as reference it has been observed that blood group AB (RR 0.583) and blood group A (RR0.698) were less likely to develop neuropathy compare to blood group O shown in Table 4. This observation is first time noted through our present study. No reference is available as per our present knowledge. Association of nephropathy and retinopathy in different blood groups are similar in all blood group as shown in Tables 10 & 11. The present study shows that specific ABO blood groups are associated with an increased type 2 diabetes risk. Individuals with the O blood group were found to have the lowest risk of developing type 2 diabetes. Although the associations did not reach statistical significance. This finding is consistent with the observation of study conducted by Fagherazzi G et al.,21 in total 82,104 women from large prospective E3N cohort followed between 1990 and 2008. In their study they observed those with either the A (HR 1.10 [95% CI 1.02, 1.18]) or B (HR 1.35[95% CI 1.13, 1.60]) group were at increased risk of type2 DM compared with those with the O group. The greatest increase in risk was seen for those with the B+ blood group.
Association of neuropathy and blood group |
|||
|---|---|---|---|
Blood group |
Neuropath(NO) |
Neuropathy(YES) |
P value |
A(N=63) |
50 |
13 |
>0.05 |
B(N=113) |
81 |
32 |
>0.05 |
AB(N=29) |
24 |
5 |
>0.05 |
O(N=71) |
50 |
21 |
>0.05 |
Table 7 Association of neuropathy and blood group
Comment No significant association observed with type 2 DM and neuropathy(p˃0.05)
Association of nephropathy and blood group |
|||
|---|---|---|---|
Blood group |
Nephropathy(NO) |
Nephropathy(YES) |
P value |
A(N=63) |
40 |
23 |
>0.05 |
B(N=113) |
71 |
42 |
>0.05 |
AB(N=29) |
19 |
10 |
>0.05 |
O(N=71) |
45 |
26 |
>0.05 |
Table 8 Association of nephropathy and blood group
Comment Nephropathy was not significantly associated with type2 DM(p˃0.05)
Association of retinopathy and blood group |
|||
|---|---|---|---|
Blood group |
Retinopathy(NO) |
Retinopathy(YES) |
P value |
A(N=63) |
50 |
13 |
>0.05 |
B(N=113) |
90 |
23 |
>0.05 |
AB(N=29) |
23 |
6 |
>0.05 |
O(N=71) |
54 |
17 |
>0.05 |
Table 9 Association of retinopathy and blood group
Comment No significant association observed in between type2 DM and retinopathy(p˃0.05)
Association of nephropathy and blood group |
||||
|---|---|---|---|---|
Blood group |
Nephropathy(NO) |
Nephropathy(YES) |
P value |
RR |
A(N=63) |
40 |
23 |
>0.05 |
0.997 |
B(N=113) |
71 |
42 |
>0.05 |
1.015 |
AB(N=29) |
19 |
10 |
>0.05 |
0.942 |
O(N=71) |
45 |
26 |
>0.05 |
Above values of RR are in reference to Blood group “O” |
Table 10 Association of nephropathy and blood group
Comment Relative risk(RR) was similar in all the blood groups
Association of retinopathy and blood group |
||||
|---|---|---|---|---|
Blood group |
Retinopathy(NO) |
Retinopathy(YES) |
p Value |
RR |
A(N=63) |
50 |
13 |
>0.05 |
0.862 |
B(N=113) |
90 |
23 |
>0.05 |
0.85 |
AB(N=29) |
23 |
6 |
>0.05 |
0.864 |
O(N=71) |
54 |
17 |
>0.05 |
Above values of RR are in reference to Blood group “O” |
Table 11 Association of retinopathy and blood group
Comment Relative risk(RR) was similar in all the blood groups
They also observed a greater type 2 DM risk for those with AB+ group (HR 1.26[95% CI 1.02, 1.57]). They concluded that people with the O blood type have a lower risk of developing type 2 DM.21 In the study of Waseem AG et al.,3 blood group AB was more common in diabetics as compared to controls3. This is consistent with our study. Study conducted by Sidhu et al in their study, ABO and Rh blood groups in diabetes mellitus, observed that there is a strong indication of an association of diabetes mellitus with blood groups, especially with A, AB and Rh-positive blood groups. The maximum differences are in the AB groups in the two series and minimum in the A group.22 Another cross-sectional study reported results consistent with ours. A higher frequency of the B blood group was found in individuals in the type 2 diabetes group than in the general population, whereas a lower frequency of the O blood group was reported.23 Another study conducted by Muhammad K et al.,3 in their study of association of ABO blood groups with diabetes mellitus, they also showed that there was a negative association between ABO blood groups A and O with DM type 2, with A and O group having less chances of diabetes.24 Several reports have evaluated the possible relationship between diabetes mellitus and Rh blood group; however, the populations vary and the findings are inconsistent. Study conducted by Jha S et al.,25 found no association between the ABO blood group and DM. In a study which included 511 patients with type 2 DM and 454 healthy control subjects, it was concluded that there was no association between ABO blood groups and type 2DM.26 Similarly Zeytinoghu I and Maher showed no significant difference between controls and patients with diabetes mellitus.27 Berg K et al.,28 and Sharma S et al.,7 also could not find the association between DM and the ABO system. Rahman et al. reported in a study from Bangladesh with a sample size of 2,312 patients and 8,936 controls that there was no association between ABO blood groups and diabetes mellitus.17 The possible explanation of these conflicting findings may be the racial and geographical factors that probably have a role in genetic expression of disease. The mechanisms underlying the observed association in our study are unknown. It has been suggested that the human ABO locus might influence endothelial or inflammation markers, such as the factor VIII–von Willebrand factor (vWF) complex, which is present in higher levels in non-O individual.29 In addition, the ABO blood groups have been associated with plasma soluble intercellular adhesion molecule 1 (ICAM-1) and TNF receptor 2 (TNF-R2) levels.30 These markers have both been associated with an increased type 2 diabetes risk, thus providing a potential explanation for the observed relationships.31,32 Finally, a recent paper suggested that the ABO blood group is one of the genetically determined host factors that modulate the composition of the intestinal microbiota33 which participates in metabolism by affecting the energy balance, glucose metabolism and low-grade inflammation.34
We found that person with O+ve blood group has least chance of developing Type 2 DM whereas subject with AB+ve blood group are more vulnerable to develop Type 2 DM. Therefore, the effects of blood groups should be investigated in future clinical and epidemiological studies on diabetes. Further pathophysiological research is also needed to determine why the individuals with blood type O have a lower risk of type 2 diabetes. No significant relationship with any microvascular complication of Type 2DM and any blood group is observed. Blood group AB+ and A+ are less likely to develop neuropathy compare to O+. As type 2 DM has posed challenging and formidable problem globally lots of scientific research work have been targeted and concepts are evolving every other day to unleash newer etiological factor in its causation and side by side risk factors so that proper aggressive strategy can be instituted to contain the disease at the very outset. Keeping these ideas in the back of our mind we embarked upon this small but compact path finding study. However within our constraint of resources for recruiting large number of subjects we feel that as the result are not illusive but quit encouraging in future large prospective longitudinal studies will be needed to substantiate our observation to further shed light on this avenue hitherto under explored.
There are few limitations of this study also:
None.
Author declares that there is no conflict of interest.

©2018 Mandal, et al. This is an open access article distributed under the terms of the, which permits unrestricted use, distribution, and build upon your work non-commercially.