Journal of
eISSN: 2378-3184


Research Article Volume 2 Issue 1
University of New Haven West Haven, USA
Correspondence: O Kristen M Schmicker, University of New Haven West Haven, USA
Received: January 12, 2015 | Published: January 28, 2015
Citation: Schmicker KM (2015) Humpback Whale (Megaptera novaeangliae) Distribution On Stellwagen Bank (New England, MA, USA). J Aquac Mar Biol 2(1): 00012. DOI: 10.15406/jamb.2015.02.00014
Humpback whales (Megaptera novaeangliae) are found in all oceans and complete one of the longest migrations of any mammal. Their movements in their feeding ground areas are difficult to track and therefore are largely unknown. This study used data from Whale and Dolphin Conservation (WDC) and Ocean Biogeographic Information System (OBIS) to map the movements of humpback whales for the year 2011 as well as between the decades of the 1980s, 1990s, 2000s, and for 2010-2012. GIS maps of humpback whale sightings from these data sets showed patterns of seasonal movement as well as high use areas. The distributions of the humpbacks in all four decades showed two concentrated areas where the whales were sighted more often: north of Cape Cod, in the Stellwagen Bank National Marine Sanctuary and to the southeast of Cape Cod. The percentages of humpbacks over different types of benthic substrate were also calculated and statistically analyzed using a Chi-square. The relationship between the number of sightings and the type of substrate was determined to be significant for the spring and summer months. The whales were more likely to be found over sandy substrate in the spring and summer. This is most likely because the schooling fish that they eat are most likely to be in those areas. However, this relationship did not hold for the fall months and this is likely because their prey has moved over a different substrate. These results agreed with those of NOAA’s study of the same area.
Keywords: Cape Cod, Distribution, GIS, Humpback whale, Stellwagen Bank, Substrate
Humpback whales1 are a cosmopolitan species, found in all oceans and most commonly sighted in coastal shelf waters.2 They complete one of the longest migrations of any mammal, nearly 8,000 kilometers.3 Their large scale migration routes are relatively well known, however, their movements within their feeding ground areas are not. The movements of humpback whales are difficult to study because they are only at the surface for short periods of time. This becomes a problem for recreational boaters and fishermen because ship strikes and entanglements become common when the whales are difficult to locate. The Gulf of Maine has a large amount of boating, fishing, and whale watching activity. Predicting high density areas of humpback whales at a given point in the season can be helpful for fishermen and shipping vessels to avoid them and for whale watching boats to find them. The purpose of this study is to explore mapping and developing a predictive model for humpback whale distribution in the Cape Cod region including the southern portion of the Gulf of Maine (Figure 1).
Humpbacks are easily distinguished from other baleen whale species due to their long, white pectoral flippers.4,5 These appendages are approximately 1/3 of the total length of the animal, with protuberances on the leading edges making them hydrodynamic.5 Other defining characteristics are the tubercles on their upper and lower jaws and the serrations on the edge of their flukes.6 Their jaws contain anywhere from 270 to 400 baleen plates on each side; the color of these plates can range from all black to a dull white.5 The dorsal side of a humpback whales fluke is all black, but the ventral side can range from white to black with variations in between.7 The pattern on the ventral side is unique to each whale and can be used to identify individual whales.6 The varying shapes and sizes of the dorsal fin can also be used for identification purposes, as well as the black and white patterns on the ventral side of the pectoral flippers.4,5
Humpback whales reach sexual maturity at about 5 years and physical maturity between 8 and 12 years.6 The interval at which they give birth is 2.4 years8 and the gestation period can range 11 to 12 months.9 Humpback whales are generally found in shallow waters, usually 100-200 meters. Only during migrations do they travel out into the deeper ocean basins.6 During the spring, summer, and fall they can be found in temperate northern waters, where their main activity is feeding.10,11 In the North Atlantic, the humpback whale feeding grounds extend from the east coast of the U.S. to western Greenland, including waters off Iceland, northern Norway, and Svalbard.12,13 North Atlantic Humpback whale feeding ground fidelity is determined matrilineally; they return to feed in the same waters that their mothers brought them to as calves.14
The population of humpback whales in the Gulf of Maine has been separated from other North Atlantic feeding stocks because of their strong fidelity, or re-sighting, to the area. The total population in the Gulf of Maine is estimated at 10,600 individuals and is steadily increasing at about 6.5% per year.14 The Gulf of Maine encompasses the waters north of Cape Cod, Massachusetts, and south of Cape Sable, Nova Scotia, including the Bay of Fundy and Massachusetts Bay. Within the Gulf of Maine is Stellwagen Bank National Marine Sanctuary. The Stellwagen Bank National Marine Sanctuary was designated in 1992, covers 2,181 km2 and extends from Cape Ann to Cape Cod on the east coast of the United States.15
Studies performed on the North Atlantic humpback population have determined that species distribution in New England waters is heavily dependent on the prey species abundance as well as the topography of the sea floor.14 In the late 1970s and early 1980s, humpback whales were found to be densest over sandy shoals in the southwestern area of the Gulf of Maine. This was due to a high abundance of sand lance and low abundances of herring and mackerel in the area.
The relationships between the environment and cetaceans can be useful in many ways including identifying highly used areas and predicting shifts that may be associated with environmental change.16,17 Cetaceans can also be used as bio indicators of the health and productivity of the ecosystem because of their site fidelity, low fecundity and dependence on specific types of prey.18,19
A study was performed by the National Oceanic and Atmospheric Administration (NOAA) published in 2006 on all of the marine resources in the Stellwagen Bank National Marine Sanctuary/Gulf of Maine area. As a part of NOAA’s study, the abundances of several cetaceans, including humpback whales, were mapped and interpreted seasonally. Several environmental variables were also studied seasonally including sea surface temperature, bathymetry, and prey densities. In the Southern Gulf of Maine, NOAA found that the densities of cetaceans followed those of their preferred prey: Atlantic herring, northern sand lance, and Atlantic mackerel. These types of fish are planktivores and are therefore linked to the distributions of phytoplankton and zooplankton.15 The abundance of these types of prey fish can depend on several other factors such as changes in water depth and bathymetric features with high relief that influences water movements like upwelling increasing nutrient availability.20 As a result, cetacean movements can be explained by similar features.21,22
Predictive modeling was also used as a part of the study, which included identifying environmental factors that were most influential in determining the distribution and relative abundance of cetacean species. It was determined that the static, or unchanging, environmental conditions were more ideal for determining and predicting cetacean areas of use than dynamic, or changing, conditions. Areas of 100 meter depth (along the 100 meter isobath) and the continental shelf edge were two static conditions that showed strong correlations to areas where cetaceans could be found.
Other high use areas of humpback whales were found by NOAA to be on sandy banks and gravelly sand ledges along the 100 meter isobath with the exception of Stellwagen Bank in which the entire area is used in the summer and fall. NOAA also found a strong positive linear relationship between the distribution of humpbacks in the spring and summer and the total sand lance abundance and its habitat in sand or gravelly sand. Sand lance abundance wasn’t found to be a perfect predictor of humpback movement, however. Some humpbacks were found in areas low in sand lance abundance because those areas had the potential for sand lance to be present; i.e. areas of sand or gravelly sand bottom type. The patterns of sand lance abundance can change from year to year or month to month, but the bottom type remains relatively unchanged. This creates a correlation that can be used as a predictive model between humpback whale distribution and bottom type.15
WDC Whale Watch Data
Observational data was collected from two commercial whale watching vessel companies: Captain John Boats out of Plymouth, MA, USA and Hyannis Whale Watching Cruises out of Barnstable, MA, USA. From April to June and September to October trips ran once a day and from July to August trips ran twice a day. The whale watching trips ran from 3 ½ to 4 hours. At the start of each trip when the boat was leaving Plymouth Bay or Barnstable Harbor the GPS was turned on to begin a track line.
Once the boat was in an area with whales present, weather conditions were recorded and a time and GPS latitude and longitude were recorded to open the sighting. If a group of whales was being observed, the minimum and maximum numbers of whales in the group were recorded since the exact number could sometimes not be obtained due to sea conditions. When the boat left or the whale(s) or the members of the group changed, another time and location were recorded to close the sighting; another sighting was opened if need be. If a whale changed groups or was re-sighted later in the trip than the number of the sighting it was previously seen in was recorded. If a whale(s) was/were observed from afar then the bearing and approximate distance were recorded. Any behaviors that the whales display were noted such as open mouth feeding, flipper slapping, lob-tailing or breaching. The whales were identified using the unique pattern on the ventral side of their fluke or the shape and size of their dorsal fin and their names were recorded. Other observational notes were recorded as well, such as whether or not the whale was seen with a calf or if any new scarring was visible. This data was compiled by the Whale and Dolphin Conservation (WDC) North America branch based in Plymouth, MA, USA. The data analyzed included weather and sightings data for the months of April to October for 2011.
The whale watch data was split up by season in Microsoft Excel spreadsheets and cleaned up before it was mapped. Spring included sightings from April and May, summer included June, July, and August, and fall included September and October. These groupings were chosen because they were the same as the ones used in the NOAA study for easy comparison. Any sightings that were missing a starting or ending latitude and longitude were deleted. Sightings that were not of animals such as trash or boats were also deleted. Sightings of whales that were seen at a distance of at least a quarter mile were deleted as well to avoid inaccurate sighting locations. Each sighting was given a unique identification consisting of the name of the vessel, the date, the trip start time and the sighting number to differentiate the data points. Spaces and special characters were removed from the headings so the data could be processed by the Arc GIS software. The formatting of the cells was double checked to make sure it was uniform. All of the cells in the ‘Date’ column were formatted as dates; the cells in the ‘Trip Start Time,’ ‘Time Start,’ and ‘Time End’ columns were formatted as military times; and the latitude and longitude columns were formatted as numbers with six decimal places. All of the longitude data points were made negative so that they were mapped in the Western Hemisphere.
OBIS Whale Sighting Data
Ocean Biogeographic Information System (OBIS) Sea Map humpback sightings data was downloaded from the Marine Geospatial Ecology Lab in the Nicolas School of the Environment at Duke University to be analyzed.23 This data was broken up into decades to observe humpback movements over a period of several years. The data began in 1980 because this was shortly after the Marine Mammal Protection Act (MMPA) was put into action; much more data was collected with the increased awareness. This data included the 1980s, 1990s, 2000s, and 2010-2012. The OBIS data was also broken into seasons like the 2011 WDC data.
GIS Methods
GIS mapping and geographic analysis was accomplished using Arc GIS V10.0. The geographic datum that was used was GCS_North_American_1983_CSRS and the coordinate system that was used was NAD_1983_StatePlane_Massachusetts_Mainland. The data layers for the Massachusetts outline, bathymetry, and bottom type and their sources can be seen in Table 1. The Excel spreadsheets of WDC data were imported as X-Y layers but the OBIS data was downloaded as Arc GIS-compatible shape files. A WDC data layer was made of a selection of only the humpback sightings for each season by using a selection query. The OBIS data did not require a selection to be made since the data only included humpback whale sightings. Spatial joins were performed with the substrate data and the WDC and OBIS data so that each sighting was paired up with the type of substrate it was over. The substrates in the sediment data layer included: bedrock, gravel, gravel-sand, sand, clay-silt/sand, sand/silt/clay, sand-clay/silt, sand-silt/clay, and clay; for a few sightings the substrate was unknown. Maps were created for 2011 and each decade with each season in a different color over the bathymetry of the area. The substrate data was also analyzed by counting the number of sightings over each substrate type and calculating the percentage of each. A Chi-square statistical analysis was performed to determine if there was any correlation between the number of whale sightings and the type of substrate.
|
Data Layer |
Source |
|
Massachusetts Bathymetry |
Mass GIS (mass.gov/anf/research-and-tech/it-serv-and-support/application-serv/office-of-geographic-information-massgis/datalayers/bathymetry-for-massachusetts.html) |
|
Massachusetts Outline Arcs 100 K Coast |
Oliver Mass GIS (maps.massgis.state.ma.us/map_ol/oliver.php) |
|
Sediment Areas |
U.S. Geologic Survey Continental Margin Mapping (CONMAP) sediments grain size distribution for the United States East Coast Continental Margin |
|
Stellwagen Bank Sanctuary |
National Marine Sanctuary Geographic Information System Data |
Table 1 Data layers and sources used in GIS mapping
The data from WDC for all three seasons showed that the whales were clustered around the southern portion of the Stellwagen Bank National Marine Sanctuary. The number of sightings in the spring was much lower than in the summer and fall. In the summer there were also sightings spread out to the west and south of Cape Cod. The fall 2011 data shows sightings more spread out towards the northern end of Stellwagen Bank and also more towards the mouth of Cape Cod Bay (Figure 2).
The OBIS Sea map data for the 1980s showed two general areas that humpbacks were sighted in for all seasons: spread out over Stellwagen Bank, and to the southeast of Cape Cod. There were also sightings scattered north of the sanctuary and to the south west of Massachusetts (Figure 3).
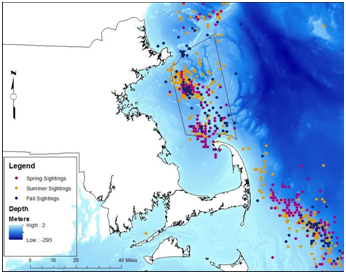
Figure 3 OBIS Sea map humpback whale sightings for spring, summer, and fall 1980s and ocean bathymetry.
The sightings from the OBIS data for the spring of the 1990s were also localized in two areas: Stellwagen bank, and to the southeast of Cape Cod. There were fewer sightings than in the 1980s. Most of the spring sightings were south east of Cape Cod and most of the summer and fall sightings were in the center of Stellwagen Bank (Figure 4).
There were many more sightings in the 2000s than in the 1990s and these sightings were generally very spread out. Sightings from all three seasons were concentrated in the southern portion of the sanctuary, directly north of Cape Cod, but there were more sightings in the fall than in the spring and summer in this area. Humpbacks also were sighted to the south east of Cape Cod in all three seasons, but more often in spring and summer than in fall (Figure 5).
In 2010-2012, humpbacks were sighted in all three seasons in the same two general areas as in previous decades: north of Cape Cod, and southeast of Cape Cod. The whales were sighted farther north in the sanctuary in the summer and further to the southeast in the fall (Figure 6). The number of summer sightings also vastly outnumbered the spring and fall sightings.
In the spring of 2011, 90% of humpback whale sightings were over sandy substrate with the remaining sightings over gravel-sand, clay-silt/sand, and sand-clay/silt with less than 3% over each. In the summer, 90% of the sightings were also over sandy substrate with less than 2% each over gravel-sand and sand-silt/clay. By the fall, only 65% of humpback whale sightings were over sand with 7.7% over gravel-sand (Figure 7).
In the spring of the 1980s, 63.5% of sighted humpback whales were over sand; 15% over clay-silt/sand, and 13% over gravel-sand. By the summer of the1980s, 45.5% of sightings were over sand, 17% over gravel-sand, and 13.7% over clay-silt/sand. In the fall, 56% of humpback whale sightings were over sand and 22% were over gravel-sand (Figure 8).
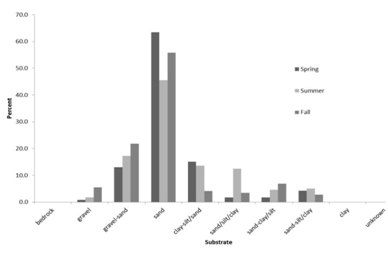
Figure 8 Percentages of humpback whale sightings over various substrates for the 1980s from OBIS sea map d.
In the spring of the 1990s, 84% of the humpback whale sightings were over sandy substrate, and 10% were over clay-silt/sand substrate. By the summer, only 55% of sightings were over sand, 14% over gravel-sand, and 10% over clay-silt/sand (Figure 9). In the fall of the 1990s, 50% of sightings were over sand and 17% over each gravel-sand and sand-silt/clay.
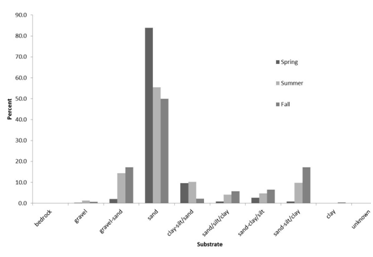
Figure 9 Percentages of humpback whale sightings over various substrates for the 1990s from OBIS sea map d.
In the spring of the 2000s, almost 50% of sightings were over sand with 16% over clay-silt/sand and 23% over gravel-sand. In summer, 55% of sightings were over sand, 17% over gravel-sand, 12% over sand-silt/clay, and 9.5% over clay-silt/sand. By the fall, only 47% of humpback sightings were over sand, 12% over grave-sand, and 10% over clay-silt/sand (Figure 10).
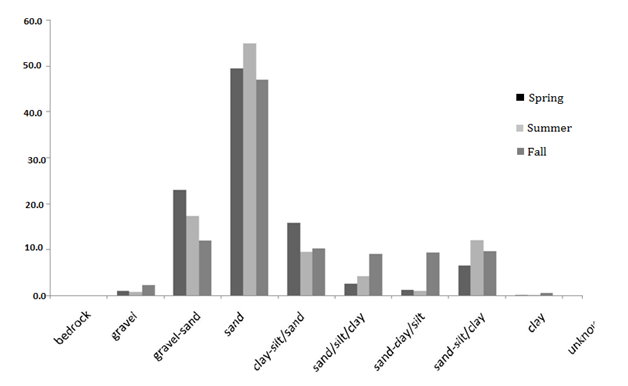
Figure 10 Percentages of humpback whale sightings over various substrates for the 2000s from BIS sea map.
The data for the spring of 2010-2012 showed that almost 71% of humpback whale sightings were over sand, 19.5% were over gravel-sand, and only 5.5% were over clay-silt/sand. In the summer, almost 76% of sightings were over sand, only 7% over gravel-sand and only 6.4% over sand-clay/silt. By the fall 70% of humpback sightings were over sand and 24% over gravel-sand (Figure 11).
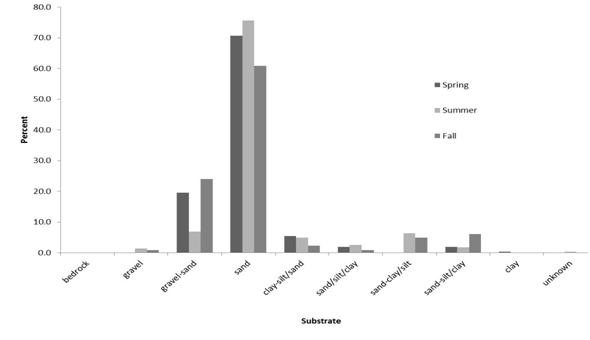
Figure 11 Percentage of humpback whale sightings over various substrates for 2010-2012 from OBIS sea map.
A Chi-Square analysis was run on all of the counts for humpback sightings over the various types of substrate and the calculated p-value was <0.01 (Table 2). A Chi-square analysis was also run on the 2011 data and each decade of the OBIS data individually and the p-value was also <0.01.
|
|
Value |
df |
Asymp. Sig. (2-sided) |
|
Pearson Chi-Square |
3441.313a |
126 |
.000 |
|
Likelihood Ratio |
3632.695 |
126 |
.000 |
|
N of Valid Cases |
10447 |
|
|
Table 2 Chi-Square Test on Substrate Data
48 cells (32.0%) have expected count less than 5. The minimum expected count is .01.
The data from 2011 was used to observe humpback whale movements in the Stellwagen Bank area throughout the course of that year. There were fewer sightings in the spring most likely because many of the whales have not moved into the area yet. All three seasons had sightings concentrated in the southern portion of the Stellwagen Bank National Marine sanctuary; this occurred because of the limited distance that whale watching vessels can travel in the time frame of a single trip. In the fall, the whales had spread out to cover more of the bank, most likely in search of food. The 2011 data is incompatible with the OBIS data because it represents a single year and it was collected by whale watching vessels going out specifically to where the whales were known to be as opposed to covering the entire body of water in a more randomized manner.
The maps of the 1980s, 1990s, 2000s, and for 2010-2012 all showed more frequent humpback whale sightings north of Cape Cod in the Stellwagen National Marine Sanctuary and to the southwest of Cape Cod. The whales were seen more frequently in these areas most likely because they are shallower areas. There is possibly upwelling occurring from the deeper water to the east bringing up nutrients that increases the plankton abundance. This then brings in more schooling fish to the area, which are the humpbacks’ prey of choice. There were differences between the decades, however. In the 1980s, there seemed to be an even number of sightings in the spring, summer and fall and the sightings of all three seasons were relatively evenly spread out in the two areas. This shows that the whales were just as likely to be found in these areas in spring, summer, and fall months. In the 1990s, there were more spring sightings southeast of Cape Cod than on Stellwagen Bank; this could mean that in these years, the whales waited until later in the year to migrate north so they weren’t in the sanctuary until the summer or fall. There were a few sightings in summer and fall in the southeast showing that some whales stayed in that area to feed instead of moving farther north.
The humpback distribution for the 2000s was much more like the 1980s than the 1990s because sightings from all seasons were relatively evenly distributed in the two high use areas. In general, there were more spring and summer sightings in the southeast, likely because the whales were still in the process of migrating up and more sightings in the sanctuary in the fall because more whales had moved into the area. In this decade there were also more scattered sightings outside of the two common areas than in the previous decades. For the years 2010 to 2012, summer sightings dominated the distribution indicating that there were either more whales in the area in the summer than in the spring and fall, or the whales were easier to find during that time. Also during the fall, there was a cluster of sightings further to the southeast than the other sightings. This may indicate that the whales moved back down to this area to feed or they were on their way to migrate back south.
Patterns of humpback whale movement can also be seen in the types of substrate they were sighted over. In 2011, the percentages of sightings over the different substrates in the spring and summer were very similar and in the fall there was a large difference. In all three seasons, however, the highest percentage of sightings was still over sand. This supports the results of NOAA’s study that humpbacks tend to be found over sandy or gravel-sand substrate because this is where their prey, Atlantic sand lance, is most likely to be found.15 The p-value for the 2011 data was less than 0.05 which indicates that there is a significant relationship between the number of whales and the type of substrate they are sighted over.
The OBIS substrate data showed much less variation between seasons than the 2011 WDC data. For all decades, the sandy substrate had the highest percentage in all seasons. The 1980s and 1990s showed a large decrease over sand in the summer possibly because of movements in the whales’ food source. In the 2000s and 2010-2012, the percentages were relatively the same in spring and summer; this could be because the fish the whales were eating stayed in those areas longer. The distribution of the humpback whales in spring months is similar between the decades. The whales are clustered southeast of the cape and directly north of the tip of the cape in each decade. In summer months, there was a much larger concentration on the bank in 2010-2012 than the other decades. The whales were also scattered more in the 2000s, and there were fewer recorded sightings in the 1980s and 1990s. In fall months, the majority of the whales could be found north of the cape, except for 2010-2012, when most of the whales were to the southeast (Figures 3,5,7,9).
There was quite a large variation in the percentages of whales over sandy substrate for the spring months, but in each case it was the highest percentage. There was also variation in the percentages of whales over sandy substrate in the summer months, but these percentages were also the largest, agreeing with NOAA’s findings. The fall months had the lowest percentages over sandy substrate, but they were also the largest percentage in their respective decade. (Figures 4,6,8,10) The Chi-square analysis of this data showed a very low p-value indicating that the number of whales and the type of substrate they were sighted over are related.
This study showed two areas highly used by humpback whales: north of Cape Cod, in the Stellwagen Bank National Marine Sanctuary, and to the southeast of Cape Cod. These areas have shallow bathymetry so there are possibly upwelling bringing nutrients up into the water column.
The maps also determined that there was a significant relationship between the number of humpback whale sightings and the type of substrate they were sighted over for the spring and summer months. In the spring and summer, the humpbacks are more likely to be over sand and gravelly sand substrate. This relationship does not hold for the fall most likely because the schooling fish that the whales are eating have moved and they are searching in areas over different substrate types.15 Substrate types, specifically sandy substrate, can then be used to predict the locations of whales in the spring and summer (Figure 12). Several other environmental factors such as sea surface temperature, chlorophyll concentration, and water depth, can also have an impact on the humpbacks’ movements and can be looked into in future studies.
Boaters and fishermen can be informed to avoid the areas north of Cape Cod on Stellwagen Bank National Marine Sanctuary, and to the southeast of Cape Cod, as well as areas with sandy substrate and whale watching vessels will have a better chance of finding whales in those areas throughout the humpback whale feeding season.
I would like to thank Dr. Paul Bartholomew for his mentorship, helping me to map my data, and assistance in editing my paper. I would also like to thank Sue Rocca and everyone at Whale and Dolphin Conservation for the opportunity to study whales over the summer and for allowing me to use their data in my project.
None.

©2015 Schmicker. This is an open access article distributed under the terms of the, which permits unrestricted use, distribution, and build upon your work non-commercially.