International Journal of
eISSN: 2475-5559


Review Article Volume 4 Issue 4
1State Key Laboratory of Oil and Gas Geology and Exploitation, Southwest Petroleum University, China
2School of Geoscience and Technology, Southwest Petroleum University, China
3Key Laboratory of Carbonate Reservoirs, CNPC, China
4PetroChina Hangzhou Research Institute of Geology, China
5Research Center for Basin and Reservoir, China Petroleum University at Beijing, China
6Wuxi Geology Research Institute of Petroleum Exploration and Development, China
7Department of Agronomy, Institute of Crop Science, Zhejiang University, China
Correspondence: Tan Xiucheng, State Key Laboratory of Oil and Gas Geology and Exploitation, Southwest Petroleum University, Chengdu, 610500, School of Geoscience and Technology, Southwest Petroleum University, Key Laboratory of Carbonate Reservoirs, CNPC, China
Received: February 09, 2018 | Published: August 27, 2019
Citation: Xiaofang W, Xiucheng T, Shaonan Z, et al. The application of illite crystallinity(IC) to reconstruct thermal history of the marine carbonates: a case study from northeast Sichuan basin, southwest China. Int J Petrochem Sci Eng. 2017;4(4):147-152. DOI: 10.15406/ipcse.2019.04.00114
Paleogeothermometer is one of the uppermost parameters of the reconstruction of thermal history in sedimentary basins. Because there is no suitable paleogeothermometer in the Lower Palaeozoic sequences which are composed of highly and excessively mature carbonates, the reconstruction of thermal history and hydrocarbon generation history is a problem impeding the pace of petroleum exploration of the marine carbonates in China all the time. This paper aims at researching the possibility of illite crystallinity(IC) as the paleogeothermometer of marine carbonates. By thermal simulation experiments, the quantitative relationship between illite crystallinity(IC) and vitrinite reflectance (Ro) has been established and applied to the reconstruction of thermal history in Northeast Sichuan Basin. The result of simulation experiments shows that in Northeast Sichuan Basin, the value of paleoheat flow was 53.5mW/m2 at Middle Silurian which increased gradually from Middle Silurian to Late Permian, and from the beginning of Late Permian it went up to the maximum abruptly (65.3mW/m2). After that it dramatically decreased, reaching 50.3mW/m2 at Early Triassic. The value of paleoheat flow decreased gradually up to 44mW/m2.
Keywords: carbonates, illite crystallinity, paleogeothermometer, thermal history, Sichuan basin, China
In China, Palaeozoic carbonate sequences distribute extensively, which have undergone many stages of uplifting and sinking and are mostly found in excessively mature condition. Because of the complexity of thermal history and lack of effective paleogeothermometer, it is difficult to reconstruct the thermal history, which makes it difficult to evaluate the hydrocarbon generation history of hydrocarbon source rocks and impedes the pace of petroleum exploration. At home and abroad, the current paleogeothermometers which are used to study the thermal history of carbonates are mainly of two kinds:
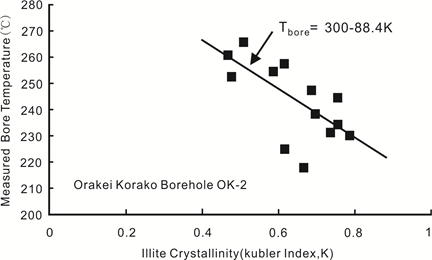
Illite crystallinity is often employed to study the diagenesis of clastics and has been recently used to study the paleogeotemperature (Figure 1).40‒43

Figure 1 Crystallinity (Kübler Indices, °Δ2θ) of air-dried illite (001) reflections plotted against measured bore temperature (Tbore) in Orakeikorako Drillholes OK-2 (Bignall et al., 2001).
The temperature is the uppermost factor affecting the illite crystallinity.44 At present, some scholars study the relationship between temperature and vitrinite reflectance (Ro) according to mineral crystallinity,8,45‒50 but Kübler index and Weber index are used most commonly.51 Hara et al.,52 demonstrate illite crystallinity (IC) as the most effective paleogeothermometer.
Illite crystallinity (IC) is a comprehensive function of cystal size, structure expansion degree, crystal defects and heterogeneity of chemical composition of illite. It depends on the environmental temperature, pressure, lithologic character, content of potassium ion and formation time, among which temperature is the most important factor.53 The illite crystallinity, authigenic during the diagenesis of argillaceous sediments, increases (but it’s value decreases) irreversibly as the increasing diagenesis and temperature. Hence, it could indirectly indicate the degree of thermal evolution. The half width of 001 diffraction peak of illite narrows as increasing depth, because the gradual growth of illite cystalls makes inter crystalline diffraction effect fade gradually. When the illite crystals grow up to some degree, inter crystalline diffraction effect vanishes completely.54
All samples were collected from Es4 mudstone of Well W161 in the Shengli Oilfield whose depth is 1909m, and the original vitrinite reflectance (Ro) was found to be 0.32%.
These thermal simulation experiments follow the scheme of hydrocarbon- generating experiments of source rocks (see Chart 1). The samples were consistent in weight (i.e., 85g). Room temperature in the beginning of experiment was 10℃,and increased at the rate of 1℃/min. After the thermal simulation experiments, samples were divided into two parts;
|
Sample number |
Design temperature(℃) |
Time of temperature increase(min) |
Time of temperature keeping(h) |
|
W161-150 |
150 |
140 |
24 |
|
W161-200 |
200 |
190 |
24 |
|
W161-250 |
250 |
240 |
24 |
|
W161-300 |
300 |
290 |
24 |
|
W161-350 |
350 |
340 |
24 |
|
W161-400 |
400 |
390 |
24 |
|
W161-450 |
450 |
440 |
24 |
|
W161-500 |
500 |
490 |
24 |
|
W161-550 |
550 |
540 |
24 |
Chart 1 Thermal simulation experiment scheme of illite.
This research mainly includes authigenic illite crystallinity. The crystal size of authigenic illite is smaller than that of clastic illite.55 The former is less than 2µm and the later is more than 2µm. So authigenic illite could be separated from clastic illite by precipitation siphoning or centrifugation and further used for the measurement of illite crystallinity.
The test result of illite crystallinity (IC) and vitrinite reflectance (Ro) of original sample and simulation sample after thermal simulation experiments are demonstrated in Chart 2.
|
Sample number |
Simulation temperature(℃) |
illite crystallinity(IC) |
Vitrinite reflectance (Ro) (%) |
|
W161-0 |
Original sample |
0.83 |
0.32 |
|
W161-150 |
150 |
0.6 |
0.32 |
|
W161-200 |
200 |
0.6 |
0.33 |
|
W161-250 |
250 |
0.49 |
0.48 |
|
W161-300 |
300 |
0.48 |
0.7 |
|
W161-350 |
350 |
0.43 |
0.92 |
|
W161-400 |
400 |
0.35 |
1.95 |
|
W161-450 |
450 |
0.36 |
2.6 |
|
W161-500 |
500 |
0.26 |
3.51 |
|
W161-550 |
550 |
0.25 |
3.94 |
Chart 2 The test result after thermal simulation experiments.
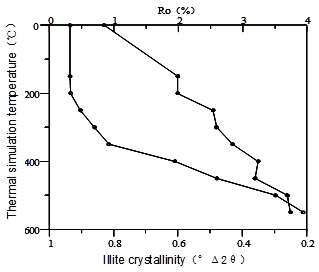
A linear correlation could be seen between illite crystallinity (IC) and simulation temperature (T) in (Figure 1), where illite crystallinity (IC) decreased gradually with the increase of simulation temperature. Figure 2 shows the relationship between illite crystallinity (IC) and vitrinite reflectance (Ro) as a logarithmic function (correlation factor: 0.8197): IC = -0.1582ln (Ro) + 0.4601 (2-1)
But during thermal simulation experiments, the variation trend of vitrinite reflectance (Ro) was found to differ from that of illite crystallinity (IC) with the increase in temperature (Figure 4). The value of illite crystallinity (IC) reduced linearly with the increase of thermal simulation temperature, while the value of vitrinite reflectance (Ro) elevated in a non-linear fashion. Illite starts to react at low temperature because it is a kind of inorganic mineral and it’s reaction mechanism is distinct. Illite crystallinity (IC) of original sample is 0.83, which decreased down to 0.60 at 150℃ (Figure 3).

Figure 4 The relationship between thermal simulation temperature and illite crystallinity or vitrinite reflectance.
The phenomenon which accounts for the decrease could be explained in a way when smectite changes to dehydrate, it transforms to illite at some temperature below 150℃. Oppositely, vitrinite belongs to organic constituent, which doesn’t change apparently until the temperature goes up to 300℃ and above. This phenomenon means that vitrinite can begin to react at 250~300℃ (see Chart 2). Vitrinite reflectance (Ro) increased linearly after thermal simulation temperature ascended up to 300℃ and above (Figure 4).
Thus, the relationship between illite crystallinity (IC) and vitrinite reflectance (Ro) could be established at high temperature conditions (more than 300℃, namely after the value of vitrinite reflectance (Ro) changed obviously (Figure 5). The relationship between them is linear and correlation factor is 0.9455. IC = -0.06656Ro + 0.50609 (2-2).
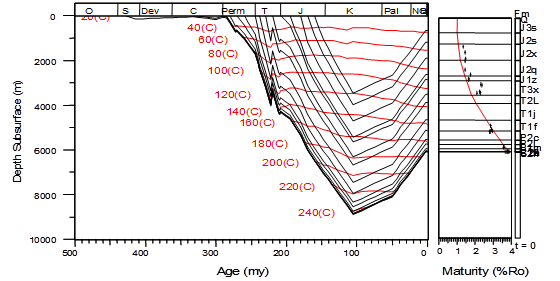
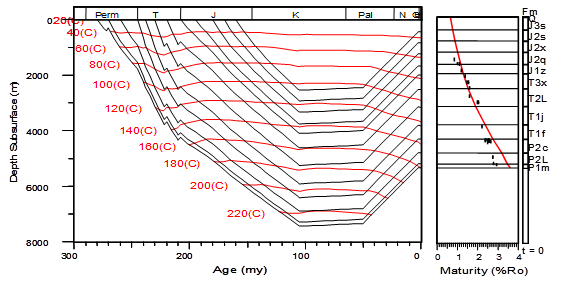
Our research paper included actual illite crystallinity (IC) data of cores and cuttings of deep well PG5, MB3, HB1(Figure 6) in Northeast Sichuan Basin, which were conversed to vitrinite reflectance (Ro) according to formula 2-2 and combined with actual vitrinite reflectance (Ro) data of other well depth to reconstruct thermal history of single well. Puguang structure is an nose-like structure of Shuangshimiao-Puguang NE anticlinal belt of Huangjinkou tectonic zone of Eastern Sichuan bruchfaltung in Sichuan Basin. Well PG5, belongs to Southeast Puguang structure of Shuangshimiao-Puguang anticlinal belt and is an important appraisal well, drilled deep to Hanjiadian Formation, middle Silurian (Figure 7). Well MB3, located at the northern eminence of Maobachang structure of Maobachang-Shuangmiao anticlinal belt of Huangjinkou tectonic zone of Eastern Sichuan bruchfaltung, is also an important appraisal well, drilled deep to Maokou Formation, lower Permian, Palaeozoic (Figure 8).

Figure 7 Deposition-burial history and thermal history of well PG5
(Remark: The right picture is the comparison between actual or conversed vitrinite reflectance value (black dots) and simulation-calculated value (full curve))

Figure 8 Deposition-burial history and thermal history of well MB3.
(Remark: The right picture is the comparison between actual or conversed vitrinite reflectance value (black dots) and simulation-calculated value (full curve)).
Thirteen typical wells were simulated in this research recorded as PG5, HB1, PG1, PG2, PG6, PG8, SM1, MB1, MB3, YB1, CF82, CF85 and CY84. In this research thermal history was expressed by heat flow, which equals to the product of thermal conductivity times geothermal gradient. In the light of simulated results of thirteen typical well, thermal evolution features of research area has been found (Figure 9): In Northeast Sichuan Basin, the paleoheat flow was 52~55mW/m2 (average 53.5mW/m2) at Middle Silurian, 55~56mW/m2 (average 55.5mW/m2) at Middle Carboniferous and 57~58mW/m2 (average 57.5mW/m2) at Early Permian.
But it ascended abruptly upto 63~68mW/m2 (average 65.3mW/m2) at Late Permian because at that time basalt erupted in Northeast Sichuan Basin and strong extensional movements emerged resulting in the increase of paleoheat flow even up to maximum.56‒59 After that, the paleoheat flow decreased dramatically, going below 46~54mW/m2 (average 50.3mW/m2) at Early Triassic. And then the paleoheat flow went down slightly, which was 45~53mW/m2 (average 48mW/m2) at Late Triassic, 44~51mW/m2 (average 46.8mW/m2) at the end of Jurassic and 43~50mW/m2 (average 45.5mW/m2) at Late Cretaceous, and at present it is 41~50mW/m2 (average 44mW/m2).
In this paper, a new method of reconstructing paleogeotemperature by illite crystallinity has been explored. Through thermal simulation experiments, the relationship between illite crystallinity (IC) and thermal simulation temperature (T) or vitrinite reflectance (Ro) of thermal evolution has been found and the quantitative model of illite crystallinity (IC)-vitrinite reflectance (Ro) has been established to reconstruct and calculate the paleogeotemperature: IC = -0.06656Ro+0.50609 (correlation factor: 0.9455). This offers a new means for the reconstruction of thermal history of marine carbonates with high maturity where there is lack of vitrinite. But this method is still at the early stage and there is a room for improvement. The questions that might be answered in the future:
The authors would like to appreciate Wuxi Geology Research Institute of Petroleum Exploration and Development, SINOPEC and Academy of Geological Sciences, Shengli Oilfield for sampling, and acknowledge Professor Qin Jianzhong, Dr. Liu Wenbin, Dr. Teng Ger, Dr. Ma Liangbang, Dr. Rao Dan, Dr. Wang Jie and Dr. Yuan Dongshan for the thermal simulation experiments and sample testing. The authors also gratefully acknowledge the financial support of National Major Science and Technology Project (2016ZX05004-002, 2017ZX05008-005), PetroChina Major Science and Technology Project (2018A-01), 973 National Project (517102- N51501/001), the Fundamental Research Funds for the Central Universities (517102*172210172) and Jiangsu Collaborative Innovation Center for Modern Crop Production (JCIC-MCP). Furthermore, we are grateful to two anonymous reviewers and editor Clement for their critical comments and constructive suggestions.
The author declares that there are no conflicts of interest.

©2019 Xiaofang, et al. This is an open access article distributed under the terms of the, which permits unrestricted use, distribution, and build upon your work non-commercially.