International Journal of
eISSN: 2475-5559


Research Article Volume 6 Issue 1
1State Key Laboratory of Petroleum Resources and Prospecting, Beijing, China
2College of Geosciences, China University of Petroleum, Beijing, China
Correspondence: Hengmao Tong, State Key Laboratory of Petroleum Resources and Prospecting, Beijing, China, Tel 86 135012632 41
Received: August 04, 2023 | Published: August 23, 2023
Citation: Tong H, Huang L, Zhang H, et al. Evolution of the tectonic stress regime in the Pearl River Mouth Basin and its constraints on the spreading of the South China Sea. Int J Petrochem Sci Eng. 2023;6(1):65-75. DOI: 10.15406/ipcse.2023.06.00131
The formation and evolution of the South China Sea (SCS) have been a great concern in the academia for many years, but still are controversial. The evolution of the SCS can be constrained by studying the tectonic stress regime of the Pearl River Mouth Basin (PRMB), one of the representative basins in the northern continental margin of the South China Sea. Based on the analysis of high-resolution 2D and 3D seismic data, we discover seesaw sedimentary filling features above and below a crucial unconformity interface, the T80 reflection interface (40 Ma), which corresponds to a transformation in the tectonic stress regime of PRMB. We also find that before 40Ma (below the T80 reflection interface), the PRMB was extended in the NW-SE direction, and during 40–10.5 Ma (between T80–T32), the extension direction was nearly N-S and kept unchanged. With the constraints of tectonic stress regime of PRMB and other basins in the north of SCS, a new tectonic evolution model of the SCS is proposed. During 40–15.5 Ma, the formation of the SCS Oceanic Basin was driven by near N-S extension under conditions of pre-existing structures. The seawater depth and the seafloor geography in the SCS Oceanic Basin also can support this new model.
Keywords: South china sea, pearl river mouth basin, tectonic evolution, extension, tectonic stress regime, pre-existing structure
The South China Sea (SCS), located to the southeast of the Eurasian continent, is one of the marginal seas with the largest area and deepest water in the Western Pacific. The SCS is situated on the southeastern margin of the Eurasian Plate, and it is connected to the Philippine Plate by the Manila trench to the east, the Indian Plate by the Indochina Peninsula to the west, and the Australian Plate by the Indonesian archipelago to the south (Figure 1). Under the interaction of the Eurasian Plate, the India-Australia Plate, the Pacific Plate and the Philippine Plate, the SCS has been considered a natural laboratory for the study of the tectonic evolution of marginal seas and has been the focus of international research.1-27

Figure 1 Tectonic sketch map of the South China Sea region, modified from Hall, 1996. YGGB, yinggehai basin; BBGB, beibu gulf basin; QDNB, qiongdongnan basin;(STB, southwestern taiwan basin; PRMB, pearl river mouth basin (orange colour); SCSOB, south china sea ocean basin(deep green colour).
A series of NE-striking sedimentary basins have developed in the continental shelf to the continental slope on the northern continental margin of the SCS since the Cenozoic, including the Southwestern Taiwan Basin, Pearl River Mouth Basin (PRMB), Qiongdongnan Basin, and Beibu Gulf Basin. A typical representative basin is the PRMB, which has a high degree of oil-gas exploration and abundant data.
According to plate tectonic theory, the tectonic deformation regime (regional tectonism mode and direction) in a region is generally unified under the same tectonic stress regime in the absence of plate boundaries. There is no plate boundary between the South China Sea Oceanic Basin (SCSOB) and the northern Cenozoic basins of the SCS, so it is considered that they formed and evolved under the same tectonic stress regime. Therefore, studying the tectonic stress regime of the PRMB can provide constraints on the evolution of the SCSOB.
Since Ludwig28 first proposed that the central subbasin of the SCS is composed of oceanic crust, Chinese and foreign researchers have carried out a large number of geological and geophysical studies and have proposed a number of kinematic models for the evolution of the SCS to resolve tectonic evolution problems. However, at present, there is still much controversy about the model and evolution history of the SCSOB. Based on differences in the understandings of the start time, direction and sequence, as well as different estimates of the center locations in different periods, the SCSOB models proposed by previous researchers can be classified into two kinds:
The PRMB is the largest basin in the northern part of the SCS and is rich in oil and gas resources. In recent years, major breakthroughs have been made in oil and gas exploration and development in the PRMB. A number of oil and gas fields have been discovered, and a large amount of high-precision 2D and 3D seismic data has been collected. Numerous studies on the tectonic pattern, tectonic style, tectonic evolution and formation mechanism of the PRMB have been conducted and suggest that the basin experienced multiphase tectonic movements and that the direction also changed several times in the Paleogene5,8,9,37; however, there are still different opinions on the specific evolution of the tectonic stress field.
Yao8,9 indicated that from Tg (the unconformity associated with the Shenhu movement, Table 1) to T70 (the unconformity associated with the SCS movement, Table 1), that is, from 66 Ma to 32 Ma, the extensional direction of the PRMB was NW-SE, and this extension produced a series of NE structures. From T70 to T32 (the unconformity associated with the Dongsha movement, Table 1), that is, 32–10.5 Ma, the basin extended in an approximately N-S direction. On this basis, Li,38 Shao et al.,39 Shi et al.,37 Wang et al.,40 and Mi et al.41 identified the first phase of the Zhu-qiong Movement, the second phase of the Zhu-qiong Movement, the Baiyun Movement and other tectonic events (Table 1), accompanied by multiple changes in the direction of the basin. Lü et al.,5 Li et al.,15 and Ye et al.42 indicated that the direction of the PRMB changed via clockwise rotation during multiple phases of tectonic activity during the Cenozoic; that is, the NNW-SSE in the Pliocene period gradually changed to NNE-SSW in the Miocene period.
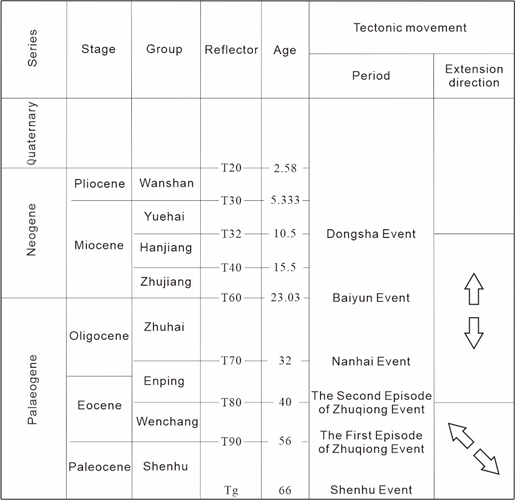
Table 1 Stratigraphic table of the Pearl River Mouth Basin, modified from Shi et al.33
According to the faulting model under pre-existing tectonic conditions43-45 and the results of tectonic physical simulation experiments,46,47 although the direction remains consistent (i.e., the regional tectonic stress regime remains the same), faults with different strikes and multiple activity periods can be formed. Pre-existing structure-reactivated faults formed first, followed by pre-existing structure-related faults, and finally, Coulomb faults (pre-existing structure-unrelated faults) reflecting the direction of regional tectonism formed. In the process of progressive tectonic deformation, the direction of faults continuously shifted according to occurrence statistics.45 This shift in fault direction is not always the result of changes in the regional extension direction. Therefore, it is not scientific to infer a change in the regional extension direction based on a shift in fault strike from simple statistical analysis of fault occurrence.
Based on recent research results,48,49 although the Bohai Bay Basin experienced multiple tectonic events (as evidenced by multiple unconformities) during the Cenozoic, the regional extension direction changed only once at approximately 40 Ma. Since the Late Cretaceous, the movement direction of the Pacific Plate shifted once at 43–40 Ma,50,51 indicating that the direction of regional tectonic action in this region is unlikely to have shifted frequently. Therefore, the viewpoint that the extension direction of a region (such as PRMB) changed many times during a certain geological history period (such as the Cenozoic) is probably controversial and needs to be re-examined.
In this work, high-precision 2D and 3D seismic data were collected, and the faulting model under the pre-existing structure conditions in the PRMB was analyzed. The analysis of this typical basin can be used to reconstruct the evolution of the tectonic stress regime in the SCS. The results revealed that the T80 reflection interface (the unconformity interface of the second phase of the Zhu-qiong Movement, approximately 40 Ma, Table 1) corresponds to a transformation in the tectonic stress regime. Before 40 Ma, the tectonic stress regime of the basins in the northern SCS resulted in NW-SE extension; from 40 Ma to 10.5 Ma, the tectonic stress regime resulted in approximately N-S extension with no change. These findings provide powerful constraints on evolution of the SCS. On this basis, a new model of the evolution of the SCS has been established.
The PRMB was located on the southeastern margin of the Eurasian Plate in the northern SCS. This basin is surrounded by the Eurasian Plate, the India-Australia Plate, the Pacific Plate and the Philippine Plate and has experienced complex tectonic environments. The tectonic evolution of the PRMB has not only controlled the processes of oil and gas generation, migration and accumulation but has also recorded the history of the and evolution of the SCSOB. Thus, the PRMB has long attracted the attention of many researchers.37,38,41,49,52-54
The PRMB is a NE-SW-striking offshore basin on the southern margin of mainland China, with an area of approximately 22 × 104 km2. The secondary tectonic units of the basin include three depressions and three uplifts,41,55 namely, the northern uplift zone, northern depression zone (ZhuI and ZhuIII depressions), central uplift zone (Shenhu Uplift and Dongsha Uplift), central depression zone (ZhuII Depression), southern uplift zone (Shunhe Uplift), and southern depression zone (Figure 2).
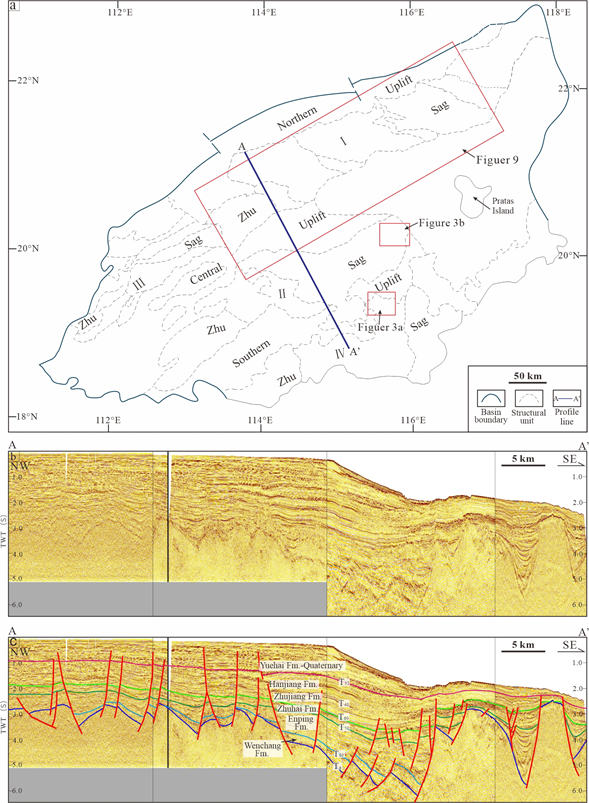
Figure 2 (a) Structural unit division map of the PRMB. (b) A-A’ seismic profile without interpretation. (c) A-A’ seismic profile with interpretation.
The PRMB is a passive continental marginal basin (Figure 2). The basin basement is composed of pre-Cenozoic magmatic and metamorphic rocks,56 and the sedimentary cover is Cenozoic strata (Table 1, Figure 2, Zhong et al.57). Based on seismic data and drilling data, the Paleogene strata in the basin are divided into the Shenhu Formation, Wenchang Formation, Enping Formation and Zhuhai Formation from bottom to top, and the Neogene strata are divided into the Zhujiang Formation, Hanjiang Formation, Yuehai Formation and Wanshan Formation. Quaternary deposits overlie the Wanshan Formation.40
The PRMB has experienced a history of complex tectonic evolution, and multiple unconformity interfaces were formed (Table 1). The T80 reflection interface is one of these unconformities. The stratigraphic division of the basin mainly relies on planktonic microfossils, especially planktonic foraminifera and calcareous nanofossils.58 Researchers defined the age of the T80 reflection interface as approximately 40 Ma; for example, Xie et al.59 defined it as 38 Ma; Sun et al.60 and Zhou et al.61 defined it as 39 Ma; Wang et al.62 defined it as 39.4 Ma; and Yan et al.,63 Sun et al.,60 Pang et al.,64 Sun et al.,65 Lu et al.66 defined it as 40 Ma.
In the PRMB, it was found that the sedimentary strata show a so-called seesaw pattern through systematic tectonic analysis of the 2D and 3D seismic data, structure maps and stratum thickness maps. The strata between T80–T32 show inheritance in terms of thickness, and the strikes of faults also show that they formed under the same tectonic stress regime. The extension direction shifted from NW-SE (before the T80 interface) to nearly N-S (T80–T32).
Discovery of the seesaw sedimentary filling feature above and below the T80 reflection interface and its tectonic significance
A large number of basin tectonic analysis studies have revealed that when the tectonic stress regime (regional tectonism mode and direction) remains consistent, the changes in stratum thickness, sedimentation and subsidence center are inherited; conversely, when the tectonic stress regime changes, the thickness and the sedimentation and subsidence center change abruptly, and a seesaw pattern in the stratum thickness is a typical response to the change in the tectonic stress regime.48
Tong et al.48 conducted a tectonic study of the Nanpu Sag in the Bohai Bay Basin (one of the basins with the richest oil and gas resources in China) and found that the strata above and below E2s2 (40–38 Ma) show seesaw changes in thickness according to east-west survey lines. The exact transformation time (40–38 Ma) of the Bohai Bay Basin from the NW‒SE extension direction to the N-S direction was constrained and is moderately consistent with the timing of the shift in the Pacific Plate movement direction (43–40 Ma) (the difference in time represents the stress transfer time). The seesaw type change in stratum thickness provides two contributions to this area. First, this confirms that there was a transformation in the stress regime; second, combined with the formation age of the transformation interface, this finding provides an accurate time point for the transformation in the stress regime.48
Through tectonic analysis of the PRMB, the seesaw changes in the thickness of the strata above and below the T80 reflection interface were also found in the Liwan Sag and Baiyun Sag (Figures 3, 4, and 5).

Figure 3 (a) Structural map of the northwestern Liwan Sag. (b) Structural map of the eastern Baiyun Sag. The map location is shown in Figure 2.
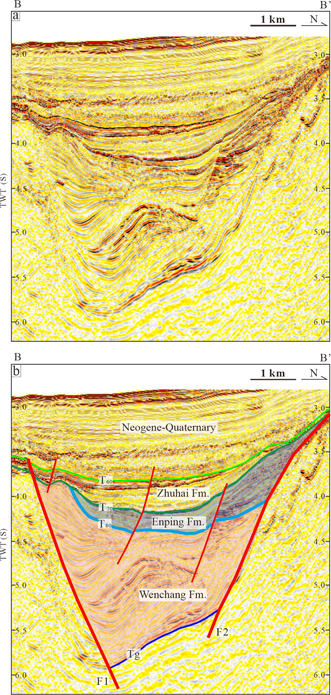
Figure 4 The seesaw sedimentary filling feature of the B-B’ seismic profile in the Liwan Sag; the profile location is shown in Figure 3a. (a) Profile without interpretation. (b) Interpreted profile.
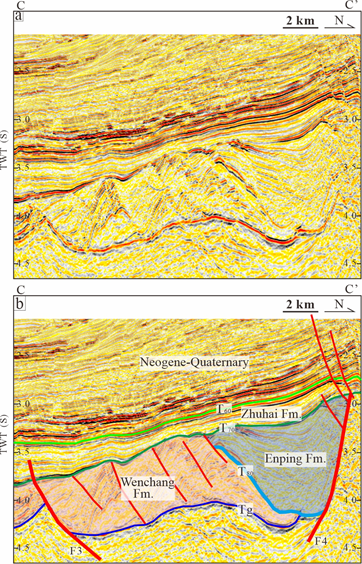
Figure 5 The seesaw sedimentary filling feature in the C-C’ seismic profile in the Baiyun Sag; the profile location is shown in Figure 3b. (a) Profile without interpretation. (b) Interpreted profile.
The Liwan Sag is located north of the ZhuIV Depression in the PRMB (Figure 2). There are two boundary faults (F1 and F2) in the northwest of the sag, and they controlled the development of the Wenchang and Enping Formations. F1 and F2 dip toward each other and intersect eastward, enclosing a triangular area (Figure 3a). The F1 fault, which dips to the north and strikes ENE-WSW, formed earlier; the F2 fault, which dips to the south and strikes nearly E-W, formed later.
Seesaw sedimentary filling feature in the Liwan Sag: It can be seen from the profile in Figure 4 that the F1 and F2 faults controlled the deposition of a set of strata and that both were synsedimentary faults. The F1 fault with a ENE strike dominated the deposition of the Wenchang Formation; the F2 fault with a nearly E-W strike, dominated the deposition of the Enping Formation. Hence, the two boundary faults controlled the development of the Wenchang and Enping Formations, giving rise to the seesaw sedimentary filling pattern observed in the profile (Figure 4).
Seesaw sedimentary filling feature in the Baiyun Sag: The Baiyun Sag is located in the ZhuII Depression of the PRMB (Figure 2), and the basin fill on the eastern edge (Figure 3b) exhibits a seesaw pattern (Figure 5). The NE-striking F3 fault on the southern side controlled the development of the Wenchang Formation below T80, while the nearly E-W-striking F4 fault on the north side controlled the development of the Enping Formation above T80 (Figure 5).
Manifestation of seesaw sedimentary filling in plan-view: In the two sags (Liwan Sag and Baiyun Sag) of the PRMB, the strata in the profiles have a seesaw filling feature (Figures 4 and 5), and the depositional centers have a transition feature in plan-view (Figures 6a and b).
The thickness maps of the Wenchang and Enping Formations in the PRMB (Figure 6a and b) revealed that (1) the Wenchang Formation is thickest (up to 2000 m) in the Hanjiang Sag of the ZhuI Depression and the Kaiping Sag of the ZhuII Depression; the Enping Formation in these areas is 0–800 m and 0–400 m thick, respectively. (2) In the Huizhou sag and Lufeng sag (both located in the ZhuI Depression), where the Wenchang Formation is only 0–400 m thick, the Enping Formation reaches a thickness of 800–1600 m. (3) The Enping Formation is thickest (up to 4400 m) in the Baiyun Sag of the ZhuII Depression, where the Wenchang Formation is only 800–1600 m thick.
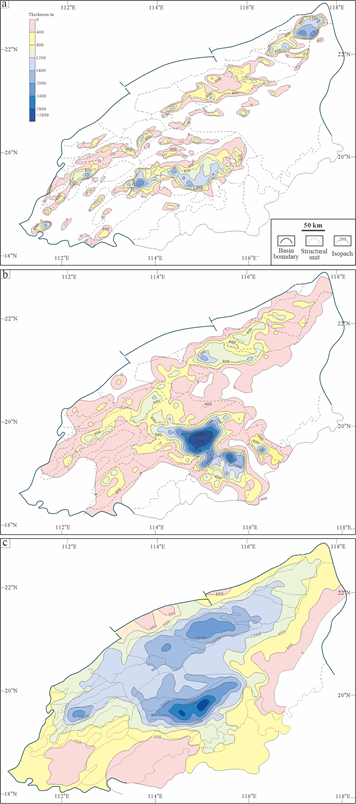
Figure 6 (a) Isopach map of the Wenchang Formation in the PRMB. (b) Isopach map of the Enping Formation in the PRMB. (c) Isopach map of the Zhujiang-Hanjiang Formation in the PRMB.
Compared with the underlying Wenchang Formation, the Enping Formation has no inheritance and exhibits a sudden change in sedimentary thickness. Therefore, we infer that the T80 reflection interface is a tectonic stress regime transformation interface.
Evolution of tectonic stress regime
The above analysis revealed that T80 is the tectonic stress regime transformation interface. Since the PRMB is an extensional basin, there is no dispute about the extensional tectonic regime. Therefore, the key to constraining the evolution of the tectonic stress regime is to determine the extension direction before and after the formation of the T80 interface.
Tg–T80 (66–40 Ma) tectonic stress regime: The basins located in the northern SCS, including the PRMB, are all Cenozoic sedimentary basins. The Shenghu Movement in the early Cenozoic (Table 1) formed the regional Tg unconformity interface8,9,34,38,57,67,68 and then the PRMB and other basins began to form in the northern SCS. During the depositional period of Tg–T80 (66–40 Ma), the NW-SE rifting laid the foundation of the NE distribution pattern of the basins of the northern SCS (Figure 6a).8,9,34,49,67,69 There is generally no dispute that the extension direction was NW-SE in this stage.
During the depositional period of Tg–T80 (66–40 Ma), the rift caused by NW-SE extension had significant impacts on the distribution of faults and sediments in the PRMB.
The distribution map of basement faults in the PRMB (Figure 7) revealed that the basement (Tg) faults are characterized by two main strikes, NE-SW strikes and nearly E-W strikes, among which the NE-SW-striking faults were dominant (Figure 7). In the western part of the PRMB, NE-SW-striking faults dominate (Figure 7). The faults appear to be normal growth faults and controlled the deposition of the Wenchang Formation by fault-induced subsidence, and the main strike of these faults (55°?) reflects the extension direction (145° or 225°?). The nearly E-W-striking faults mainly occur in the ZhuI Depression and the eastern part of the ZhuII Depression (Figure 7). These faults are generally long-lived active faults and controlled the deposition of the Wenchang Formation by fault-related subsidence. The fault strike was controlled by the pre-existing E-W structures and does not reflect the extension direction.
The thickness map of the Wenchang Formation (Figure 6a) reveals that the sediments were mainly distributed in the NE-SW direction, which was a response to the NW-SE extension.
Prior to 40 Ma, the extension in the NW-SE direction was an integral feature over a large area (the entire East Asia region),49 both in the northern basins (such as the Beibu Gulf Basin and Qiongdongnan Basin) in the SC70,46,69,70 and in the Bohai Bay Basin,48 as well as in the East China Sea Shelf Basin.
Therefore, during the depositional period of Tg–T80 (66–40 Ma), the tectonic stress regime in the SCS featured a NW-SE extensional regime.
Tectonic stress regime during T80–T32 (40–10.5 Ma): The T80 reflection interface represents a transformation interface for the tectonic stress regime and a regional unconformity.37–41 Therefore, after formation of the T80 reflection interface, the tectonic stress regime in the PRMB underwent a fundamental change from the NW-SE extension during Tg–T80 to the nearly N-S extension during T80–T32.
Yao8,9 argued that the PRMB experienced N-S extension at 32 Ma instead of 40 Ma. However, from the above analysis, it can be seen that at approximately 32 Ma, there was no trace of tectonic stress regime transformation similar to that at approximately 40 Ma (above and below the T80 interface), so the timing of N-S extension initiation should be at 40 Ma, not 32 Ma.
In addition, Li et al,38 Shao et al.,39 Shi et al.,37 Wang et al.,40 and Mi et al.41 argued that the PRMB underwent multiple phases of tectonic activity in the Cenozoic, accompanied by multiple changes in the extension direction. Lü et al.,5 Li et al.,15 and Ye et al.19 further pointed out that the extension direction shifted multipsle times in a pattern of clockwise rotation during multiple phases of tectonic activity.
The main basis of the proposal that the extension direction continuously changed in different stages of tectonic evolution in the Cenozoic, as previously mentioned, is that faults in different reflection layers change in strike constantly (fault distribution and rose diagram of the fault strike in Figures 7, 8, and 9), and they used the Anderson fault mode71 to determine the extension direction (normal to the average strike of the faults).

Figure 9 Distribution of the faults in the T32 reflection interface in the ZhuI Sag, modified from Hu et al.13
The root cause of the abovementioned insufficient understanding is the inappropriate application of the Anderson fault model (based on homogeneous media). When a pre-existing structure exists, the strikes of pre-existing structure-reactivated faults and pre-existing structure-related faults are mainly controlled by the pre-existing structures. Only the strikes of Coulomb faults unrelated to the pre-existing structure are determined by the extension direction; that is, the mean strike of faults is controlled by the combination of extension direction, the distribution of pre-existing structures, and the extension magnitude. It is inadequate to determine the extension direction by simply using the mean strike of faults.45
The various faults that formed under the NW-SE extension in the PRMB prior to 40 Ma (Figure 7) were all pre-existing structures that influenced the tectonic deformation in later periods (since 40 Ma). Due to these NE-SW-striking pre-existing structures (pre-existing faults), under N-S extension, the mean strike of faults in the early stage was strongly affected by the pre-existing structures (as illustrated by the rose diagram of fault strikes associated with T80 reflection interface, Figure 8), and the number of faults with a NE-SW strike is almost the same as that with a nearly E-W strike). Upwards, the influence of pre-existing structures on the mean strike of faults gradually weakened (as illustrated by the rose diagram of the fault strikes associated with the T60 reflection interface; the number of NE-SW-striking faults is small, and the nearly E-W-striking faults are dominant) until the T32 reflection interface, where the NE-SW-striking faults disappeared (as illustrated by the fault strike rose diagram in Figure 9).
When there are multiple pre-existing structures, during the progressive extensional deformation process with the extension direction remaining consistent, faults that formed in different deformation stages are inconsistent in terms of mean strike44,45 and rotate clockwise (or anticlockwise). This recognition has been derived theoretically44,46,47 and verified with simulation experiments. In the PRMB, the faults in different reflection interfaces between T80 and T32 rotate clockwise in mean strike from bottom to top. This is the result of different deformation stages in the continuous N-S extension deformation process with pre-existing NE-SW tectonic structures.
The characteristics of sedimentary filling further indicate that the tectonic stress regime (extension direction) of the PRMB did not change during 40–10.5 Ma (T80–T32).
Following deposition of the Enping Formation (T80–T32), the basin inherited the subsidence and sedimentary filling patterns. The distribution of the formation thickness and depositional center display inherited characteristics (Figure 6b and c). The thicker deposition areas of the Enping Formation are distributed in the Baiyun Sag in the ZhuII Depression, Huizhou-Lufeng Sag in the ZhuI Depression, and Wenchang A Sag in the ZhuIII Depression, and the Zhujiang Formation and Hanjiang Formation completely inherited these characteristics. Thus, the thicker deposition areas of the Enping Formation were still the depositional centers of the Zhujiang Formation and Hanjiang Formation. The Enping Formation is up to 2800 m thick in the Baiyun Sag, 1200–2000 m in the Huizhou-Lufeng Sag, and 1600–2000 m in the Wenchang A Sag. In addition, the isopach line distribution directions of the Enping Formation, Zhujiang Formation and Hanjiang Formation also have similarities, all of which are characterized by a nearly E-W distribution. If the extension direction changed during this period, the above situation would not occur (thickness distribution trends would have abrupt changes, and depositional centers would have migrated).
Since 40 Ma, N-S extension has also occurred over a large region (the entire East Asia region),49 including in the northern basins of the SCS (such as the Beibu Gulf Basin70 and Qiongdongnan Basin46,69 and in the Bohai Bay Basin.48
In summary, the tectonic stress regime of the PRMB during the period of 40–10.5 Ma (T80–T32) featured nearly N-S extension.
Based on the above analysis, the T80 reflection interface is the transformation interface of the tectonic stress regime. The tectonic stress regime between the Tg and T80 reflection interfaces featured NW-SE extension; between the T80 and T32 reflection interfaces, it featured nearly N-S extension.
Considering that there are no plate boundaries between the SCSOB and the northern basins of the SCS (including the PRMB), these two basins are deemed to have formed and evolved under a unified tectonic stress regime. Therefore, the study of the evolution of the tectonic stress regime in the PRMB can provide powerful constraints for the mechanism of the SCSOB.
At present, two mainstream views on the mechanism of the SCS exist: one involves N-S followed by NW-SE spreading7 and the other involves NW-SE followed by N-S spreading.8,9,34 Both models have some limitations. The hypothesis proposed by Briais et al. 7 suggested that the SCSOB was in NW-SE extension during 23–15.5 Ma, which is not in agreement with the nearly N-S extension in the PRMB. Yao8,9,34 argued that the tectonic stress regime transition occurred at the T70 reflection interface, which is inconsistent with the finding that T80 is the transformation interface of the tectonic stress regime in this paper. Therefore, based on the above analysis of the evolution of the tectonic stress regime, a new model for the evolution of the SCSOB is established in this study.
A new model of the SCS
Based on the new insight into the stress field evolution, the new model proposed in this paper suggests that the SCSOB experienced nearly N-S extension in the period of 40–15.5 Ma, and the evolution process is as follows (Figure 10):
1) Pre-40 Ma
The SCS was a continental rift in this stage, with NW-SE extension and the formation of NE- and ENE-oriented normal faults, which later became the pre-existing structures in the southwestern subbasin and northwestern subbasin. The SCSOB had not yet formed in the stage.
2) 40–26.5 Ma
Starting at 40 Ma, the SCS was under a nearly N-S extensional tectonic stress regime. Pre-existing structure will reactivate ahead of Coulomb fault formation Under a unified tectonic stress regime,45 so the southwestern subbasin (with NE- oriented pre-existing structures) and northwestern subbasin (with ENE-oriented pre-existing structures) opened first (Figure 10a), and the central subbasin without pre-existing structures opened later (Figure 10b).
3) 26.5 Ma
26.5 Ma was an important time point for the SCS: (1) the central subbasin experienced a ridge jump and continued to spread along the new mid-ocean ridge, and (2) the southwestern subbasin stopped spreading (Figure 10c).
4) 26.5–15.5 Ma
During 26.5–15.5 Ma, as the N-S extension continued, the central subbasin spread constantly, and the southwestern subbasin did not spread during this period (Figure 10d).
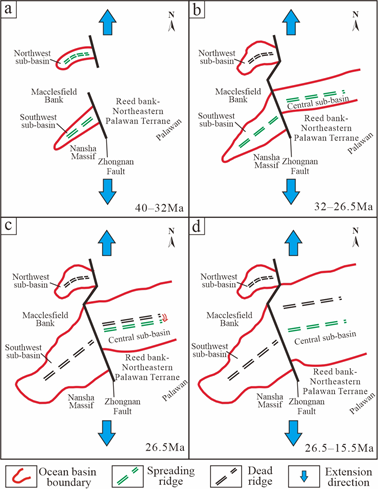
Figure 10 Schematic diagram of the conceptual model of SCS. (a) The state of the SCS during 40–32 Ma. (b) The state of the SCS during 32–26.5 Ma. (c) The state of the SCS at 26.5 Ma. (d) The state of the SCS during 26.5–15.5 Ma.
Renumbering of magnetic anomaly stripes in the SCSOB
At present, the main means of studying the formation and evolution of the SCS is to analyze and compare submarine magnetic anomaly stripes. However, there are different explanations for the magnetic anomaly stripes in the southwestern and northwestern subbasins.7,9,34
Based on the new model of SCS and evolution and the interpretation results of Briais et al.,7 the submarine magnetic anomaly stripes in the SCSOB are renumbered in this study: the numbers of magnetic anomaly stripes in the southwestern subbasin are changed from 6b–5c in Briais et al.7 to 13–8; those in the northwestern subbasin are changed from 11–10 in Briais et al.7 to 13–12; and those in the central subbasin remain unchanged, but their specific locations are modified according to the magnetic anomaly display in Figure 11 (schematically shown in Figure 12.).
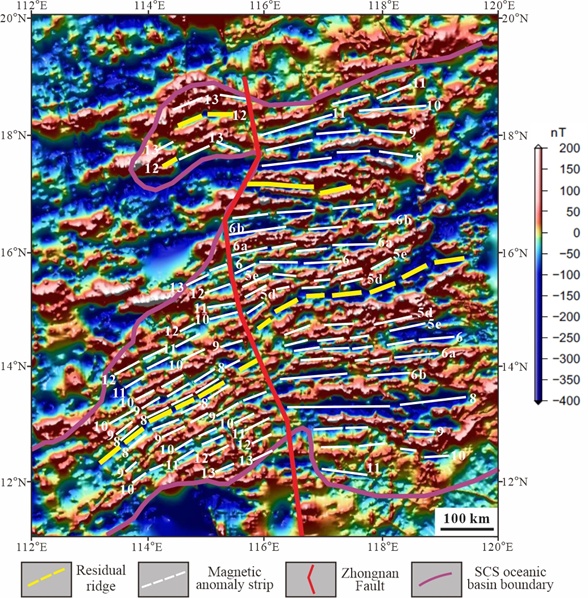
Figure 11 Renumbering of magnetic anomaly stripes in the SCS, modified from Li et al.19
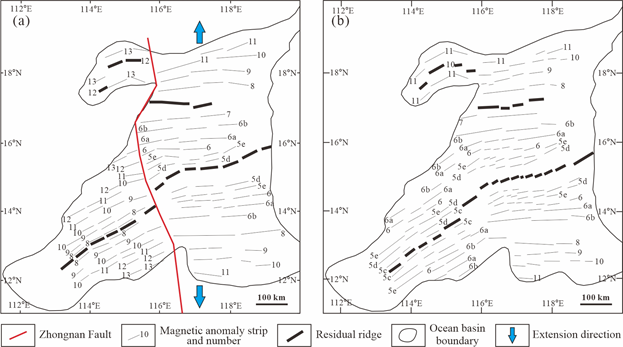
Figure 12 Magnetic anomaly stripe interpretation contrast diagram. (a) The results of this study. (b) The results of Briais et al.4
The southwestern subbasin: Briais et al.7 found 6 magnetic anomaly stripes in the southwestern subbasin and labeled them 6b–5c (Figure 12b), which indicates that southwestern subbasin opened after 26.5Ma. While according to our study, southwestern subbasin spread during 40–26.5 Ma, and stopped after 26.5Ma. So we revised magnetic anomaly stripes in the southwestern subbasin to 13–8 (Figure 12a).
According to the research results of the northern basins in the SCS, the tectonic stress regime in the SCS changed from NW-SE extension to nearly N-S extension at 40 Ma. During nearly N-S extension, the NE-striking pre-existing structures reactivated first, and the southwestern subbasin began to open. Considering that stress transmission has a time delay,48 the southwestern subbasin should have begun after 40 Ma; that is, the age of the earliest magnetic anomaly stripe should be less than 40 Ma (the magnetic anomaly stripe aged 40 Ma is numbered 14), so the magnetic anomaly stripe numbers of the SCS should be less than 14.
We infer that the southwestern subbasin terminated at 26.5 Ma in this study; thus, the age of the southwestern subbasin mid-ocean ridge is 26.5 Ma (the corresponding magnetic anomaly stripe is numbered 7). Because 6 stripes are counted from the mid-ocean ridge to the outside, the magnetic anomaly stripe numbers of the southwestern subbasin should be 13–8.
Therefore, whether it is forward or reverse deduction, numbering the magnetic anomaly stripes 13–8 is reasonable.
Therefore, the earliest submarine magnetic anomaly stripe in the southwestern subbasin should be numbered 13. With the continuation of the nearly N-S extensional tectonic stress regime, the southwestern subbasin opened constantly, and newer magnetic anomaly stripes were formed in turn. However, at 26.5 Ma, a ridge jump occurred in the central subbasin. At this time, the southwestern subbasin stopped expanding, leaving magnetic anomaly stripes numbered 13 to 8 on the ocean floor (Figures 11, 12a). Therefore, we infer that the time of the southwestern subbasin was 38–26.5 Ma.
The northwestern subbasin: Briais et al.7 found two magnetic anomaly stripes in the northwestern subbasin and labeled them 11–10 (Figure 12b). Based on the analysis results of tectonic stress regime evolution, we revise these two magnetic anomaly stripe numbers to 13–12 in this study (Figure 12a), considering that the northwestern subbasin and southwestern subbasin expanded at the same time.
Similar to the situation in the southwestern subbasin, the northwestern subbasin opened along ENE-striking pre-existing structures first. However, due to some unknown reason, the northwestern subbasin gradually terminated during the later and failed to create a large-scale oceanic basin. On the ocean floor of the northwestern subbasin, magnetic anomaly stripes numbered 13–12 were left, recording this process.
Differences from previous models
Together, the new model of SCS proposed in this paper, the model of initial N-S and subsequent NW-SE7 and the model of initial NW-SE and subsequent N-S8,9,34 all consider that the formation time of the central subbasin was generally between 32–15.5 Ma, corresponding to submarine magnetic anomaly stripes numbered 11 to 5c. However, the new model differs from the previous models in terms of the process of the southwestern subbasin and northwestern subbasin.
Briais et al. 7 argued that the southwestern subbasin formed later than the central subbasin and was formed by the extension of the central subbasin to the southwest at 23.6 Ma after the ridge jump occurred. It corresponded to the magnetic anomaly stripes of 6b–5c with ages of 23.6–15.5 Ma. This model suggests that the SCSOB was in NW-SE from 23.6 to 15.5 Ma, while the results of this study suggest that the tectonic stress regime featured nearly N-S extension from 40 to 15.5 Ma. During this period, there are no structural features in the northern basins of the SCS reflecting NW-SE extension.
In contrast, Yao8,9,34 considered that the southwestern subbasin and northwestern subbasin formed earlier than the central subbasin during the NW-SE extension process and corresponded to oceanic magnetic anomaly stripes of 18–13 between 42–35 Ma. This model holds that the tectonic transformation interface is the T70 reflection interface; however, the results of this study suggest that the transformation of the tectonic stress regime occurred at the T80 reflection interface.
Based on the above analysis, the new model proposed in this study indicated that the southwestern subbasin and northwestern subbasin formed along NE and ENE-striking pre-existing structures under the nearly N-S extensional tectonic stress regime after 40 Ma. The submarine magnetic anomaly stripes in the southwestern subbasin are numbered 13–8 and aged 38–26.5 Ma, while those in the northwestern subbasin are numbered 13–12 and aged 38–35 Ma (Figures 11, 12).
Other evidence
Seawater depth: As seen from the seawater isobath map of the SCSOB (Figure 13), the seawater depth of the central subbasin is 3000–4300 m in the zone without reefs and approximately 4000 m at the mid-ocean ridge (the edge of reefs). The seawater depth of the southwestern subbasin is 4000–4500 m in the zone without reefs and approximately 4400 m at the mid-ocean ridge.
According to the theory of plate tectonics, the seawater depth of the ocean floor increases with the age of the oceanic lithosphere. From the functional relationship between the depth of the ocean floor and the age of oceanic basalt (d (t) = 2500 + 350 (t) 1/2, Parsons and Sclater,72), it can be seen that the greater the seawater depth is, the older the oceanic basalt age is. In other words, the oceanic basalt in the southwestern subbasin with a deeper seawater depth should be older than that in the central subbasin with a shallower seawater depth.
According to the new insights in this study, the magnetic anomaly stripe ages at the mid-ocean ridge in the southwestern subbasin and central subbasin are 26.5 Ma and 15.5 Ma, respectively. Adopting the above functional relationship to estimate the seawater depth, the calculated results are 4300 m and 3900 m, respectively. The results match the seawater isobath map of the SCS fairly well, suggesting that the current seawater depth data of the SCSOB support the new model proposed in this study.
Seafloor geomorphy: Young mid-ocean ridges (e.g., the Mid-Atlantic Ridge) are characterized by a ridge-like geomorphy. However, after the termination of extension, the ridge height decreases constantly because of thermal cooling subsidence. In the SCS, the mid-ocean ridge in the central subbasin is still a ridge with a relative height difference of 300 m, while the ridge form of the mid-ocean ridge in the southwestern subbasin no longer exists and has become a depression (Figure 13). This indicates that the expension of the mid-ocean ridge in the southwestern subbasin should have ceased earlier than that in the central subbasin, which is also consistent with the new model proposed in this paper.
Age of the southwestern subbasin and northwestern subbasin
The new model proposed in this study indicated that the northwestern subbasin and southwestern subbasin developed after 40 Ma due to the existence of pre-existing structures. However, the possibility that the southwestern and northwestern subbasins are older than 40 Ma cannot be ruled out.
This hypothesis infers that the southwestern subbasin and northwestern subbasin started to form under the NW-SE extension before 40 Ma; that is, the ages of the magnetic anomaly stripes in them are all older than 40 Ma. The central subbasin was formed by the nearly N-S extension after 40 Ma. If this hypothesis is accurate, the numbers of the magnetic anomaly stripes in the southwestern subbasin and northwestern subbasin should be all greater than 14.
Age study of oceanic basalts in the SCSOB
At present, the study on the evolution time of the SCS is mainly based on submarine magnetic anomaly stripes and paleontological data obtained by drilling cores in surrounding basins. The ages determined by these data have large errors and are not reliable.
The IODP349 voyage15,16 and IODP367/368 voyage25,26,73 encountered oceanic basalt in the central subbasin, southwestern subbasin, and northern oceanic crust transition zone. In addition, a large number of sediment and basalt samples were successfully obtained. Li et al.15 constrained the age of the mid-ocean ridge of the southwestern subbasin to 16 Ma, that of the central subbasin to 15 Ma, and that of the northern oceanic crust transition zone to approximately 33 Ma based on paleontological samples obtained by drilling. However, the key evidence to truly reveal the history of the SCSOB should come from the dating of oceanic basalts. To date, no official oceanic basalt dating results have been reported. With the study of basalt dating results and the application of oil and gas exploration data in the peripheral basin, the question of and evolution of the SCS will be solved in the near future.
Seesaw sedimentary filling features above and below the T80 reflection interface in the PRMB is found and indicates that the tectonic stress regime of the PRMB experienced a sudden change across the T80 reflection interface (40 Ma). Before 40Ma (below the T80 reflection interface), the PRMB was extending in the NW-SE direction, while during 40–10.5 Ma (between T80–T32), the extension direction is nearly N-S and keeps unchanged.
Because there is no plate boundary between the SCSOB and the northern basin of the SCS (including the PRMB), it can be concluded that they were formed and evolved under a unified tectonic stress regime. Combined with previous studies, we proposed a new evolution model of SCS : the SCS is the result of nearly N-S extension under the influence of pre-existing structures. During 40-26.5 Ma, due to the reactivation of pre-existing structures, the southwestern subbasin and the northwestern subbasin formed. At 26.5 Ma, a ridge jump occurred in the central subbasin, and the southwestern subbasin terminated. During 26.5-15.5 Ma, the central subbasin continued to spread. The new model of SCS is also consistent with the seawater depth and the seafloor geography of the SCSOB.
All authors declare that there is no conflict of interest
None.

©2023 Tong, et al. This is an open access article distributed under the terms of the, which permits unrestricted use, distribution, and build upon your work non-commercially.