International Journal of
eISSN: 2574-8084


Technical Paper Volume 10 Issue 5
1Catholic University of São Paulo, Brazil
2University of São Paulo, Brazil
3Catholic University of Porto Alegre, Brazil
Correspondence: Renato Dimenstein, Rua Cardeal Arcoverde, 1749, conjunto 57B, São Paulo Brazil, Tel +55(11) 999090215 05407-002
Received: October 10, 2023 | Published: October 30, 2023
Citation: Dimenstein R, Bevilacqua LC, Souza DS. How to evaluate the quality of ultrasound images for B-mode and Doppler?. Int J Radiol Radiat Ther. 2023;10(5):119-121. DOI: 10.15406/ijrrt.2023.10.00366
The present study evaluated the performance of the Ultrasound (US) and Doppler devices. The methodology was based on the recommendations of the American Association of Medical Physics (AAPM). The study used an image simulator phantom manufactured by Sun Nuclear/Gammex (model 403). The performance evaluation was applied for B-mode and Doppler. The study analyzed 182 devices with 546 transducers from different models and manufacturers. The evaluation parameters were: a) spatial resolution; b) depth of view c) image contrast; d) visualization of anechoic objects; d) velocity; e) sensitivity for (Doppler Mode); and f) artifacts in the images. The evaluation indicated that 43,95% of the probes showed some type of non-compliance, directly affecting the accuracy of the medical diagnosis. The present investigation indicates the need to carry out image quality evaluation to verify the degradation of the probes to minimizing possible errors in diagnostic imaging due to inadequate performance of the US equipments.
Keywords: B mode, Doppler, quality control
The factors that affect the propagation of sound waves are the operating frequency, power and amplification gain. The image quality parameters are expressed in terms of resolution, contrast and uniformity. Resolution is the ability to distinguish two points as distinct elements. Axial resolution represents the separation of two echoes returning to the detector. Higher frequency transducers have better axial resolution. Lateral resolution is determined by the diameter of the beam. The elevational resolution corresponds to the perpendicular direction of the beam. B-mode response uniformity is the ability to represent echoes with the same magnitude and depth. Contrast is the ability to distinguish between two points within an area of interest. Sensitivity represents the depth at which echo signals will be detected, which depends on the characteristics of the probe, attenuation and system settings. The narrowest region in the beam profile is called the focal point and provides the best image quality. The vertical distance makes it possible to measure the signal along the axis of the scattered beam. The horizontal distance refers to the same signal, but in the direction of beam divergence. US it is a high frequency sound and goes at the same speed as any other sound. Sound travels at different speeds in different media, for instance 343 m/s in air and 1430 m/s in water. Therefore to assessment for B-mode and Doppler image quality is necessary to use a material, which mimics the attenuation of US.1-3
The evaluation methodology for B and Doppler modes was based on the recommendations of the American Association of Medical Physics (AAPM), an American Institute of Ultrasound in Medicine (AIUM) and others institutions. In this investigation, 546 transducers available in 182 devices from different manufacturers were evaluated. The image quality of the equipment’s was assessed in terms of contrast, resolution, sensitivity and uniformity. The physical integrity of the probes and the presence of artifacts were also analyzed.4-7
During the evaluation of the transducers, the image acquisition parameters were adjusted according to the frequency of the probes, in terms of dynamic range, contrast scale, frequency and time compensation of control (TGC). The phantom produced by Sun Nuclear (model 403) was used to assess image quality. Inside the simulator, there are different objects called targets, which are distributed at different depths in the phantom. The simulation material consists of a Zerdine-based gel, which mimics the speed of sound. The phantom attenuation coefficient is 0.7dB/cm/ MHz, with relative contrast from -15 to +15 dB and Young's modulus from 4 to 100 kPa. Attached to the simulator is a flow pump, which circulates a fluid inside a vessel. This fluid mimics the characteristics of blood and it is therefore possible to evaluate the propagation speed for the Doppler Mode. The figure n⁰ 01 shows the image of simulation of the B and Doppler modes.8
The tolerance limits were based on Brazilian quality control standards. For Mode B, anatomical images were generated with the simulator. The simulations were acquired at different depths. The resolution parameter was obtained by visualizing 0.1mm diameter nylon threads, which are distributed at different depths in the simulator. For transducers up to 3.5MHz, the accepted limit was 4.0mm. For probes up to 4.0MHz, the criterion adopted for visualizing targets should not exceed 2.0mm. For frequencies above 4.0MHz, the limit was set at 1.0mm. To determine contrast, cylindrical targets of different densities were visualized in the simulation images. The attenuation value of the targets was compared with the background material and compared with the simulator manufacturer's specification. For uniformity, the reference value should be equal to or less than 4.0dB from the simulator's analyzed region of interest. The analysis of this parameter considered the aspects of signal loss on the vertical and horizontal axes throughout the image. In terms of penetration depth, the target visualization limit should not exceed 6.0mm for Mode B. As for the ability to assess the separation between objects, the vertical and horizontal distance accuracy measurements should not exceed the nominal values of 1.5mm and 2.0mm, respectively. To check the accuracy of the measurements of these distances, the digital caliper of the US equipment itself is used.9-11
For the Doppler Mode, the analysis was in terms of flow. The performance parameters were associated with the directional accuracy of the flow, speed, direction of propagation and relative sensitivity to the depth of the signal. Flow performance was quantified using the spectral trace of the equipment itself. A flow pump was used to direct the fluid into the vessel, generating different flow rates. For each flow rate there is a conversion factor, which is supplied by the simulator manufacturer. The criterion adopted between the values specified by the manufacturer and the simulations with the simulator should not exceed ± 10% when determining the accuracy of the blood flow volume.12
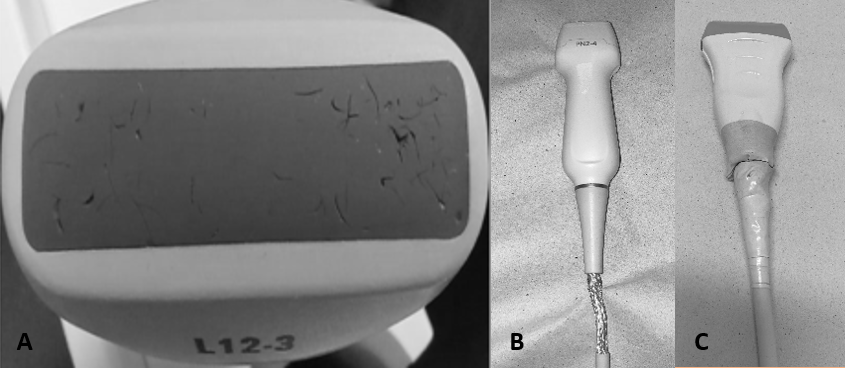
The performance evaluation of the equipments showed that 15.2% of the probes had some kind of damage to the active surface. This resulted in altered signal reverberation and loss of B-Mode uniformity. This degradation reduced image quality in superficial anatomical regions between 2.0 and 3.0cm deep. The loss of uniformity was more significant for linear transducers with frequencies above 7.0MHz. It was observed that in 8.0% of the probes evaluated there were flaws in the crystals, acoustic couplers or connection cables causing image degradation for B and Doppler Modes (figure n⁰ 02).

Figure 2 (a) damage at superficies and (b,c) damage at sector and linear transducer power cables.
Source: Author.
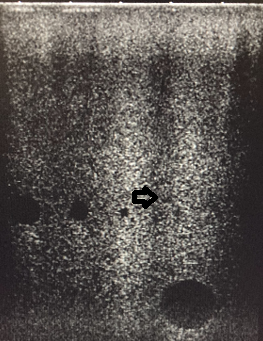
Transducers tend to represent low-contrast structures smaller than they really are and with irregular edges rather than smooth edges. These deformations are expected to be minimal. The number of visible objects, their shape, the sharpness of the edges and the noise inside should be evaluated at each depth using the simulator. When there is significant damage to the transducer, these structures can be observed with modified sizing or inappropriate echogenicity (figure n⁰ 03). By alternating the focal zone along the depth, it was possible to see consistent distortions of the targets in relation to the reference values. The hypoechoic or anechoic zones (acoustic shadows) on the vertical axis reduced the visualization of targets with dimensions of around 2.0 and 4.0 mm in 19% of the transducers (figure n⁰ 04). This directly affects the diagnostic results for nodules of different sizes and densities. For 21% of the transducers analyzed, damage to the active surface caused B-Mode artifacts, affecting the quality of the diagnostic image.

Figure 4 Reduction of image quality of the targets of 2,0, 4,0 e 6,0mm diameters due to damage at active surface.
Source: Author.
Of the total transducers evaluated 43.95% had one or more problems related to wear and tear or misuse, resulting in a loss of image quality. Physical damage to the power cables, active surface, acoustic coupler or crystals led to degradation of the US signal. The nominal targets found in the simulator could be analyzed qualitatively and quantitatively, showing that B and Doppler Modes were directly affected. In the Doppler mode the artifacts increase the gain saturation and then change the diagnostic.
The purpose of this article is to discuss the fact that changes in image quality cannot always be detected by the radiologist during examinations. Applying a benchmarking methodology can identify possible probe degradation before it becomes ineffective for diagnostic scans. It was identified reductions in the number of visible targets and changes in the sharpness of the edges, due to the increased presence of noise in the images with the simulator. These changes were more significant when alternating the focal zone for different depths. The hypoechoic or anechoic zones of acoustic shadows on the vertical axis reduced the visualization of targets with dimensions of around 2.0 and 4.0mm. The lack of quantitative criteria for evaluating the performance of the equipment restricts the determination of the reduction in echogenicity of structures.
It should be borne in mind that transducers tend to represent low-contrast structures smaller than they really are and with irregular edges rather than smooth edges. These limitations of the image acquisition method can affect diagnosis for nodules of different sizes and densities. The reduced spatial resolution between tissues and loss of echogenicity can affect the examination of breast, small parts, thyroid and carotid. When there is significant damage to the transducer, these structures can be observed with modified sizing or inappropriate echogenicity. The probes evaluated had some kind of problem, either associated with image quality and/or physical damage, and in most cases requiring a repair by corrective maintenance or replacement of the transducer.
The evaluation of image quality allowed assessing the degradation of the probes. The methodology used can be helpful to minimizing possible errors in diagnostic imaging due to inadequate performance of the US equipment.
None.
There is no conflicts of interest.

©2023 Dimenstein, et al. This is an open access article distributed under the terms of the, which permits unrestricted use, distribution, and build upon your work non-commercially.