International Journal of
eISSN: 2574-8084


Review Article Volume 5 Issue 3
1Department of Radiology, Brasileiro de Controle do Câncer, Brazil
2Department of Radiology, Santa Casa de Misericórdia de São Paulo, Brazil
Correspondence: Eduardo de Faria Castro Fleury, Department of Radiology, 1. IBCCInsituto Brasileiro de Controle do Câncer, Rua Maestro Chiaffarelli, 409, Jardim PaulistaSão Paulo/SPBrazil, ZIP 01432-030, Tel -99292
Received: April 17, 2016 | Published: June 12, 2018
Citation: Fleury EFC, Maragno B, Maragno B, et al. False negative carcinomas on breast magnetic resonance imaging: histological types, enhancement pattern and background parenchymal enhancement. Int J Radiol Radiat Ther. 2018;5(3):190-197. DOI: 10.15406/ijrrt.2018.05.00161
Background: Magnetic resonance imaging (MRI) is the most sensitive imaging method for breast cancer detection. Its introduction in breast cancer screening programs has been discussed in the last decade. Currently, in combination with mammography (the gold standard screening method), MRI is recommended to screen women at high genetic risk for developing breast cancer.
Despite its high sensitivity to detect breast cancer, few articles discuss the presence of false-negative results obtained by the MRI exam and the reasons for these results. False-negative results associated with an inadequate study method, the histological lesion type, and the background breast parenchymal enhancement pattern are reported in the literature. For example, concerning the histological type, low-grade ductal carcinoma in situ (DCIS) is considered to be related to the lack of lesion enhancement in the dynamic phases, which is a determinant for the negative result. Regarding the background enhancement pattern, it is believed that moderate and intense patterns have a higher correlation with false-negative results.
Main body: This study aims to discuss the reasons for false-negative MRI results using cases studied in our department. The discussion is based on cases of breast carcinoma diagnosis that were negative on MRI studies. The enhancement patterns of breast masses were correlated with the background enhancement pattern and the histological tumor type. The cases included DCIS, invasive ductal carcinoma, invasive lobular carcinoma, and interval carcinoma.
Conclusion: False-negative MRI results can occur in all three types of kinetic curves. All carcinomas show enhancement after the injection of contrast; however, if the enhancement is identical to the parenchyma, its presence is not noticeable. It is always important to consider the assessment of the spatial morphology of the lesion by MRI.
Keywords: breast cancer, magnetic resonance, false negative
MRI, magnetic resonance imaging; DCIS, ductal carcinoma in situ; BI-RADS, breast imaging-reporting and data system; WHO, world health organization; ERs, estrogen receptors; PRs: progesterone receptors; Her2, c-erB-2; CAD, computer-aided detection; MIPs, maximum intensity projections; FAST, fast MRI protocols
Magnetic resonance imaging (MRI) of the breast has been widely used to detect and evaluate breast carcinomas, as an imaging method complementary to mammography, which is considered the gold standard.1Currently, the indications for breast MRI are well established. This propaedeutic method is important for the therapeutic follow-up of neoadjuvant treatment, evaluation of breast implants, screening in high-risk patients (2% of patients), preoperative staging of breast carcinoma, searching for hidden carcinoma, and evaluation of papillary flow.2,3
MRI is the most sensitive diagnostic method for the detection of breast lesions and allows for determining the functional part of the lesion via injection of the paramagnetic agent to obtain the dynamic kinetic curve.2–6 The normal breast parenchyma may also present enhancement by contrast in MRI, which is known as background parenchymal enhancement, a term integrated in the latest edition (5th edition) of the Breast Imaging-Reporting and Data System (BI-RADS) lexicon. This enhancement may be classified according to its intensity as minimal (<25% of the fibroglandular tissue is enhanced), mild (25%-50% of parenchymal enhancement), moderate (50%-75% of parenchymal enhancement), and marked (>75% of background parenchymal enhancement) (Figure 1).7–9
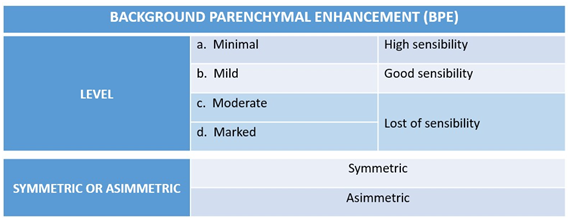
Figure 1 Fibroglandular tissue contrast-enhancement patterns according to the BI-RADS lexicon. Background parenchymal enhancement pattern of the breast related to the sensitivity of MRI.
In general, the typical background parenchymal enhancement is symmetrical, bilateral, and diffusely distributed. However, some factors may interfere with its interpretation, such as the vasculature of the breast, the permeability of the contrast agent, and endogenous and exogenous hormonal influences.7–9 Several studies show the high sensitivity of MRI, but they highlight the low specificity of the method (false positives). Critics attribute this feature to “overdiagnosis” and “overtreatment”.1 However, there are few studies that discuss the reasons for false-negative MRI results.
The following main factors can contribute to false-negative results in MRI: the histomorphology of tumors, either because of small size (<4-5mm) or because of histology, for example, lobular carcinomas and ductal carcinoma in situ (DCIS) often do not present as masses; technical aspects of the examination, such as artifacts (Figure 2); and the need to correlate the clinical findings and personal history (BRCA mutation, hormonal status, breast cancer history).10 In this sense, other studies that investigated the reasons for false-negative results in MRI screening in high-risk women also reported that the phase of the menstrual cycle can negatively interfere with the interpretation of the test, similarly to intense background enhancement, resulting in up to a 30% false-negative diagnosis (Figure 3). In addition, interpretation errors and inter-observer perception should also be considered when analyzing breast cancer images.10,11

Figure 2 Improper study technique. (a) Pre-contrast. (b) Post-contrast. (c) Image subtraction. The subtraction has noise artifacts resulting from patient movement between the acquisitions of (a) and (b).

Figure 3 Background parenchymal enhancement. (a) Examination performed on 03/2015. (b) Control after 6 months of the study (09/2015) in a 37-year-old patient. Alteration of the background parenchymal enhancement is evident, which is most likely related to the phase of the menstrual cycle at the time of examination.
The analysis of breast MRI consists of two evaluations: lesion morphology and kinetics of the region of interest. The first uses specific coils and high-field devices that allow for better spatial resolution of the method. The second determines the contrast uptake pattern via intravenous injection of the paramagnetic agent. For the final classification, according to the criteria proposed by the BI-RADS lexicon, the two analyses should be considered together.4
The objective of this review is to present a series of false-negative results related to the enhancement of breast carcinomas through lesions with little contrast enhancement in relation to healthy breast parenchyma. The lesions were divided according to the histological type, nuclear grade, immunohistochemical profile, and tumor enhancement pattern according to the kinetic curve compared with the background breast parenchymal enhancement.
DCIS
DCIS results from the proliferation of epithelial cells confined to the basal membrane of the terminal ductal lobular unit.12 This carcinoma belongs to a heterogeneous group of lesions and its classification, based on nuclear grade, categorizes it as low, intermediate, and high grade.13 Low-grade DCIS is composed of small and regular cells, while high-grade DCIS presents large, pleomorphic cells with frequent mitotic figures and sometimes exhibits associated necrosis. The intermediate grade has characteristics of both the low- and high-grade subtypes.14
DCIS, being well differentiated, may have the same enhancement pattern of normal fibroglandular tissue in low-grade cases. It is believed that only 50% of these low-grade lesions progress to more-aggressive patterns.15 In these cases, additional findings in the non-contrast sequences (morphologic sequences) as well as comparison with previous studies may aid in the definitive diagnosis of the lesion. Figure 4 presents a case of architectural distortion in a patient with two consecutive MR examinations (Figure 4). Complementation with additional second-look ultrasound study may aid in the definitive diagnosis. Usually malignant lesions are seen in this targeted study.
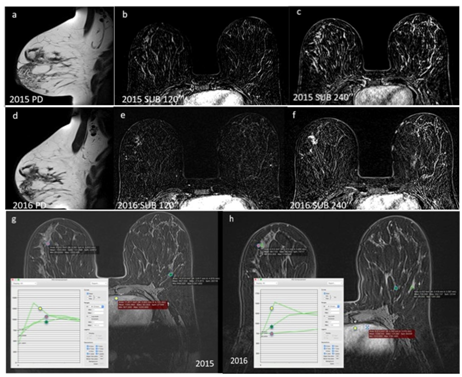
Figure 4 DCIS in a 33-year-old patient with a familial risk for breast cancer. (a, b, c) Proton density (a), subtraction after 2 minutes (b), and subtraction after 4 minutes (c) in a screening test performed in 2015. There is architectural distortion in (a), which is not represented in the dynamic phases (b and c). The lesion was classified as BI-RADS category 4. The patient did not undergo a biopsy and chose control after 1 year.
(d, e, f) Proton density (d), subtraction after 2 minutes (e), and subtraction after 4 minutes (f) in the study 1 year after. The architectural distortion in the right breast remains unchanged (d), however, now with contrast enhancement in the dynamic phases (e and f). The lesion remained classified as BI-RADS 4.
(g and h) Dynamic curves of the 2015 (g) and 2016 (h) studies. The kinetic curve pattern is altered during the two years, and in (h) there is a greater difference between the suspected area and the normal fibroglandular tissue in the contralateral breast. The curves are compared with the cardiac curves, considered as a washout, pattern III.
The background parenchymal enhancement is smaller in the 2016 images, type I curve (h) compared with 2015, type II curve (g). The enhancement of the lesion and the heart remain unchanged, indicating that the lesion was not more vascularized, but that instead there was loss of background parenchymal enhancement.
Ultrasound of the suspected area (i) Where an irregular mass is observed. In the elastography study (left picture), the lesion appears as hard.
(j and K) Percutaneous biopsy fragments in lower (j) and higher magnification (k) diagnosed as DCIS.
Invasive ductal carcinoma
Invasive breast cancers have different histological and molecular characteristics. According to the World Health Organization (WHO), invasive carcinoma is morphologically classified into 21 distinct subtypes.16 However, the three large histological groups of carcinomas include non-special type (ductal), lobular, and special subtypes.17
A large proportion of breast tumors (70%) are ductal (non-special type), and the diagnosis is made by the exclusion of special subtypes. They do not present histological distinctiveness and can be classified according to the histological and nuclear grade, being more or less differentiated (Figure 5) (Figure 6).17–19 Low-grade carcinomas tend to be more differentiated, being similar to original tissue. This makes tumor's enhancement very similar to breast parenchyma enhancement, which may result in false-negative results in the dynamic phases. Especially depending on the menstrual cycle phase, where preference should be given to performing the study in the early period (luteal phase) (Figure 5).
On the other hand, high-grade carcinomas should have greater enhancement than breast parenchyma because they are histologically less differentiated. However, depending on the background parenchyma enhancement pattern, even high-grade tumors may not be seen in the dynamic sequences (Figure 6).

Figure 5 Low-grade invasive ductal carcinoma in a 55-year-old patient, who showed an alteration on mammography. (a, b, c, d, e, f, g) Proton density (a), short TI inversion recovery (STIR) (b), pre contrast (c), 1 minute after contrast (d), 1 minute after contrast subtraction, (e) 4 minutes after contrast subtraction (f), and dynamic curves of the regions of interest (g). The anatomical sequence (a) shows an irregular mass on the superolateral quadrant, with high signal intensity in the T2-weighted sequence (b). After injection of the contrast, there is no significant enhancement of the mass in relation to the background parenchymal enhancement (e and f). Findings illustrated in the dynamic curves (g).
(h and i) Percutaneous biopsy fragments at lower (h) and higher magnification (i) diagnosed as low-grade invasive ductal carcinoma.

Figure 6 High-grade invasive ductal carcinoma in a 55-year-old patient with a palpable mass in the right breast in the medial quadrants. (a, b, c, d, e, f, g, h and i) Pre contrast phase (a); 1 minute after the contrast (b); 2 minutes after the contrast (c); 3 minutes after the contrast (d); 4 minutes after the contrast (e); kinetic curve of normal fibroglandular tissue in the lateral quadrants of the left breast, green arrow (f); dynamic curve of the breast mass in the medial quadrants of the right breast, red arrow (g); axial MIP reconstruction (h); coronal MIP reconstruction (i). The enhancement pattern of the breast mass is similar to the background parenchymal enhancement of the contralateral breast. Both studied areas show a type III (washout) pattern curve in the dynamic curves (f, g). It is not possible to differentiate the suspected area in the MIP images (h, i).
Immunohistochemistry is routinely assessed in breast carcinomas. Estrogen receptors (ERs) and progesterone receptors (PRs), which are hormone receptors; Ki67, which represents cell proliferation; and oncoprotein c-erbB-2 (HER2), which indicates tumor aggressiveness, are primarily examined. Therefore, more differentiated tumors have positive hormone receptors and low proliferation and aggressiveness indexes.
The molecular subtypes of breast cancer are stratified from the quantification of the expression of these markers. Thus, luminal A tumors have positive hormone receptors, are HER2-negative, and have Ki67<14% and a more favorable prognosis. Luminal B tumors have positive hormone receptors, are HER2-positive or HER2-negative, and have Ki67>14%. The vast majority, approximately 70% of invasive carcinomas, are hormone-receptor-positive and therefore eligible for antiestrogen therapy.20 The HER2-positive tumors comprise 12 to 20% of malignant breast tumors. When this marker is overexpressed, with a higher Ki67, the tumors are associated with a worse prognosis, but are eligible for targeted therapy.
Finally, approximately 10-15% of breast cancers are triple-negative, i.e., they do not express any markers of hormonal receptors or HER2 and, at present, have no targeted therapy, presenting a worse prognosis (Figure 7).16,21
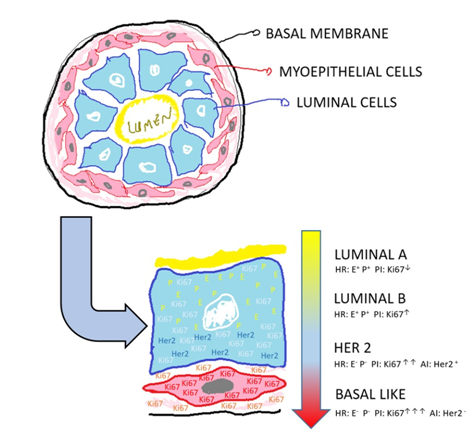
Figure 7 Immunohistochemical profile. Schematic representation of the terminal duct lobular unit of the breast duct, in cross-section, which correlates the immunohistochemical profile of the breast carcinoma, from more differentiated (luminal A) to less differentiated (basal like), where AI (aggressiveness index), PI (proliferation index), HR (hormone receptors), E (estrogen), P (progesterone) and c-erbB-2 (HER 2).
DCIS
DCIS results from the proliferation of epithelial cells confined to the basal membrane of the terminal ductal lobular unit.12 This carcinoma belongs to a heterogeneous group of lesions and its classification, based on nuclear grade, categorizes it as low, intermediate, and high grade.13 Low-grade DCIS is composed of small and regular cells, while high-grade DCIS presents large, pleomorphic cells with frequent mitotic figures and sometimes exhibits associated necrosis. The intermediate grade has characteristics of both the low- and high-grade subtypes.14
DCIS, being well differentiated, may have the same enhancement pattern of normal fibroglandular tissue in low-grade cases. It is believed that only 50% of these low-grade lesions progress to more-aggressive patterns.15 In these cases, additional findings in the non-contrast sequences (morphologic sequences) as well as comparison with previous studies may aid in the definitive diagnosis of the lesion. Figure 4 presents a case of architectural distortion in a patient with two consecutive MR examinations (Figure 4). Complementation with additional second-look ultrasound study may aid in the definitive diagnosis. Usually malignant lesions are seen in this targeted study.
Invasive ductal carcinoma
Invasive breast cancers have different histological and molecular characteristics. According to the World Health Organization (WHO), invasive carcinoma is morphologically classified into 21 distinct subtypes.16 However, the three large histological groups of carcinomas include non-special type (ductal), lobular, and special subtypes.17
A large proportion of breast tumors (70%) are ductal (non-special type), and the diagnosis is made by the exclusion of special subtypes. They do not present histological distinctiveness and can be classified according to the histological and nuclear grade, being more or less differentiated (Figure 5) (Figure 6).17–19 Low-grade carcinomas tend to be more differentiated, being similar to original tissue. This makes tumor's enhancement very similar to breast parenchyma enhancement, which may result in false-negative results in the dynamic phases. Especially depending on the menstrual cycle phase, where preference should be given to performing the study in the early period (luteal phase) (Figure 5).
On the other hand, high-grade carcinomas should have greater enhancement than breast parenchyma because they are histologically less differentiated. However, depending on the background parenchyma enhancement pattern, even high-grade tumors may not be seen in the dynamic sequences (Figure 6).
Immunohistochemistry is routinely assessed in breast carcinomas. Estrogen receptors (ERs) and progesterone receptors (PRs), which are hormone receptors; Ki67, which represents cell proliferation; and oncoprotein c-erbB-2 (HER2), which indicates tumor aggressiveness, are primarily examined. Therefore, more differentiated tumors have positive hormone receptors and low proliferation and aggressiveness indexes.
The molecular subtypes of breast cancer are stratified from the quantification of the expression of these markers. Thus, luminal A tumors have positive hormone receptors, are HER2-negative, and have Ki67<14% and a more favorable prognosis. Luminal B tumors have positive hormone receptors, are HER2-positive or HER2-negative, and have Ki67>14%. The vast majority, approximately 70% of invasive carcinomas, are hormone-receptor-positive and therefore eligible for antiestrogen therapy.20 The HER2-positive tumors comprise 12 to 20% of malignant breast tumors. When this marker is overexpressed, with a higher Ki67, the tumors are associated with a worse prognosis, but are eligible for targeted therapy.
Finally, approximately 10-15% of breast cancers are triple-negative, i.e., they do not express any markers of hormonal receptors or HER2 and, at present, have no targeted therapy, presenting a worse prognosis (Figure 7).16,21
Lobular carcinoma
Lobular carcinoma represents fewer than 10% of breast tumors and is characterized by the loss of cell adhesion that gives a histological aspect of a “single file” pattern, where, in the immunohistochemical evaluation, the loss of e-cadherin is evident. In addition, this carcinoma shows diffuse and infiltrative growth in the breast glands, with a tendency toward bilateralism. Moreover, lobular carcinomas usually present a lower histological grade and hormone receptors in the highly positive tumors.16 Due to tumor invasion of this carcinoma, and the lobular anatomy, and because they are generally of the low grade carcinoma, MR diagnosis can be compromised. Clinical data as a palpable mass should be valued (Figure 8).

Figure 8 Invasive lobular carcinoma in a 65-year-old patient, presenting volume reduction and hardening of the left breast. (a, b) Pre-contrast phase in the tumor region (a) and 4 minutes after contrast injection (b). (c, d) Pre-contrast phase in the background parenchyma of the right breast (c) and 4 minutes after contrast injection (d).
Comparison of the dynamic curves in the tumor region with the background parenchyma and the heart (e). The mass and the background parenchyma show type I curves (ascending) while the heart exhibits a pattern III curve (washout).
MIP reconstruction (f) of the breasts; it is impossible to observe the mass in the left breast.
Proton density sagittal image (g) showing architectural distortion of the left breast in the upper quadrants, associated with retraction of the papillary-areolar complex.
(h, i, j, k, l, m) Histological section of the fragment (h); progesterone (i) and estrogen (j) receptor markers; c-erB-2 marker (k); and e-cadherin (l) and ki67 (m) markers. There is a single-file cell distribution (h), with positive hormone receptors (i, j), c-erB-2 score 3 (k), negative e-cadherin marker (l), and 30% ki67 marker (m).
Tumor enhancement pattern relative to the fibroglandular tissue
The breast parenchyma may exhibit enhancement by paramagnetic contrast and, according to the degree of enhancement, can be classified as minimal, mild, moderate, and marked. Just as the increased density of the breast tissue can affect the mammographic interpretation, the presence, pattern, and enhancement degree of the breast parenchyma can affect the accuracy of the interpretation of MRI images,8 reducing the sensitivity of the method.
For most lesions, the kinetic analysis is highly heterogeneous, and thus the most suspicious area is the one that should be reported. Kinetic analysis may be assisted by color map images (based on a pixel-by-pixel curve analysis) and/or may be generated manually or by computer-aided detection (CAD) systems, involving the evaluation of two distinct phases: early (initial phase) and late (late phase)22 (Figure 9).
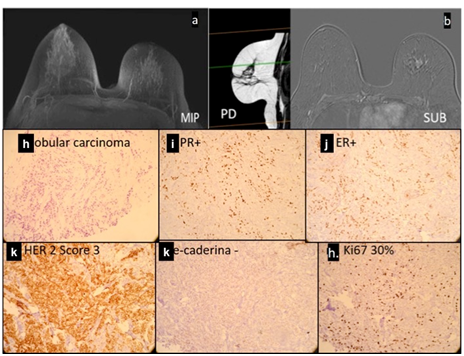
Figure 9 Enhancement kinetics of breast MRI. Schematic representation of the kinetic curves (signal intensity x time). Type I curve, persistent (green line), type II curve (yellow line), and type III curve (red line).
Initial phase: considers the first 2 minutes after contrast injection and is subdivided as follows:
Late phase: considers the enhancement pattern after the first 2 minutes of the curve (initial phase) and is subdivided as follows:
The images can also be reconstructed into maximum intensity projections (MIPs) in the first 2 minutes; these images are used in fast MRI protocols (FAST), called MRI mammography.
Typical enhancement pattern
The typical enhancement pattern of breast carcinoma consists of an initial phase with a rapidly increasing signal followed by later phases of the plateau or washout type. In turn, the fibroglandular tissue has a slow initial phase followed by a persistent late phase. The difference between the two enhancement patterns (delta - ∆) is quite evident, especially in the first 2 minutes (Figure 10).23
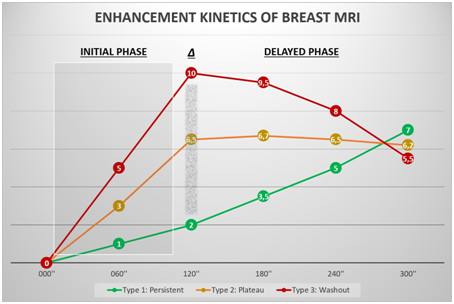
Figure 10 Typical presentation of breast carcinoma in a 45-year-old patient. The kinetic curve compares the breast lump enhancement with the background parenchymal enhancement. The area corresponding to the difference between the enhancements is considered the delta area (Δ). The larger this area is, the more suspicious the lesion is because it is more vascularized.
Most invasive breast carcinomas show kinetic enhancement curves of type II (plateau) and III (washout); however, atypical forms of presentation may occur, such as those demonstrated in the case series, in which there are type I curves (ascending), generally present in benign lesions.4 Just as there is variation in the enhancement of carcinomas, depending on their angiogenesis, the enhancement
Ascending curve pattern (Type I)
More differentiated lesions, such as low-grade luminal carcinoma and DCIS may have an enhancement pattern similar to normal fibroglandular tissue, which may be represented on the dynamic curve as the ascending or plateau type, resulting in a false-negative diagnosis. Schimauchi et al.,23 in a population of 220 patients diagnosed with breast cancer, demonstrated a false-negative rate of 3.2% (seven cases) on MRI, of which four cases corresponded to DCIS.23
In these cases, both the breast parenchyma and the carcinoma present a type I curve. These findings are generally found in well-differentiated lesions, such as low-grade invasive carcinomas and DCIS4,23 (Figure 11). Of the malignant lesions, approximately 8.9% present this curve pattern.24

Figure 11 Type I curve pattern (persistent) in a patient with an invasive lobular carcinoma in the left breast. The curve pattern of the background parenchymal enhancement is similar to that of the mass, with Δ area almost imperceptible, which impairs the visualization of the lesion.
Plateau curve pattern (Type II)
Despite the high sensitivity of the method in this type of curve, in scenarios with moderate or marked enhancement of the parenchyma, it is possible that mass or non-mass enhancement areas can be masked by adjacent enhancement of the breast tissue. In these cases, it is almost impossible to characterize suspicious lesions.
In these cases, both the breast parenchyma and the carcinoma present a type II curve. These findings are commonly found in lesions with moderate atypia, as well as in carcinomas overexpressing HER-2 (Figure 12). Among the malignant lesions, approximately 33.6% show this curve pattern.24
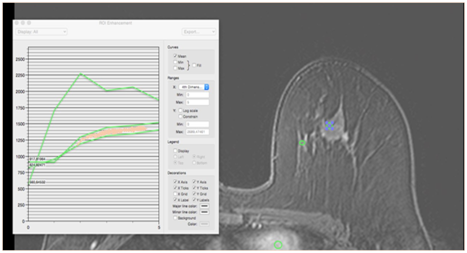
Figure 12 Type II curve pattern (plateau) in a 43-year-old patient with an intermediate-grade invasive ductal carcinoma in the superolateral quadrant of the left breast, HER 2 positive. Both the lump and the fibroglandular tissue present a type II kinetic curve, with Δ area virtually nonexistent. The diagnosis was facilitated by clinical data because it was a palpable lesion.
Washout curve pattern (Type III)
The presence of this enhancement pattern is uncommon in the normal breast parenchyma. It may be related to the phase of the menstrual cycle of the patient, where in the luteal phase, the breast is more vascularized and turgid. Thus, the MRI examination is more appropriate during the first phase of the menstrual cycle, namely, the follicular phase.
This curve is most suspicious for malignancy when present in the mass, and the anatomic-pathologic correlation is indicated regardless of the morphology of the lesion. Among the malignant lesions, approximately 57.4% show this curve pattern. More aggressive, high-grade, undifferentiated, and basal-like carcinomas will generally display this pattern (Figure 13).24

Figure 13 Type III curve pattern (washout) in a 38-year-old patient with a high-grade carcinoma in the right breast. Image 4 minutes after contrast injection in the medial quadrants of the right breast and the background parenchyma in the superolateral quadrant of the left breast. (a) Kinetic curve of the background parenchymal enhancement in the left breast. (b) Kinetic curve of the breast mass in the right breast. (c) MIP reconstruction of the first 2 minutes after contrast injection. Both the right breast mass and the breast parenchyma show the same enhancement pattern (a), characterized by a dynamic type III curve (b and c). It is not possible to differentiate the mass in the MIP sequence. (d) On clinical examination, the patient had an enlarged right breast that was hardened, with inflammatory signs.
Interval carcinoma
Interval cancers include carcinomas diagnosed after a negative imaging screening for breast cancer and before the next screening examination is performed. They are revealed by clinical alteration (Figure 14) (Figure 15).25
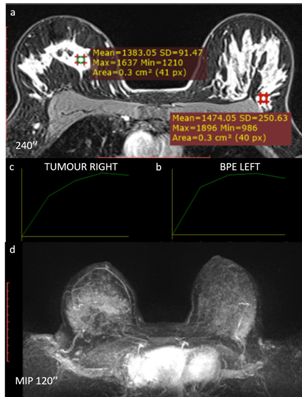
Figure 14 Interval carcinoma. Fifty-one-year old patient presenting an undifferentiated left breast carcinoma with overexpression of the HER-2 receptor. The patient underwent targeted therapy. (a, b) subtraction image 2 minutes after contrast injection on 01/2016 (a) and 4 minutes after contrast injection (b) in the examination prior to neoadjuvant targeted therapy. (c, d) subtraction image 2 minutes after the contrast on 04/2016. (c) and 4 minutes after contrast injection. (d) for evaluation of the therapeutic response.
(e, f) Comparison of the kinetic curves of the lesions before (e) and after (f) the targeted therapy.
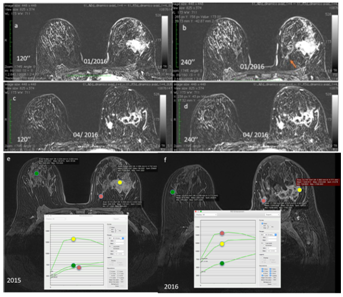
Figure 15 In the pre-targeted therapy images (a and b), there is a mass enhancement in the lateral quadrants of the left breast. There is also a small focal enhancement in the medial quadrants of this breast (orange arrow).
After the targeted therapy, there was a partial response to therapy, with areas of necrosis interposed in the mass in the lateral quadrants and growth of the focus in the medial quadrants, indicating lack of response of the lesion. These findings are generally related to triple-negative/basal-like carcinomas (f).
Kinetic curves pre-targeted therapy show a type III curve for breast carcinoma and type I curves for the background parenchyma and for the focal enhancement (e).
Kinetic curves after targeted therapy show a type III curve for the focus that grew in the medial quadrants, a type II pattern for the breast carcinoma (indicating a response to treatment), and a type I pattern for the background breast parenchyma (f).
The average doubling time of a breast carcinoma is estimated to be 1.7 years to grow from 1.0 cm to 2.0cm. The screen test sensitivity estimated for mammography increases rapidly with tumor size, ranging from 26% for 0.5 cm tumors to 91% for 1.0 cm tumors.26
When considering the immunohistochemical profile of breast carcinomas, Ryu et al.,27 postulated that the average tumor doubling time among all tumors is 193+/-141 days (ranging from 46 days to 825 days; median, 141 days). For tumors with positive ERs, it is 241+/-166 days. For tumors positive for HER2 receptors, it is 162+/-60 days. Finally, triple-negative cancers would have a doubling time of 103+/-43 days.
Considering these data, the interval carcinomas detected are expected to mostly represent triple-negative carcinomas, and the carcinomas detectable in screening programs are expected to represent luminal tumors.
False-negative MRI results can occur in three types of kinetic curves. All carcinomas show enhancement after the injection of contrast; however, if the enhancement is identical to the parenchyma, its presence is not noticeable. Thus, it is always important to consider the assessment of the spatial morphology of the lesion by MRI. In addition, for the final classification according to the BI-RADS lexicon, the most suspicious findings should be considered, whether it is the morphology or the enhancement pattern of the lesion.
To reduce the possibility of false-negative results, the interpretation of the study should always take into account the clinical data of the patient, such as the presence of lesions with active palpation and the evaluation of previous mammograms, without underestimating the current mammographic findings, even in the absence of MRI matching. It is concluded, therefore, that no test has 100% diagnostic accuracy.
Ethics approval and consent to participate: Approval by the ethics committee was waived due to the nature of the work.
Consent for publication: Consent for publication of diagnostic images was obtained from all of the patients.
Availability of data and material: The datasets generated and/or analyzed during the current study are not publicly available due are from particular patients, but are available from the corresponding author on reasonable request.
Funding: No fundings.
Authors' contributions: EFCF conceived the study.
All authors took part in drafting the article or revising it critically for important intellectual content. All authors read and approved the final manuscript.Not applicable.
The author declares that they have no competing interests.

©2018 Fleury, et al. This is an open access article distributed under the terms of the, which permits unrestricted use, distribution, and build upon your work non-commercially.