International Journal of
eISSN: 2574-8084


Research Article Volume 11 Issue 5
1Richard Semelka Consulting, PLLC, Chapel Hill, North Carolina, USA
2Department of Radiology, Hospital da Luz, Lisbon, Portugal
Correspondence: Richard Semelka, MD. Richard Semelka Consulting, PLLC, 3901 Jones Ferry Road, Chapel Hill, NC 27516, USA
Received: September 20, 2024 | Published: October 4, 2024
Citation: Semelka RC, Ramalho M. Abnormal enhancement of the diseased upper digestive tract shown on MRI. Int J Radiol Radiat Ther. 2024;11(5):137-140. DOI: 10.15406/ijrrt.2024.11.00401
This review article describes the imaging techniques, interpretation, and findings of inflammatory changes in the upper digestive tract, including the distal esophagus, stomach, duodenum, jejunum, and ileum. These are the least understood of all abdominal imaging observations and, hence, rarely described in reports. Upper digestive tract imaging findings are poorly understood at present. An illustration of inflammation of all these segments is reported herein.
MRI is the optimal technique for studying Leaky Gut, Irritable Bowel Syndrome, and Splanchnic Metabolic Syndrome. This opens new avenues of research and clinical interpretation.
Keywords: MRI abdomen, MRI gastrointestinal tract, small bowel, stomach, esophagus
Over the last decade, increasing attention has been paid to the digestive tract as the root source of many disease processes throughout the body.1-7 To the present time, it has been considered that imaging does not play a significant role in identifying diseases that may exhibit mild inflammatory changes of the upper digestive tract, such as Leaky Gut,8 irritable bowel syndrome (IBS),9 and the (Splanchnic) Metabolic Syndrome.10,11 It has been considered that imaging findings of digestive tract abnormalities were not present.12
Recent publications have described the Splanchnic Inflammatory Syndrome (SIS),13,14 which represents the imaging findings of Splanchnic system clinical diseases that result from inflammation and involve any number of organs in the splanchnic system: upper digestive tract, pancreas, spleen, gallbladder and biliary tree, and liver. The most poorly recognized abnormalities on imaging studies are entities that substantially involve the upper digestive tract, such as Leaky Gut, IBS, and the bowel manifestations of the (Splanchnic) Metabolic Syndrome. These entities represent the clinical states, whereas SIS represents the Imaging findings of these states. The imaging findings are often much more extensive and involve more organs/ tissues than anticipated by the clinical conditions. The lack of clinical appreciation primarily reflects that these tissue/organ findings may not result in clinical symptomatology that is presently recognized. SIS imaging findings include abnormalities of all organs in that relatively contained system: liver, spleen, gallbladder, biliary tree, pancreas, mesentery, and upper digestive tract. The imaging findings of many of these organs are readily observed based on prior reports describing the features: fatty liver, cholecystitis, pancreatic cysts, and mesenteric panniculitis.
Of all these organ systems, recognition of digestive tract findings is most poorly understood and hence greatly under-reported, both in research and in clinical studies, and hence, they are generally overlooked. This reflects that the dominant imaging modalities used to assess the abdomen for inflammation, ultrasound, and CT have significant limitations. Due to its low cost, ultrasound is broadly used in abdominal studies. It experiences significant limitations in imaging the bowel because of the extreme artifacts generated by air, which thus generally results in uninterpretable findings of the upper digestive tract. CT is effective at demonstrating morphological abnormalities such as mural thickening or mural masses but has a limited ability to show the increased density of inflammation postcontrast due to its lesser sensitivity to Iodine-Based Contrast Agents (IBCAs). In contrast, Gadolinium-based contrast agents (GBCAs) reveal significantly increased signal of tissues even when the extent of inflammation is mild. Hence, GBCA-enhanced MRI is vastly superior to IBCA-enhanced CT for demonstrating mild to moderate inflammation. Due to the heavy reliance on CT to evaluate bowel imaging studies, the lack of appreciation of mild to moderate inflammation on CT has resulted in the misconception that inflammation due to mild inflammation, such as IBS, is not evident in imaging studies. The assumption in the gastroenterology community is that since the findings of IBS are not observed on CT, they are not identifiable by imaging. The problem has been that MRI using modern MR sequences has yet to be investigated to show whether it has utility to identify inflammation of the upper digestive tract in conditions like leaky gut, IBS, and (Splanchnic) Metabolic Syndrome.
This report illustrates the common appearance of digestive tract findings of SIS. It represents a text atlas of findings in the esophagus, stomach, duodenum, jejunum, and ileum. Once seen, if understood, they cannot be unseen.
MR technique
Image quality is highest on newer (less than 5-year-old) MR systems. Standard abdominal imaging sequences are used: 3D Dixon including in-phase and out-of-phase T1 imaging; 3D fat-suppressed imaging pre-contrast; GBCA-enhanced in the hepatic arterial dominant phase (late hepatic arterial); and serial post-contrast. The majority of imaging is in the transverse plane. Coronal imaging at about 3 minutes postcontrast is helpful. The postcontrast acquisitions we obtain are: 30 sec (hepatic arterial dominant) axial, 1 minute(early venous phase) axial, 2 minute axial, 2.5 minute coronal, and 5 minute (late venous phase) axial. Divergent from our classic short MR protocol, it is imperative to perform transverse 3D fat-suppressed imaging at 5 minutes to assess the late venous phase of enhancement. This is imperative as late venous phase enhancement for digestive tract inflammation is maximal at that point. Some experience suggests that if peritoneal metastases are being evaluated for that, an additional even later acquisition at 8-10 minutes reveals small volume peritoneal metastases at maximal enhancement.
MR interpretation
Several critical points are not generally understood, so they will be clearly stated here. Normal mural enhancement of the digestive tract parallels the enhancement of muscle elsewhere. We use the nearby skeletal muscle for comparison on the same plane as the digestive tract. So paraspinal muscle and psoas muscle are good comparators.
Evaluation of all segments of the upper digestive tract and mural thickness follow the same basic strategy (the exception is that the gastric wall is thicker than the other segments, and there is also a greater tendency for dependent collapse. We attempt to use the anterior wall for all bowel assessments as much as possible. > 5 mm. We generally use it as a cut-off for abnormalities if it is thicker than that. Increased early enhancement observed on late hepatic arterial dominant phase represents increased capillary perfusion, which is a marker of more acute inflammation and of moderate to severe nature. Increased enhancement at 5 minutes reflects prolonged retention in the extracellular matrix (interstitial space), seen in acute and chronic inflammation. Single-shot T2 weighted images are acquired with and without some form of fat suppression. Diffusion-weighted imaging was also acquired.
Our standard is to visually compare each digestive system segment with surrounding organs/ tissues. For the distal esophagus, we use adjacent IVC and aorta; for the stomach, duodenum, jejunum, and ileum, we use adjacent renal cortex, adjacent pancreas (if normal), and vessels.
The following grading is then used
Minimal: bowel segment < 5 mm, enhancement minimally greater than striated muscle but significantly less than renal cortex, pancreas.
Mild: bowel segment < 5 mm, enhancement clearly greater than striated muscle but less than renal cortex on arterial and venous phase images.
Moderate: The bowel segment is> 5 mm, and enhancement is close but less than the renal cortex on arterial images. It approaches/is equivalent to the renal cortex on venous phase images.
Moderately severe: bowel segment > 5 mm, enhancement approaches renal cortex on arterial and equivalent on venous images. Equivalent to opacified IVC and aorta.
Severe: The bowel segment is> 5 mm, and enhancement approaches the renal cortex on the arterial and equivalent venous images. Equivalent to opacified IVC and aorta. Complications present, e.g., abscess, perforation.
We avoid describing minimal findings as abnormal if the individual reports no symptoms of abdominal disease, e.g., no abdominal pain, no gastroesophageal reflux. We believe minimal inflammation may reflect the changes inherent to a diet high in ultra-processed food or due to underlying stress, and that stress may require an MRI study.
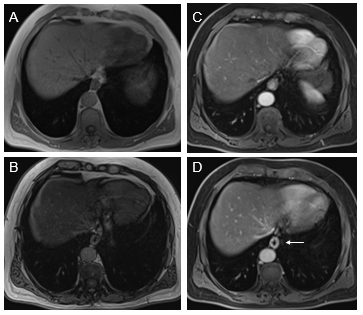
Esophagus: The esophagus of all upper digestive tract segments is the most commonly involved in the SIS, even in conditions that should predilect the jejunum, such as IBS. The most common appearance is mild inflammation. We have not seen examples of moderately severe or severe disease, and usually, enhancement on arterial images is normal, and the appreciation of inflammation is based on the increased enhancement on venous phase images. As the esophagus is in a fixed location and transverse images show a nice doughnut configuration, abnormal enhancement is most readily performed in this segment (Figure 1). Moderately severe to severe disease, most commonly, we have observed in conditions of infection such as candidiasis.

Figure 1 Axial T1-weighted GRE images. In-phase (A) and out-of-phase (B), exhibit signal drop of liver on out-of-phase images consistent with moderate steatosis. Moderately severely increased distal esophagus enhancement is well appreciated in the interstitial phase (arrow, D). The increased enhancement is suboptimal in the arterial phase images (C).
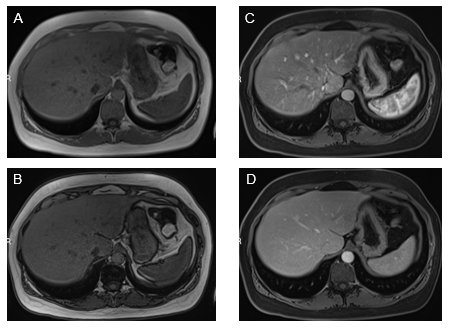
Stomach: The antral region of the stomach is the gastric portion that most commonly shows findings of inflammation (Figure 2). Increased enhancement in the arterial and venous phases is not uncommon. In the gastric portion, submucosal sparing or edema is commonly observed as a thin strip that lacks enhancement. Diffuse gastric enhancement can also be appreciated. Usually, this confers a more serious inflammatory condition of the stomach, such as moderately severe disease.

Figure 2 Axial T1-weighted GRE images. In-phase (A) and out-of-phase (B), show minimal signal drop of the liver on out-of-phase images consistent with mild steatosis. Increased mural enhancement of the stomach is better perceived in the arterial phase images (C).
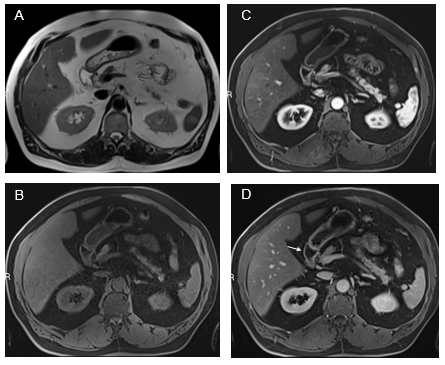
Duodenum: Inflammation restricted to the first and second portions of the duodenum is the most frequent pattern (Figure 3). Attention must be paid to the gallbladder wall, as sympathetic inflammation of the adjacent gallbladder wall is not uncommon in moderate severity of disease. Also, inflammation of the ampullary region not uncommonly causes dilation of the CBD and pancreatic duct, with increased mural enhancement. Acute acalculous cholecystitis and biliary duct dyskinesia, we now consider the secondary processes of prominent duodenal inflammation, and management of these biliary abnormalities should start with treating duodenal inflammation. Full involvement of the duodenum does occur, and the severity of inflammation is usually at least moderate when the entire duodenum is involved. Inflammatory enhancement is not uncommonly observed on both arterial and venous phase images.

Figure 3 Fatty liver with simultaneous upper GI inflammation. Axial T2-weighted images (A). Axial T1-weighted GRE images pre-contrast (B) and acquired in the arterial phase (C) and the interstitial phase (D). Increased mural enhancement of the stomach, duodenum and jejunum is observed, and more conspicuous in the interstitial phase (arrows, D).
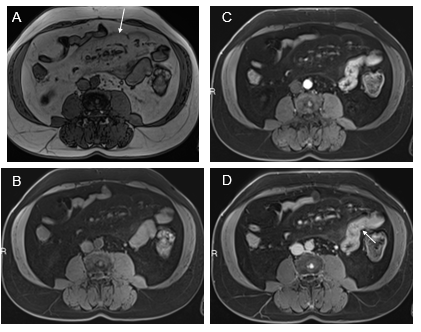
Jejunum: We have observed three patterns of jejunal increased enhancement: patchy discontinuous increased enhancement (seen most often on both arterial and venous phase images) (Figure 4); uniform increased enhancement on both arterial and venous phase images; and late venous phase serosal enhancement. This last phase can occur together with the other two patterns. Associations with the late serosal enhancement include mesenteric panniculitis (mesenteric panniculitis is always associated with late serosal enhancement, but mesenteric panniculitis is relatively uncommon in the setting of late serosal enhancement, maybe 10-20% of cases. Our current opinion is that small pancreatic cysts are observed in individuals with late serosal enhancement. Overall, our opinion is that inflammation spreads from the jejunum to the mesentery, causing mesenteric panniculitis (Figure 4) and to the pancreas, resulting in cysts and IPMNs. On occasion in moderate and greater severity inflammation, the adjacent descending colon also shows sympathetic inflammation.

Figure 4 Increased jejunal enhancement and mesenteric panniculitis. Axial T1-weighted out-of-phase (a), pre-contrast (B), arterial phase (C), and interstitial phase (D) images. Out-of-phase images (A) exhibited the greatest clarity for depicting mesenteric panniculitis. On out-of-phase images, the mesenteric fat is mild gray in signal (arrow, A) and has definable margins against a background of higher signal peritoneal fat. Occasional subcentimeter lymph nodes are commonly seen. Note on arterial phase image the mesenteric panniculitis is only minimally evident. Note the increase spacing of jejunal loops (similar to fatty proliferation in Crohn's disease) and the enhancement of bowel is readily seen in the arterial images (C) which become more evident in interstitial phase images (arrow, D).
Ileum: As the ileum is often only partially present in studies of the MR abdomen alone (that is to say, not including the pelvis), in many of our research investigations, we have not described ileal findings. With further investigation, we have observed a basic pattern of increased enhancement of a featureless tubular ileum. We have distinguished them as moderate caliber tubular if the ileum appears between 1.5 - 2.5 cm in external diameter, and moderately severe diminished caliber < 1.5 cm in diameter. Our current theory is that the smaller caliber is a more severe disease, but we currently have no clinical correlation. It is noteworthy that Crohn's appears distinctly different. Crohn's often shows distant mural thickening with the dominant pattern involving the distal portion of the ileum, extending from the ileocecal valve. Ileal SIS is always seen with jejunal, involves proximal ileum more than distal, and has a much more uniform tubular shape. In fact, it can be difficult to distinguish varices from ileal SIS in cirrhotic patients.
We report herein an analysis that we have carefully performed over a few years of focused attention to the upper digestive tract. The primary author initially described the majority of digestive tract abnormalities in modern MRI from 1990-2000, including the first three generations of articles on entities such as Crohn's. It, therefore, was a surprise that he had not recognized this complex of related inflammatory conditions with his experienced colleague till some 30 years after first writing on modern MRIs of the bowel. This had eluded him and the other experienced author, and presumably the global community, because patients with this condition typically are not imaged by MRI. The typical patient seen with SIS is obese and has abdominal pain, which may be right upper quadrant, left upper quadrant, or generalized. Traditionally, this type of patient is imaged using ultrasound or CT. Many subjects we have seen had first been investigated for abdominal pain with ultrasound (often several) and CT (often a couple) for several years prior to MRI and interpretation by the senior author of this report. The imaging reports describe a clinical history of abdominal pain, but then universally, neither ultrasound nor CT makes the findings that we subsequently made on MRI. The other explanation for not making these bowel inflammation observations is that historically, we have not imaged post-GBCA beyond 3 minutes for many years. Optimal demonstration of bowel findings is made 5 minutes post-injection.
It is estimated that 40% of adults in the US are obese, which is approximately 200 million individuals. We estimate that 40 million may have SIS, as the imaging features of the Splanchnic Metabolic Syndrome, or SIS. Bowel findings in isolation may reflect a leaky gut. The two necessary findings to describe this entity in a subject are at least one segment of inflammatory change in the upper digestive tract combined with fatty liver. Beyond those two essential findings, individuals can have a multi-organ varied picture of abnormalities throughout the splanchnic system. We also opine that since what we have described as abnormal digestive tract enhancement is so common, radiologists, including ourselves, believed them to be within the spectrum of normal. However, after a more detailed analysis, I realize they are not. The primary author has drawn upon the experience of over 100 thousand abdominal MR interpretations of what normal bowel enhancement should be, which is similar to striated muscle. This also means recognizing that for many years, his eyes did not see it because his mind did not understand it. Currently, we often do not report minimal inflammatory changes unless the individual has reported symptoms related to abdominal disease, such as abdominal pain.
We consider that these findings have finally been recognized and reported on and have now been brought to the attention of body MR radiologists through this article. They have come at an opportune and exciting time for the evaluation of the abdomen and abdominal disease. It has been recently recognized that the second largest neural network after the brain and spine is the digestive tract. The description of digestive system-related hormones, like Ghrelin and Glucagon-like Peptide-1 (GLP-1), are new, and their roles and functions are in the early stages of being investigated.
The limitation of this present report is that relatively few of these subjects have been correlated with endoscopy. Some cases of moderate disease and nearly all with moderately severe disease have been shown to correlate with endoscopic findings. It should, however, be noted that since endoscopy interrogates only the luminal surface, it is likely to not observe findings reported on MRI as MRI visualizes the entire bowel wall, and not just the mucosa, and additional endoscopy is unable to reach much of the jejunum and ileum, so cannot correlate those findings. We, therefore, have had to rely on our unmatched extensive clinical research and clinical experience with body MRI and specifically bowel evaluation. Regarding the abnormal distal esophagus, essentially all patients had a history of GE reflux. These findings, though, should be considered preliminary, and carefully controlled investigation in the university setting is essential. This report should be considered a text atlas, not an original research publication.
In summary, we show that MRI can evaluate inflammation of the upper digestive system well. Inflammation of this system has not been well evaluated until now, when we have shown it with this report. Bowel inflammation is a critical aspect of the imaging entity SIS and the clinical entities Metabolic Syndrome, irritable bowel syndrome, and leaky gut.
None.
Authors declare that there is no conflicts of interest.

©2024 Semelka, et al. This is an open access article distributed under the terms of the, which permits unrestricted use, distribution, and build upon your work non-commercially.