International Journal of
eISSN: 2576-4454


Research Article Volume 4 Issue 5
Department of Urban and Regional Planning, Rivers State University, Port Harcourt, Nigeria
Correspondence: Brown Ibama, Department of Urban and Regional Planning, Rivers State University, Port Harcourt, Nigeria
Received: September 27, 2020 | Published: October 12, 2020
Citation: Ibama B, Nengi DI. The boom, the blunder and the brunt of Wetlands conversion and urbanisationin Port Harcourt Municipality. Int J Hydro. 2020;4(5):243-252. DOI: 10.15406/ijh.2020.04.00251
Port Harcourt municipality as a developing city has over the years been inundated with rapid urbanisation and continuous city expansion. This development has led to an increasing demand for more land to cope with such pace of transformation. Land as a natural resource is finite, yet the demand for more land is unlimited. Based on this increasing demand for land for infrastructural, commercial, residential, institutional and industrial services, government, individuals and communities alike have resort to the reclamation and conversion of available wetlands within the Port Harcourt municipality. This study sets out to identify the boom, the blunder and the brunt of wetlands reclamation and conversion within Port Harcourt Municipality; with specific objectives to ascertain the nature of spatial expansion within the wetland areas in Port Harcourt municipality; identify the extent to which urban growth has affected land use in the wetland areas within Port Harcourt municipality; and to establish the boom, blunder and the brunt of wetland depletion and conversion for urban land uses within the Port Harcourt municipality. The study adopts a quasi-experimental research design, it involves the gathering of retrospective data from various sources without the manipulation of the data sources. Sampling technique was multi-stage; listing of all forty-one wetland settlements; three settlements were purposively selected for ease of access and growing insecurity. Satellite images of the study sites were obtained from Google earth, delineated and gridlines were superimposed on the images. A time series analysis using ERDAS imagine 2014 version, was used to show spatial changes between the years 1986 to 2000, and 2000 to 2016, a time period spanning thirty years. The study indicates that from 1986 to 2000, Port Harcourt municipality lost a total of 1,255,500 m2, this translates to a 5% loss. This loss occurs at an average rate of 89,678.57m2 per annum. From 2000 to 2016, the rate of loss was 108,956.25m2 per annum, and approximately 7.69% of wetlands totalling 1,743,300m2 was lost to urbanisation. Improved urban services, economic prosperity, increased revenue represents some of the boom. Unnecessary incursion into the wetlands by groups, depletion of habitat for flora and fauna species, development of unplanned settlements is some of the blunders and declining urban quality of life, massive urban flooding, pressure on existing urban services, depletion of the already lean state resources are the brunt. Some recommendations include; conduct periodic geospatial mapping of wetlands to enable the listing of identified wetlands and identify existing species of flora and fauna for conservation, tourism development and preservation; there should be a strengthened development control framework to guide and encourage professionally trained and equipped manpower to manage wetlands and ensure acceptable best practices.
Keywords: boom, brunt, blunder, municipality, port Harcourt, urbanisation, wetlands
Land is an important resource component for development that has been exploited to meet several since in creation times.1 Land and its component resources have over the years witnessed significant over exploitation that has led to the alteration of land cover and distortion of the ecosystem. These alterations in the land cover are engendered by continuous uncontrolled logging, agricultural activities, mining and physical development which has contributed significantly to rapid urbanisation and environmental degradation.2
Globally, cities in developed economies are often driven by urbanisation based on available opportunities in the form of services, jobs and enhanced incomes more than rural economies which as such, it encourages migration.3 According to the FIG Commission (2010) 50% approximately 3.3billion persons of the global population became urban dwellers in the year 2010 with another projected 500million to become urban dwellers at the end of 2012 and a further 60% projected to become city dwellers by the end of 2030. The trend in urbanisation culminates into megacities underpinned by the quest for economic development and systemic wealth creation prevalent in the Asian continent.4
The United Nations (UN) also estimates that about 54.5% of the global population dwell in urban areas with approximately 23% representing 1.7 billion persons are residents of cities with over 1 million (millionaire cities) population threshold with a further prediction of about 27% of the global population to reside in these millionaire cities.5
Urbanisation as a notion is a multifaceted idea that is often viewed from diverse perspectives such as demographic and structural transformation and behavioural transformation. The demographic transformation ideology perceives urbanisation against the background of rapid growth of the urban area, increase in population and a commensurate increase in the growth and expansion of neighbourhood. The Structural transformation perception relates to the changes from an agrarian to more industrialised system as a source of livelihood especially in the construction of buildings and social infrastructure. Also, the behavioural transformation is hinged on palpable changes in the economic and social spheres of urban life.6
Based on these perceptions, urbanisation represents the process of swift economic, social, demographic and structural growth of urban areas with a transition from an agrarian to an industrial means of livelihood. Port Harcourt municipality has over the years witnessed significant surges in migration leading up an exponential spike in the urban population with a commensurate demand for land continuous development.7
The consequences of rapid urban growth are the distortion of the urban ecosystem and further alteration of services to meet the needs of the populace.8
There are the negative and positive sides of urbanisation on the urban landscape depending on how it is being planned out or managed. Implicitly, urbanisation engenders development with a concomitant rise in income and standards of living, at the same time it fosters urban environmental hazards such urban pollution, mudslides and flash floods. Hence, there arises the need for effective management of such rapid urbanisation process.9
Tacitly, one fundamental challenge encumbering effective administration of land use is the land itself, as planned city expansion in Port Harcourt and other budding cities in Nigeria have similar challenges. Fundamentally the focus of these challenges in urban land uses revolves around who has access to the land, the acquisition processes and extant laws regulating the use of such land. In most Nigerian cities the challenges inundating land could be resolved with effective and purposeful planning. Since the Federal government could not resolve such encumbrances.10
Land is limited in supply to meet the infrastructural development and housing needs of the surging urban population. This palpable scarcity of land has led to the encroachment on existing wetlands by developers in search of land. Wetlands as they exist, play significant roles within the cityscape such as the sustenance of the general wellbeing, health and wealth of the urban ecosystem. Preserving wetlands amid rapid urbanisation falls within the purview of implementing planning schemes.11 From the foregoing, this research aims to examine the boom and brunt of wetland conversion in Port Harcourt Municipality. Predominantly surges in urban population in developing countries like Nigeria engenders rural-urban migration which cannot be barred. This is occasioned by the surge in population and rapid urbanisation witnessed in 1950s, 1960s and later years. Rural-urban migration is a catalyst for city growth such as Port Harcourt, as it has led to a spike in the demand for land for urban development specifically in housing.12 Port Harcourt is one of the fastest growing cities in the Niger Delta and this growth is accompanied by unrestrained and unfettered wetland conversion within the municipality for urban land use such as infrastructural development and housing.13
A longitudinal study from 1986 to 2007 indicated a significant decrease in the shape and size of water bodies within the Port Harcourt municipality occasioned by continuous land reclamation carried out by successive government. It has led to a steady decline in the swamp land cover from 26.5% in 1986 to 20.52% in 2007.14
The conversion and reclamation of wetlands for development purposes and urban land uses, in addition to poor planning and ineffective development control engenders environmental challenges noticed in most urban environments. According to,15 urbanisation has significant influence on wetlands depletion as there are losses in terms of the natural vegetation, habitat of animal species and aquatic plants. Also, there are instances of hydrologic changes, suspended solids and alteration of water quality. This phenomenon further influences the magnitude of changes noticed within the landscape due to the depletion of large expanse of wetlands that lead up to changes in natural drainage pattern occasioned by fragmentation and modification.16
This study aims to identify the boom, the blunder and the brunt of wetland depletion for urbanisation in Port Harcourt municipality.
With specific objectives to
The British colonial administration created Port Harcourt as the capital of Rivers State between 1912 and 1914 as a coastal hub to facilitate the exportation of local agricultural produce and effectively enable trade from the hinterland.17 Port Harcourt was named after Lewis, Viscount Harcourt, with an initial landmass of 30,000acres prior the discovery of crude oil in Oloibiri in 1956 and thereafter expanded rapidly beyond its original boundaries. In 1997 the approximate size of Port Harcourt was 470km.18 It stands on latitudes 6059’ to 706 N of the equator and longitude 4040’ E to 4055 E of the Greenwich meridian. It is in the Niger Delta and lies along the Bonny River an eastern distributary of River Niger which is 66km upstream of the Gulf of Guinea.
Port Harcourt falls within the sub-equatorial climate and accounts for 70% of the annual precipitation between April and August, while 22% is spread through September to November.19 It also has a tropical monsoon climate with prolonged and heavy rainy season combined with very short dry season. The driest months are December to March with the harmattan haze that climatically influences many cities in West Africa, but minimal in Port Harcourt.20
The Port Harcourt region has a unique surface feature as it lies within the coastal belt inundated by low-lying coastal plains laced with structurally sedimentary formation predominant in the Niger Delta21 It has a low-lying relief system with rivers influenced by fluctuating tidal actions (Figure 1).22
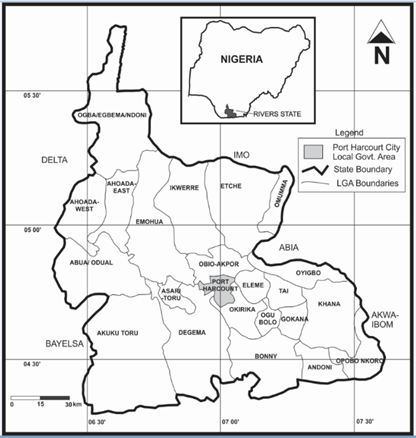
Figure 1 Map of Rivers State Showing Port Harcourt Municipality.
Source: Deeyah and Akujuru,26
Within the municipal boundaries, the population of Port Harcourt has grown from an initial 7,000 residents in 1921 to over 800,000 as at 2006 (Table 1). Port Harcourt City Local Government Area is the core of the Port Harcourt municipality with a current population of about 1,382,592 persons and a combined land and water area of 186km2 (170km2 and 16km2) respectively24 (National Population Commission, 2006). The municipality is situated along marshlands, creeks and mangrove swamps that makes it difficult for urban development.20
Year |
1921 |
1953 |
1963 |
1973 |
1991 |
2006 |
2015 |
Population |
7,000 |
79,634 |
179,563 |
231,600 |
703,420 |
1,382,59 |
2,343,310 |
Table 1 Population trend of Port Harcourt from 1921 to 2015
Source: Source Rivers State Government, (1975) and Population.city (2015)
Outlining an urban area, as well as defining when any settlement qualifies to become an urban area is contextual and subject to a global debate. In more developed economies, several criteria form part of the classification process for the emergence of an urban area. These criteria include but not limited to; population density, population threshold, political and administrative convenience, economic activities and the presence of health and education services25-27
When population, economic activities, culture and land use transits from rural to urban, urbanisation has taken place. It is referred to scenarios where the urban centre periphery experiences one or several changes.28 Similarly, when there is a change in population from an agrarian economy within a small rural enclave into a denser, larger urban settlement characterised by service and industrial economic activities, such transformation process could be referred to as urbanisation.29 Implicitly, when there is a surge in population and its attendant shift in livelihood source from agrarian to industrialised or service-oriented economy, urbanisation has occurred. Urbanisation as it were, is the comparative increase in urban population as a percentage of the local population occurring on a larger dimension that experienced before.30 There is a consensus among scholars regarding the definitions of urbanisation as scholars tend to agree that for urbanisation to occur,there must be a one or more shifts in the growth in population, economic base, social, political and administrative function of that locality.
Wetlands have various definitions with each definition having a commonality that acknowledges that wetlands are lands that are perennially inundated by water. In the opinion of Shine and De Klemm.31 “Wetlands are areas where dry land meets, or is saturated, by water and are characterized by the presence of water-dependent species of plants and animals”. Also, Collins32 defined wetlands as “aquatic systems that can be permanently saturated, as well as areas that occur at the other extreme, i.e. areas that are rarely saturated, and because wetlands occur between these extremes, they are often viewed as “transitional” ecosystems that share characteristics of both the wetland and non-wetland habitats.” The Convention on Wetlands 2016 (RAMSAR) convention establishes a generally accepted definition of wetlands and describe it as “areas of marsh, fen, peat land or water, whether natural or artificial, permanent or temporary, with water that is static or flowing, fresh, brackish or salt, including areas of marine water the depth of which at low tide does not exceed six meters” The Ramsar Convention Secretariat further asserts that wetlands may include: “Human-made wetlands such as fish and shrimp ponds, farm ponds, irrigated agricultural land including rice paddies, salt pans, dams, reservoirs, gravel pits, wastewater treatment ponds, and canals”.33
Studies revolving around land use have in recent times become beneficial as it enables scholars critically analyse the processes and challenges encumbering the environment such as urbanisation, wetland conversion, environmental degradation, agricultural expansion and loss.34,35 The Environmental Literacy Council (2015) describes land use is as activities of humans concerning the use of a demarcated stretch of land.36 Aspin all and Hill (2008) describe land use as the several types of land cover roles such as political, social, economic and cultural roles which indicates that human activities relating to land use goes within the spatial boundary of that location.
There is no standard international definition of land use as it has a location specific definition based on the context of its application across disciplines.34 By this assertion, the use of any land in an area is determined by the type of existing land cover in that area. Thus, the sprawl of Port Harcourt municipality has engendered the reclamation of large expanses of lands within Port Harcourt municipality which were primarily fishing grounds have become residential areas.37
Wetlands play significant roles in the wellbeing of any environment wherever they occur. From the appropriation on nutrients deposited from runoffs to water catchment and the formation ofhabitat that support a host of fauna and flora. With such sequestering function of wetlands, wetlands became the kidneys of landscape.38 Wetlands are treasured within the ecosystem and comprise of water and land that occupies about 6% of the surface area of the earth. They are highly influenced by water and its equivalent marine ecosystems that are unique owing to its nearness to land and shallowness.39
There is great difficulty quantifying the impact of humans on wetlands. Scholars have identified that where there is a surge in development and human population, there is a commensurate change in the size of the wetland from significant to absolute. The wetland ecosystems contribute significantly to the sustenance and development of human communities as some human cultures have continuously preserved and maintained the balance between wetlands and human activities while others have drained them off.40 Most of the resources found in wetlands are very valuable to scholars, conservationists, the local communities and other environmental protection agencies.41
The trend of wetland loss globally has reached an alarming trend as about 64% of global wetlands have been lost to development and other human activities since 1990.42 The global distribution of wetlands today no longer reflects previous distributions as the ecological status of most wetlands have been distorted. Besides, poor planning and land uses do not encourage wetland preservation, rather they engender loss of wetland.43
Trends of wetland degradation and loss in Africa
Wetlands in Africa are among some of the most productive ecosystems in the world as they sustain rural economies because to the vast deposit of natural resources in them. For instance, the inner Delta of River Niger sustains over 550,000 people and their livestock for grazing as a post-flood measure. Africa has one of the largest wetlands distribution that is located within latitude 150N and 200S and feeds from the major rivers of Africa (Zambezi, Zaire, Niger and Nile).44 There is a fragmentary knowledge of wetlands in Africa, as the ecosystem of some wetlands have been studied and most are yet to be studied. Some countries with wetlands are still grappling with having an operational definition of what entails a wetland in addition to the management and measurement of the essential resources found in the wetlands.45
Wetlands in Nigeria
Nigeria which is located along latitude 40 north of the equator and between longitudes 30 and 140 east of the Greenwich Meridian, with fourteen wetland belts. These wetland belts are located in the; Sokoto-Rima, Komadugu-Yobe, Lake Chad, Upper Niger Lake, Kainji Lake, Middle Niger (Lokoja) wetlands, Jebba wetlands, Lower Kaduna wetlands, Lower Benue (Makurdi) Wetlands, Upper Benue/Cross River, Lower Niger Delta, Benin (Owena River and the Okomu River), Lower Ogun River (Yewa Creeks, Badagry Creeks, Ologe Lagoon Lekki Peninsula), and the Lagos Lagoon.46 Wetlands in Nigeria span through the country covering about 2,988,000 hectares of terrestrial lands. The Lower Niger Delta wetland basin has the largest landmass in Africa and the third largest mangrove forest globally.47
Wetlands in Port Harcourt
There are forty-one identified and delineated wetland settlements in Port Harcourt municipality namely: as waterfront settlements of Port Harcourt municipality; Abuja, Afikpo/Abba, Andoni, Awkuzu, Bishop Johnson, Bundu, Baptist, Captain Amangala, Cemetery, Egede/Akokwa, Emenike, Egbema, Enugu/Aggrey, Eastern By-Pass, Elechi Beach, Ibadan/Yam zone, Igbukulu, Marine Base, Ndoki, NEPA, Nanka, Nembe/Bonny, Orupolo, Ogu/Okujagu, Okrika, Ojike/Urualla, Prison, Rex Lawson/ Etche, Timber/Okwelle, Tourist Beach, Udi, Witt and Bush (Reclamation Drive).48,49 These wetlands have been in existence from the inception of the Port Harcourt 1975 Masterplan but over time, some of those have been reclaimed and converted to other land uses due to either government negligence and/or community annexation to satisfy the growing demand for land for city expansion and economic prosperity. The trend of urban growth in Port Harcourt is in the southerly direction and occurs largely through the colonisation, reclamation and conversion of wetlands for other land uses.50
Threats to wetlands
Olusola et al.,51 tried to distinguish between wetland degradation and wetland loss with the position that wetland loss is the outcome of converting wetland areas to non-wetland areas occasioned by human activities. These activities come in the form of dredging and boating, agriculture, industrial activities like mining, oil and gas exploration, lumbering, building of factories, construction of marinas and urbanisation.52,53 Urbanisation remains a major threat to wetlands because as cities develop, rural areas in the urban fringes experience urban influences with an increased demand for land. Wetlands which serve as habitats to biodiversity is incrementally lost to urbanisation and species become endangered and species that are foreign might be introduced into the environment.54
Wetlands are gradually becoming a threat to urban security in Port Harcourt because the reclamation and conversion of these wetlands are done and controlled by rival urban gangs, community groups and forced economic migrants who see those wetlands are opportunity to expand their territories. Thus, residents and visitors alike thread with caution in most of those reclaimed and converted wetland settlements.
The study is a passive observational study that adopted a mixed method research with no experimental manipulation as participants were in-situ. Sampling was multistage with the listing of all forty-one (41) identified existing wetlands including those reclaimed and converted to other land uses. Sample size was purposively drawn as Borikiri Sandfill, Bundu and Reclamation Drive were selected for ease of access amid growing security concerns in those neighbourhoods to conduct key informant interviews and photograph sessions. Secondary and primary data were collected. Secondary data was collected through existing maps from 1975 Port Harcourt master plan and satellite imageries of the study area. Data was analysed using Erdas Imagine and Lansat data. While primary data was collected through personal observation with photographs and key informant interviews.
Nature of spatial expansion in the wetland areas within Port Harcourt municipality
Urbanisation in the form of physical development has become the nature of wetlands expansion in Port Harcourt metropolis over the years from when the Masterplan was designed, and implementation began in 1975. Based on available map/satellite data, most parts of Port Harcourt metropolis as at 1975 had some sections of the study area uninhabited due to its predominant deltaic nature with unstable marshlands. For instance, the Borokiri New Road and Borokiri S and fill areas were designed for residential development (Figures 2&3), while sections of the Reclamation Drive were earmarked for industrial development due to its proximity to the Port Harcourt seaport. However, some of these areas were left unoccupied and utilised by the government, hence, it was annexed by aborigines for personal gains over time. It has become established that the wetlands in Port Harcourt municipality are depleted greatly in the name of city expansion and growth for development. These incursions are perpetrated by the government, individuals and other community groups found within the precincts of these valuable resources entrenched in the vast wetlands endowed by nature.
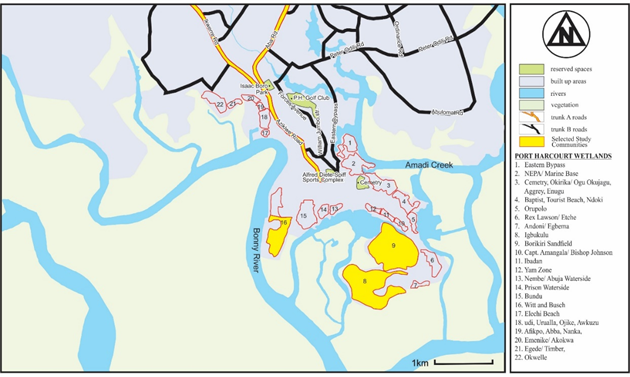
Figure 2 Map of Port Harcourt Showing Wetlands and the Selected Study Sites
Source: Authors’ adaptation from (Theis et al., 2009)

Figure 3 Land use characteristics of the study areas in 1975.
Source: Authors’ edition of Port Harcourt Masterplan of 1975
Extent to which urban growth has affected land use in the wetland areas within Port Harcourt municipality
A land use map of the study area in 1986 indicates that Borikiri New Road and Borikiri S and fill had minimal spatial changes in the form of development while the Reclamation Drive was still in its pristine state with thriving wetlands. An identified spatial change in the study area from 2000-2016 as evident in Table 2 indicates that wetlands in the study area shrunk from 5.15% to 7.69% representing 1,743.3 ha which was lost to land reclamation. At the same time, bare grounds within the study area increase from 1,676.7 ha to 1,856.7 ha representing 9.69%. Also, water bodies in the study shrunk from 11,829.6 ha to 11,484 ha which is a representation of 3% as an indication that there is an increase in land reclamation in A, while physical development activities increased significantly by 12.47% representing 1,319.4 ha on B and C. Implicitly, urbanisation took place as buildings and other infrastructure were built up to further reduce existing wetlands in Port Harcourt municipality driven by the demand for commercial and residential land use (Figure 4).
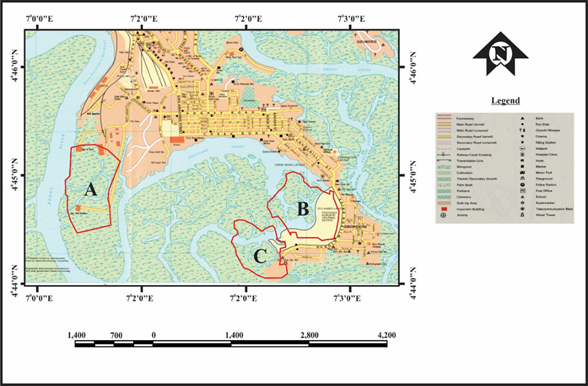
Figure 4 Extent of development in the study area as at 1986.
Source: Authors’adaptation of the Shell Port Harcourt Street Guide of 1985
|
Attributes |
1986 Area (m2) |
2000 Area (m2) |
Difference (1986-2000) m2 |
% change |
Annual rate of change (m2/year) |
|
Non-Wetland Vegetation |
1,854,900 |
1,398,600 |
-456,300 |
-32.63 |
-32,592.86 |
|
Wetland Vegetation |
25,649,100 |
24,393,600 |
-1,255,500 |
-5.15 |
-89,678.57 |
|
Soil/Bare Ground |
2,380,500 |
1,676,700 |
-703800 |
-41.98 |
-50,271.43 |
|
Water Body |
11,265,300 |
11,829,600 |
564,300 |
4.77 |
40,307.14 |
|
Built Area |
7,407,000 |
9,258,300 |
1,851,300 |
20 |
132,235.71 |
|
Total |
48556800 |
48,556,800 |
|
|
|
Table 2 Extent of spatial changes of wetlands in Port Harcourt municipality (1986-2000)
Source: Authors’ Lansat Image analysis (2020)
Table 2 shows the spatial changes of the wetlands in Port Harcourt Municipality from 1986 to 2000. Relying on the analysis of satellite imagery using Erdas Imagine, it was evident that from 1986 to 2000, there was a 5.15% depletion of wetlands in Port Harcourt Municipality representing about 1,255,500m2. At the same time there was a 20% increase in the built-up areas representing about 1,851,300m2 expansion of the built environment. At the same time water bodies in the municipality also increased by about 4.77% representing about 564,300m2. Also, undeveloped lands which include reclaimed areas was further reduced by 41.98% representing 703,800m2 loss of undeveloped lands within the municipality.
Furthermore, a 30year timeline (1986 to 2016) based on satellite imagery to ascertain the dynamics and extent of spatial changes in the study area indicates both positive and negative changes. Table 3 indicates that the built environment increased from 7,407,000m2 to 10,577,700m2 which meant an overall increase of 3,170,700m2 representing about 29.98% of the wetlands. However, these wetlands in the study area were further reduced from what it used to be 25,649,100m2 to 22,650,300m2 representing a depletion rate 13.24% and amounts to 2,998,800m2. From the map data analysis, it is evident that with a 30-year period, these wetlands were being depleted at an average annual rate of 187,425m2, with a corresponding increase on the built environment at an annual average of 198,168m2.
|
Attributes |
1986 Area (m2) |
2016 Area (m2) |
Difference (1986-2016) m2 |
% of change |
Annual rate of change (m2/year) |
|
Non-Wetland Vegetation |
1,854,900 |
1,988,100 |
133,600 |
6.72 |
8,350 |
|
Wetland Vegetation |
25,649,100 |
22,650,300 |
-2,998,800 |
-13.24 |
-187,425 |
|
Soil/Bare Ground |
2,380,500 |
1,856,700 |
-523,800 |
-28.21 |
-32737.5 |
|
Water Body |
11,265,300 |
11,484,000 |
218,700 |
1.90 |
13668.75 |
|
Built Area |
7,407,000 |
10,577,700 |
3,170,700 |
29.98 |
198,168.75 |
|
Total |
48,556,800 |
48,556,800 |
|
|
|
Table 3 Extent of spatial changes of wetlands in Port Harcourt municipality (1986 - 2016)
Source: Authors’ Lansat Image analysis (2020)
Available data from the map analysis indicate that built-up areas of Port Harcourt Municipality increased from 7,407,000m2 to 1986 to 10,577,700m2 in 2016. This growth occurred at an average of 198,168.75m2 per annum. Evidently the 1985 Shell Street Map and 1975 Master plan indicate sections of the study area that were not inhabited before the 1986 reclamation which was done by the government. While the built-up area increased in size, the wetland areas reduced by 13.24%. Evidently, wet lands in Port Harcourt municipality reduced from 25,649,100m2 in 1986, to 22,650,300m2in 2016 (Figures 5&6) Observational studies by the researchers and historical accounts given by key informants further revealed that some of those neighbourhoods which were initially largely unoccupied fishing grounds, had transited into largely residential areas, with some institutional land uses such as places of worship centres, educational and commercial uses.
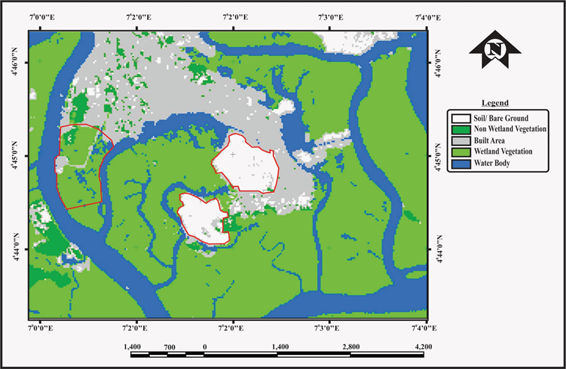
Figure 5 Spatial changes of wetlands in the study area as at 1986.
Source: Authors’ edition of Port Harcourt Masterplan of 1975
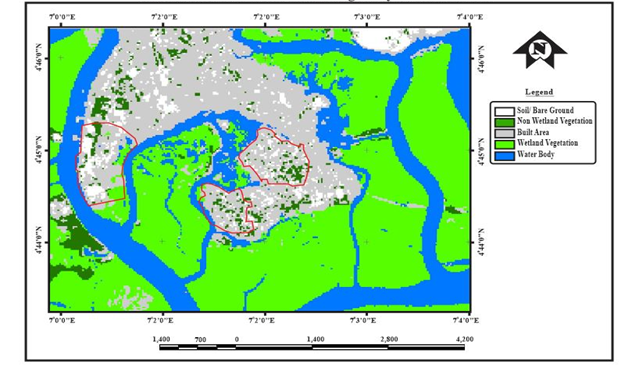
Figure 6 Spatial Changes of Wetlands within the Study Areas for 2016.
Source: Researcher’s interpretation of Lansat Image, (2020)
The boom of wetland depletion in Port Harcourt Municipality
Wetlands globally like those in Port Harcourt municipality are characterised by special biodiversity habitat significant for local conservation exertions that support important population of species of conservation roles. Wetlands also provide support for large population of species that depend on wetlands as migration point, feeding and breeding grounds and are remarkably high natural habitat variety.55 These unique characteristics of the wetlands have contributed significantly to economic, tourism and agricultural development in locations wherever they are found. Also, the wetlands in Port Harcourt municipality prior reclamation and conversion, used to be uninhabited marshlands that served as fishing grounds for some migrant fisher folks who eke out their living from fish catches daily. The depletion of these wetlands means enormous biodiversity loss to concerned parties and poses enormous challenge to conservationists, species using it as habitat and environmental managers including other species that interact with such wetlands. On the flip side of these depletions, wetlands on the short run engenders urban development. For instance, wetlands are being reclaimed to build residential, economic, industrial institutional and commercial developments in Port Harcourt Municipality.
With the continuous surge in the population of Port Harcourt municipality occasioned by forced and normal migration, economic prosperity, industrial cluster development and incremental urbanisation, there is the growing need to reclaim and convert wetlands to meet these growing demands for more land for city expansion. These developments on reclaimed and converted wetlands when effectively managed, engender economic prosperity and shores up the internally generated revenue base of the Port Harcourt local government area and by extension the government of Rivers State. Instances where such reclaimed and converted wetlands were being put into other forms of land uses for income generation and economic prosperity to both private investors and government at the state and local government level are evident in Rivers State (Table 4). Other contributory factors driving the demand for the reclamation and subsequent conversion of wetlands within Port Harcourt municipalityinclude the affordability of such land, safety and security and low construction cost.
Location |
Co-ordinates |
Date of Reclamation |
Responsible Parties |
Perimeter km |
Area Ha |
Okuruama 1(Golf Estate) |
Lat 4.993390 Long 7.0584230 |
2013 |
Rivers State Government |
12 |
39.82 |
Azuabie (Opposite Golf Estate) |
Lat 4.8036740 Long 7.0558310 |
On going |
Belema Oil |
2.30 |
28.5 |
Eastern Bypass 1 |
Lat 4.7950720 Long 7.0165990 |
Ongoing |
Rivers State Government |
1.44 |
12.6 |
Eastern Bypass 2 |
Lat 4.7934510 Long 7.0146870 |
Ongoing |
Rivers State Government |
0.60 |
1.30 |
Eastern Bypass 3 |
Lat 4.7907100 Long 7.0165220 |
Ongoing |
Intergrated Logistics Ltd |
0.79 |
3.49 |
Table 4 Some ongoing reclamation and reclaimed wetlands converted for other uses within the study area
Source: Fieldtrip (2020), (TAF Nigeria Homes, 2017)
The blunder of wetlands depletion in Port Harcourt Municipality
Reclamation and subsequent conversion of wetlands within Port Harcourt municipality has over the years become a norm as residents closest to these wetlands sometimes tend to annex them for personal gains without effective enforcement from the relevant government agency to protect such wetlands. The blunder occasioned by wetlands reclamation and conversion in Port Harcourt municipality include the incremental loss of agricultural and recreational lands because some of these places serve as areas for aquaculture and water sports. With the reclamation and subsequent conversion of wetlands within the Port Harcourt municipality for urbanisation continuing, there is also a concomitant reduction and distortion in the natural flow paths for runoffs leading to urban flooding. In some neighbourhoods where these wetlands have been reclaimed and converted to other land uses, there are incidences of tidal floods in those low-lying areas which causes further inconvenience as residents experience man hour losses, damage to physical properties and associated health challenges (Figure 7).
Due to the circumstances engendering some of these forced reclamation and conversion of these wetlands by locals, government hardly provide basic social services in these neighbourhoods. As such, residents in most scenarios improvise with their indigenous adaptations to the prevailing circumstances just to survive and provide their social services like refuse disposal system on any available space and access roads they deem fit (Figures 8&9).
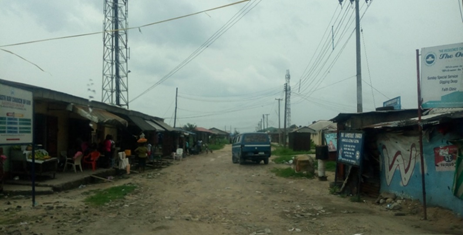
Figure 9 An untarred Street in Borikiri Sandfill, showing buildings without proper setbacks and drainages.
Source: Fieldtrip (2020)
The blunder of wetlands depletion in Port Harcourt Municipality
The brunt of living in an unorganised settlement created out of reclaimed and converted wetlands by a few individuals has its consequences borne by more people than those who created such settlement. It is borne collectively as it becomes a collective challenge because these settlements oftentimes are bereft of basic social infrastructure such as pipe borne water, access roads, refuse disposal system, drainage system, primary healthcare and sewage system. There is a negative spiral effect on the larger society as most of the residents in these settlements are serviced by adjoining neighbourhoods due to limited services. Besides, the consequence of blocked drainage system in most of these reclaimed and converted wetlands is flooding that overspill into other adjoining neighbourhoods that affect those residing and visiting those areas. Also, there is pressure on existing social services in adjoining neighbourhoods as most residents would prefer to go out since there are no existing social services in those reclaimed and converted wetland settlements. The filth and health hazards occasioned by poor sanitary conditions, poor waste management and failed sewage system in these settlements have a negative spiral effect on other parts of the municipality. Owing to the unplanned and haphazard nature of these reclaimed and converted wetlands in Port Harcourt, there is a general decline in the quality of life of residents in those settlements with its attendant social vices inherent in neighbourhoods with low quality of life. Most of the residents in these settlements experience economic retrogression spiralling into a myriad of psychological challenges like anxiety, depression, stress, poverty, and surges in criminal and suicidal thoughts. Others display violent characteristics such as intense aggression, quick temper and irrational agitation over every minor dispute.56 The government and other taxpayers bear the brunt of unapproved reclamation and conversion of wetlands to other land uses in Port Harcourt Municipality. This further affects the lean resources of the government as attention and resources are being diverted to seek for solution to those associated socio-physical challenges within the municipality.
Port Harcourt, a city of 7,000 residents in 1921 has over the years developed into a millionaire city with a staggering population of about 2.3million residents. The municipality has metamorphosed into an administrative and commercial hub.57 It has also become a strategic player in the oil and gas sector of the Nigerian economy because it has the capacity to join the global league of mega cities. This study has attempted to indicate the dynamics of wetlands reclamation in Port Municipality by ascertaining the nature of spatial expansion in the wetland areas within Port Harcourt municipality, identifying the extent to which urban growth has affected land use in the wetland areas within Port Harcourt municipality and also establish the boom, blunder and the brunt of wetland reclamation and conversion for urban land uses within the Port Harcourt municipality. This study has further highlighted that the government is the biggest reclaimer and converter of wetlands in Port Harcourt municipality as they change the land uses in the name of city growth, revenue generation, economic prosperity and urbanisation.
Based on the findings of this study, the following recommendations are being made to the government;
None.
Authors declare no conflict of interest exists.
None.

©2020 Ibama, et al. This is an open access article distributed under the terms of the, which permits unrestricted use, distribution, and build upon your work non-commercially.