International Journal of
eISSN: 2576-4454


Research Article Volume 4 Issue 4
1VB Sochava Institute of Geography of the Siberian Branch of the Russian Academy of Sciences (SB RAS), 1, Ulanbatorskaya st., Irkutsk, Russia
2Irkutsk State University, 5 Sukhe-Bator st, Irkutsk, Russia
Correspondence: Belozertseva IA, VB Sochava Institute of Geography of the Siberian Branch of the Russian Academy of Sciences (SB RAS), Ulanbatorskaya st, Irkutsk, Russia
Received: August 04, 2020 | Published: August 24, 2020
Citation: Belozertseva IA, Vorobyeva IB, Vlasova NV, et al. Snow pollution in the water area of the world heritage lake. Int J Hydro. 2020;4(4):165-174. DOI: 10.15406/ijh.2020.04.00242
The monitoring of the snow cover of the water area and the surrounding territory of Lake Baikal showed that the pollution of the area caused by the local sources spreads dozens of kilometers depending on the prevailing wind direction and reaches regional proportions in the central zone of Baikal’s basin. Air and snow pollution of the lake’s water area has been detected near the littoral residential zones and in the estuary of the Selenga River. The research also showed a small increase in the regional pollution for the past 5years (by a factor of 1,1 - 2 depending on a pollutant). However, according to the data gathered for the last 15years, the pollution decreased by a factor of two at the end of the 1990s and at the beginning of the 2000s due to the decline in manufacturing output.
Keywords: snow, pollution, lake baikal
The uniqueness of the research target is determined by the location of Lake Baikal in its area. Baikal is the deepest and the purest lake in the world as well as the UNESCO World Heritage Site. It is also the largest freshwater lake on the planet. Baikal’s enormous freshwater capacity which comprises 20% of the world’s freshwater storage as well as water deficiency problem on a world-wide scale demand the attention of the researchers from all over the globe (Groundwater exposed, 2016). The quality of Baikal fresh water that is highly oxygenated and low in mineral salts and organic substances is especially valuable. Unfortunately, the natural area of Baikal is also home to powerful sources of environmental contamination. What threat do they pose to Lake Baikal and its environment?
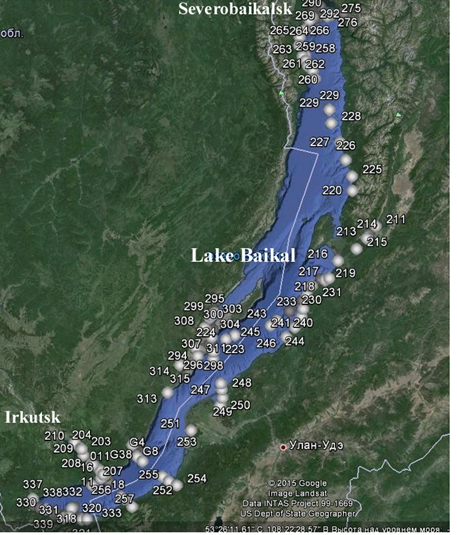
In February – March, 2015 the authors of the following research took snow samples in order to identify the level of snow cover pollution which could help to indicate air contamination in the central zone of the natural area of Baikal. 159 samples were collected in the water area and the surrounding territory of Lake Baikal. The area is shown in Figure 1. The scientific analysis was carried out in SB RAS (Siberian Branch of Russian Academy of Sciences) V.B. Sochava Institute of Geography in a laboratory environment using standardized methods and modern analytical equipment. The content of mobile fractions of metals was identified by the method of atomic emission spectroscopy using Optima 2000DV. рН in snow water it was measured by an electrometric method.1 The maintenance of hydrocarbonates in snow water - a titirimetric method.2 Mass concentration of nitrites – a photometric method with Gris's reactant.3 Content of chlorides – an argentometric method.4 Concentration of nitrites by a photometric method with salicylic acid.5 The maintenance of ions of ammonium – a photometric method with Nessler's6 reactant. Concentration of phosphates – a photometric method with restoration by ascorbic acid.7 Content of sulfates – a titirimetric method with use of a trilon B.8 Fluorine content was detected with the help of ion meter H-120 and fluorine selective electrode (GOST 4386-89). Petroleum products were detected with the help of a fluorescence analyzer FLUORAT-02-3M.9

Figure 1 Scheme of the key areas (February – March, 2015).
- key area of snow sampling; 238, site number.
Intake of chemical elements through the atmosphere for the winter period are calculated on the water area of the lake and a coastal zone taking into account stocks of snow cover. Recalculation of content of chemical elements and substances (mg/dm3 or mg/l) on vulgar indicators (mg/sq.m) were carried out on.10 When calculating intake of chemical elements in hollows of the lake average values undertook. For example, average concentration of fluorine in the thawed snow received makes 0.127mg/dm3 of the snow which has dropped out on the southern Baikal. Receipt of an element on square meter taking into account the average height and density of a snow cover makes 12.7mg/sq.m or 12.7х103g/sq.km. The area of the southern hollow of Baikal is 7351sq.km. Thus, loss of fluorine for the winter period makes of the atmosphere: 12.7х103/км2х7351sq.km = 93357700 g (or 93t).
According to the results of the snow survey, the scientific papers written by the research workers of various institutes.11‒22 and the research carried out by the authors mentioned above, it has been concluded that the major sources of air pollution of Lake Baikal are the industrial plants located in the basin of the lake and on its shores, certain sections of the Trans-Siberian and Baikal-Amur railways and airborne pollution caused by the Irkutsk-Cheremkhovo industrial hub. Aerial effluents from the industrial and heating plants of Baikalsk, Sludyanka, Severobaikalsk, Nizhnenagarsk and other small towns situated in the basin of Baikal have the highest chances of getting into the lake.
According to the numerous recently conducted research12,17,18,21,23 it has been found that airborne polluting products of the Irkutsk-Cheremkhovo agglomeration constitute a much smaller part of the total amount of atmospheric pollution due to the remoteness of the source of pollution, windless conditions and fogs. However, we can see local pollution under unfavorable weather conditions which altogether leads to a dangerous ecological situation in the towns of the industrial hub mentioned earlier.
Industrial and heating plants of Ulan-Ude, Gusinoozersk, Petrovsk-Zabaikalsk, Kyakhta and other towns located in the buffer zone of Baikal’s natural area do not have a major impact on the lake due to their remoteness, specific weather conditions in the area and orographic obstacles. But they do influence the whole ecosystem of the Baikal region. The Selenga pulp and cardboard mill has a significant impact on the lake, yet not in terms of the aerial transmission of the pollutants but through the stream flow.
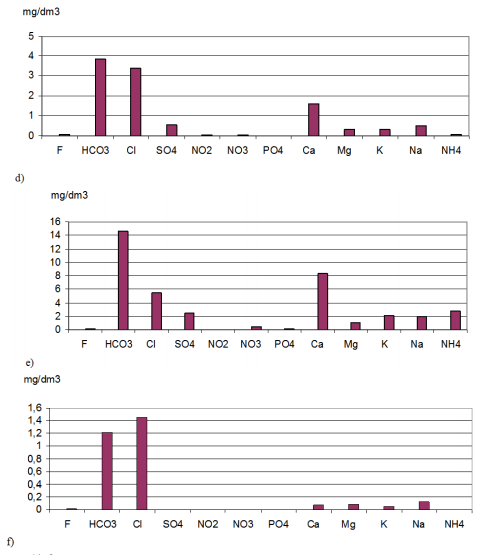
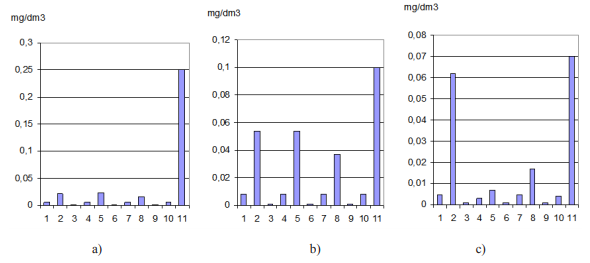
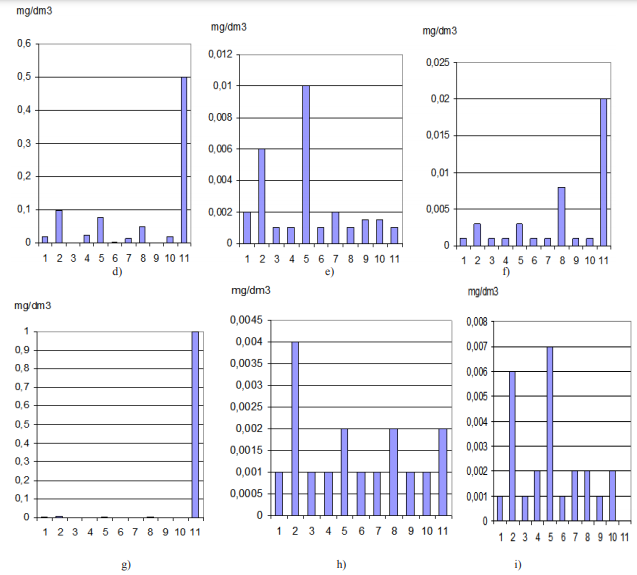
The results of the chemical analysis of the snow cover of the southern kettle of Lake Baikal and the surrounding territory have revealed the anomalies limited to the valley of the Angara River and the populated areas of the littoral zone (Listvyanka, Slyudyanka, Kultuk, Baikalsk) with the elevated contrast ratio for the following chemical elements and substances: F – 7,5; Cl – 2,0; SO4 – 9,2; NO2 – 12,8; NO3 – 19,5; PO4 – 18,3; K – 4,3; Na – 8,2; NH4 – 30; Mo – 4,2; Mn – 6,8; Ba – 12,4; Al – 5,4; Pb – 3; Ni – 3; Cu – 3; Be – 4; V – 6; Fe – 7,3; Si – 19,5; Zn – 6,6; Sr – 3,9; Ti – 3,5; Hg – 2,7; petroleum products - 4 (enhanced background) (Figures 2&3, Table 1). It should be noted that the background concentrations of most of the chemical elements are very low, i.e. are in deficit. The content of NH4, Pb, Be, Hg and petroleum products in the snow water exceeds maximum permissible concentrations (MPC) by a factor of 24, 4, 6, 2 and 3 respectively. Their maximum concentration is limited to the littoral zone of the lake’s water area.


Figure 2 Average, maximum and minimum content of chemical elements and substances, pH level in the snow water of Lake Baikal and its surrounding area.
Southern kettle: a, average; b, max; c, min content; Central kettle: d, average; e, max; f, min content; Northern kettle: g, average; h, max; i, min content; Lake Baikalin total: k, average content.


Figure 3 Average, maximum and minimum content of a) Mo, b) Mn, c) Ba, d) Al, e) Pb, f) Ni, g) Cu, h) Be, i) V, j) Cr, k) Fe, l) Si, m) Zn, n) Sr, o) Ti, p) Co, q) Cd, r) Hg in the snow water of Lake Baikal and the surrounding area.
Southern kettle: 1, average; 2, max; 3, min content; Central kettle: 4, average; 5, max; 6, min content; Northern kettle: 7, average; 8, max; 9, min content; Lake Baikal in total: 10, average content; 11, Maximum Permissible and Approximate Permissible Concentration.
|
Region |
Content |
pН |
Suspended substance g/dm3 |
Mineralization mg/dm3 |
Petroleum products, mg/dm3 |
|
|
Southern kettle of Lake Baikal |
average |
6.44 |
0.070 |
10.8 |
0.050 |
|
|
max |
7.14 |
0.559 |
20.1 |
0.202 |
|
|
|
min |
6.06 |
0.001 |
5.84 |
0.008 |
|
|
|
Central kettle of Lake Baikal |
average |
6.42 |
0.130 |
10.9 |
0.040 |
|
|
max |
7.39 |
0.690 |
28.3 |
0.140 |
||
|
min |
6.00 |
0.003 |
5.47 |
0.007 |
||
|
Northern kettle of Lake Baikal |
average |
6.44 |
0.070 |
11.8 |
0.050 |
|
|
max |
7.03 |
0.192 |
27.2 |
0.117 |
|
|
|
min |
5.88 |
0.001 |
5.95 |
0.010 |
|
|
|
Lake Baikal in total |
average |
6.43 |
0.09 |
11.1 |
0.050 |
|
|
MPC, APC, GOST 2874-82, SS 2.1.5.1315-03 |
- |
- |
0.050 |
|
||
Table 1 Average, maximum and minimum content of Petroleum products, pH level in the snow water of Lake Baikal and its surrounding area. March, 2015
MPC, Maximum Permissible Concentration; APC, Approximate Permissible Concentrations; GOST, All-union State Standard; SS, State Standard; Suspended Substance, solid residue on the filter (dust); mineralization, dry residue (sum of salts)
In terms of their complexity and intensity the anomalies of the most developed South Baikal and Irkutsk-Cheremkhovo industrial hubs refer to the technogenic type and result from the emissions of pollutants from various fuel and energy, chemical and metallurgical industries into the atmosphere. The given data show that hydrogen carbonate ions, sulfate ions and chloride ions comprise a bigger part of the ground mass of the substances penetrating Lake Baikal. Calcium, sodium and potassium cations also have a significant influence on the lake, notably in its central and northern kettles. High concentrations of fluorine ions and some heavy metals have been detected in the snow water near the littoral village of Listvyanka. They are typical of technogenic emissions of the aluminum industry. However, the concentration of these chemical elements in the liquid phase of snow is dozens and hundreds of times higher (>90%) near the Irkutsk Aluminum Plant (IAP) rather than in the Baikal littoral zone of Listvyanka which is 90km (56mi) far from the IAP. Therefore, local pollution characteristic of stove heating prevails in the littoral zone of the village, whereas regional pollution only constitutes 10%.
The research carried out in the central kettle of Lake Baikal identified three areas of anomalous concentrations of chemical substances in the snow cover. The first area is limited to the littoral zone of the territory near Olkhon Island, where we have detected a high concentration of chemical substances in the snow cover. In our opinion, it is connected with not only the anthropogenic load near the populated areas and recreational zones but also with the terrigenous dust of the soil-forming materials and roads. The snow in steppificated areas is easily transported to other areas. Bare snowless steppificated spots of the littoral zone of the Near-Olkhon territory are quite large in area, thus micro and marcoparticles of soil and rock typical of the given region are easily carried away to the water zone of the lake by strong winds. This type of pollution is of local and natural origin. Another area of snow cover pollution is limited to the Selenga valley through which technogenic emissions of the Selenga industrial hub are transported. The third area is limited to the villages of Barguzin and Ust-Barguzin.
Maximum ratios of the concentration of chemical substances in the snow cover of the central kettle of Lake Baikal in relation to the background are: F – 2,1; SO4 – 4,4; NO3 – 9; PO4 – 20; K – 7; Na – 3,8; NH4 – 35; Mo – 4,6; Mn – 6,8; Ba – 2,3; Al – 3,5; Pb – 10; Ni – 3; V – 2,3; Cr – 13; Fe – 2,3; Si – 10; Zn – 4,8; Sr – 4,6; Ti – 5; Hg – 3,5; petroleum products – 3,5. The content of NH4, Hg and petroleum products in the snow exceed maximum permissible concentrations by a factor of 7, 3 and 3 respectively. Maximum concentrations of chemical substances are of local nature and are limited to the littoral zone.
The analysis of the research conducted in the northern kettle of Lake Baikal showed contrast anomalous concentrations of SO4 which are 55 times above background: NO3 – 5,9; PO4 – 11,6; K – 3,7; Na – 6,1; NH4 – 8,9; Mo – 2,7; Mn – 4,6; Ba – 3,4; Al – 4,2; Pb – 3,5; Ni – 8; Cu – 3; V – 2,5; Cr – 5; Fe – 5,4; Si – 14; Sr – 6,1; petroleum products – by a factor of 2,3 near the towns of. Nizhneangarsk and Severobaikalsk. The concentrations of NH4, Pb and petroleum products in the snow exceed sanitation and hygiene standards by a factor of 2, 7 and 2 respectively. Construction materials enterprises, heating plants and motor vehicles are the major sources of air pollution. The contamination is of local character.
Comparing the data gathered for the past 5years15,19,20 we can conclude that we are currently witnessing the increase in the concentration of sulfates, nitrates, fluorine and some heavy metals and a relative decrease in the concentration of calcium, magnesium and potassium in the snow water of the water area of Lake Baikal. It has also been found that regional pollution has slightly increased for the past 5years (by a factor of 1,1–2 depending on a component). Although the data gathered for the past 15years show that the pollution decreased by a factor of 2 at the end of the 1990s and at the beginning of the 2000s which was caused by the decline in the manufacturing output.
Taking into account the input of chemical substances through the snow (milligram/meter2) during winter period and the total surface of Baikal’s water area we have calculated the input of chemical substances through the atmosphere (relying on the snow cover pollution data). In Table 2 you can see the data of the concentration of certain substances in the water of Lake Baikal and the calculated input of chemical substances transported through the atmosphere. The given data show that the content of sulfate sulfur in the southern kettle of Lake Baikal equals 34million 600thousand tons. Air emissions equal 1 thousand 540tons which is literally a thousandth part (1/22000) of the sulfate that is already contained in South Baikal.
|
Chemical component in the water-soluble form |
Using the data of the snow survey of 2015, tons per winter period (November-February) |
According to the data of Grachyov, (2013) for the southern kettle, tons per year |
Total content in the water of Lake Baikal, tons; According to the data of Grachyov (2013) |
|||
|
|
Kettle of Lake Baikal |
Total amount (∑) Lake Baikal |
||||
|
Southern |
Central |
Northern |
||||
|
F |
93 |
75 |
83 |
251 |
- |
- |
|
HCO3 |
3021 |
3810 |
3835 |
10668 |
- |
- |
|
Cl |
2477 |
3370 |
3348 |
9195 |
612 |
2500000 |
|
SO4 |
1540 |
550 |
1950 |
4040 |
5962 |
34600000 |
|
NO2 |
118 |
31 |
39 |
188 |
- |
- |
|
NO3 |
213 |
52 |
111 |
376 |
- |
- |
|
PO4 |
2.9 |
2.09 |
2.6 |
4.99 |
- |
- |
|
Ca |
845 |
853 |
1391 |
3089 |
- |
- |
|
Mg |
198 |
208 |
299 |
705 |
- |
- |
|
K |
190 |
181 |
234 |
605 |
- |
- |
|
Na |
397 |
333 |
345 |
1075 |
282 |
21400000 |
|
NH4 |
235 |
83 |
59 |
377 |
- |
- |
|
Mo |
3.70 |
3.12 |
1.31 |
8.13 |
- |
- |
|
Mn |
5.88 |
4.68 |
5.20 |
15.76 |
- |
- |
|
Ba |
3.68 |
2.08 |
2.60 |
8.36 |
- |
- |
|
Al |
13.23 |
13.0 |
7.81 |
34.04 |
- |
- |
|
Pb |
1.47 |
1.04 |
1.30 |
3.81 |
0.22 /3.7* |
2000000 |
|
Ni |
0.74 |
1.04 |
1.29 |
3.07 |
- |
- |
|
Cu |
2.21 |
1.56 |
1.36 |
5.13 |
0.89 /2.2* |
3300000 |
|
Be |
0.74 |
1.04 |
1.03 |
2.81 |
- |
- |
|
V |
0.70 |
1.56 |
1.36 |
3.62 |
0.12 |
2100000 |
|
Cr |
0.71 |
1.50 |
1.20 |
3.41 |
0.14 /1.6* |
1700000 |
|
Fe |
6.62 |
6.14 |
5.20 |
17.96 |
- |
- |
|
Si |
79 |
80 |
53 |
212 |
- |
- |
|
Zn |
2.94 |
2.08 |
1.40 |
6.42 |
69* |
- |
|
Sr |
5.88 |
2.10 |
2.60 |
10.58 |
- |
- |
|
Ti |
1.47 |
1.56 |
1.36 |
4.39 |
- |
- |
|
Co |
0.74 |
1.04 |
1.03 |
2.81 |
- |
- |
|
Cd |
0.70 |
1.04 |
1.00 |
2.74 |
0.7* |
- |
|
Hg |
0.23 |
0.19 |
0.21 |
0.63 |
- |
- |
|
Petroleum products |
36.0 |
24.4 |
32.5 |
92.9 |
- |
- |
|
Dust (suspended insoluble substance) |
80861 |
81016 |
71726 |
233603 |
- |
1,24х1010** |
Table 2 Calculated input of chemical elements and substances in the water area of Lake Baikal through the atmosphere (using the level of the snow pollution)
*, according to the data of B.B. Chebanenko and E.P. Maisuk (2002);
**, Total amount of the substance penetrating into the bottom sediments of Lake Baikal (according to the data of U.A. Bogdanov and others (1997));
The southern kettle of Lake Baikal has the highest input of nitrates, nitrites, ammonium, phosphates, fluorine, aluminum, sodium, barium, molybdenum, manganese, lead, copper, zinc, strontium, mercury and petroleum products into the water area through the atmosphere despite the fact that the southern kettle is twice as small as the northern one. However, the northern kettle has a slightly higher input of sulfates, hydrocarbonates, chlorine, calcium, magnesium and potassium. The central kettle has a higher input of beryllium, vanadium, chromium and cobalt due to the activities of the enterprises, heating plants, thermal power stations located in the littoral zone as well as stove heating, motor vehicle emissions and dust transfer in the poorly snow-covered areas of the central kettle.
Snow cover monitoring of the Lake Baikal water area and adjacent territory has shown that territory pollution from local sources of a zone of atmospheric influence extends to tens of km in the prevailing direction of wind and in the central zone it is replaced regional. Pollution of snow and atmospheric air of the Lake Baikal water area is noted near coastal settlements of Listvyanka, Kultuk, Baikalsk, Slyudyanka, Ust-Barguzin, Severobaikalsk, Nizhneangarsk and in the mouth of the Selenga River. However, the background of most of the studied chemical elements and substances in the Baikal region are low, hundreds and thousands of times below the maximum permissible concentrations. Some components are in deficit such as fluorine which is replenished by the developed aluminum industry of the region.
On receipt of NО2, NO3, NH4 PO4, F, Al, Na, Ba, Mo, Mn, Pb, Cu, Zn, Sr, Hg and oil products on the water area of the lake through the atmosphere the southern hollow is in the lead in spite of the fact that she on the area is almost twice less, than northern. However SО4, H2CO3, Cl, Ca, Mg, K comes a little more to a northern hollow, and Be, V, Cr, Co - to average that is connected with activity of the coastal enterprises, boiler rooms, combined heat and power plant, oven heating, emissions of an automobile transport and natural transfer of dust in low-snow-covered regions of an average hollow. It is revealed that there was over the last 5years15,19 a small increase in regional pollution (by 1,1 – 2times on separate components). Though data for the last 15years11,12,23,24 show that in the late nineties and the beginning of the 2000th years there was a reduction pollution twice that has been connected with recession of industrial production. In general, the results of the field survey and chemical analyses conducted according to the sanitation and hygiene standards show a relatively satisfactory state of the environment of the central zone of the Baikal natural territory in comparison with the developed industrial regions of the country.
None.
Authors declares that there is no conflict of interest.
None.

©2020 Belozertseva, et al. This is an open access article distributed under the terms of the, which permits unrestricted use, distribution, and build upon your work non-commercially.