International Journal of
eISSN: 2576-4454


Research Article Volume 1 Issue 6
1Department of Biology & Institute for Great Lakes Research, Central Michigan University, USA
2Great Lakes Research Center and Michigan Technological Research Institute, Michigan Technological University, USA
3Lake Michigan Field Station, NOAA-GLERL, USA
4Water Center, University of Michigan, USA
Correspondence: Carrick HJ, Department of Biology & Institute for Great Lakes Research, Central Michigan University, USA
Received: November 17, 2017 | Published: December 12, 2017
Citation: Carrick HJ, Cafferty E, Ilacqua A et al. Seasonal abundance, biomass and morphological diversity of picoplankton in lake superior: importance of water column mixing. Int J Hydro. 2017;1(6):187-197. DOI: 10.15406/ijh.2017.01.00034
Picoplankton often regulate the trophic dynamics and key biogeochemical cycles in pelagic environments. That said, comparatively little I known about their seasonal contribution to carbon cycling in Lake Superior, one of the largest lakes world-wide, where attempts to reconcile the carbon and N budgets have not been straightforward. Here, we presented some of few seasonal estimates for both heterotrophic (Hpico) and phototrophic (Ppico) picoplankton abundance, biomass, and morphological diversity in Lake Superior (n=36). Seasonal samples were collected at two offshore stations in the central basin of Lake Superior on six cruises conducted at monthly intervals (May- October 2013). Fractionated chlorophyll analysis revealed that algae in the 2-20 μm size category (nanoplankton) constituted > 50% of the assemblage while the Ppico size fraction constituted ~25% (total chlorophyll < 1 μg • L-1). The Hpico assemblage was dominated by simply cocci-forms (i.e., eubacteria). Hpico abundance ranged from 140 to 871 x 103 cells • mL-1, and on average, supported ~8-fold greater numbers compared with the abundance of Ppico (19 to 146 x 103 cells • mL-1). Ppico was dominated by phycoerythrin-rich, single-celled taxa, whose abundance was relatively constant from May-September. The concentration of chlorophyll, Hpico (bacteria), and pico- eukaryotes increased with mixing depth; however, chlorophyll and Ppico numbers exhibited a 2-fold increase in October when bacterial numbers were at their lowest level. Despite these differences in seasonal dynamics, overall carbon estimates for both Hpico and Ppico were comparable, and collectively constituted a substantial faction of plankton carbon in the lake (mean 11.27 and 11.00 μgC • L-1, respectively), indicating their importance in reconciling the carbon budget for Lake Superior.
Pico and nano-sized plankton play an important role in regulating the trophic dynamics and key biogeochemical cycles in most pelagic environments, such changes in their abundance and population dynamics can alter ecosystem-level changes.1,2 Both heterotrophic (Hpico) and phototrophic (Ppico) picoplankton are particularly important in oligotrophic lakes, with deep water column depths and long residence times.3,4 In ecosystems such as these, Ppico contribute significantly or dominate phytoplankton biomass and primary production,5 while Hpico often dominate heterotrophic metabolism and augment secondary production.6−8 Despite this, our knowledge of how plankton influence biogeochemical budgets in large ecosystems remains fragmented, because the analysis of picoplankton requires specific methods that often are not routinely used in long term monitoring programs.9,10 Given this, estimates of picoplankton abundance and biomass do not often exist, and if they do, most are very limited in time and space (few measurements at few locations made per year, e.g., Ivanikova et al.11) and rarely are include both heterotrophic and phototrophic components of the assemblage.12 Lake Superior is one of the largest lakes world-wide, where biogeochemical mis-balances have been identified, and initial estimates of the plankton assemblage suggest dominance by small plankton.11 Significant discrepancies have been identified in the carbon balance for this lake, whereby attempts to reconcile the carbon mass balance have not been successful.13,14 One possible explanation for the apparent misbalance might be attributed to the turnover rates of small heterotrophic and phototrophic plankton that has not been adequately incorporated into the modeling efforts needed to close the Lake Superior’s carbon cycle.15 With this in mind, the first step is to establish reliable, first-order estimates of picoplankton abundance and biomass. Thus, we present some of the only seasonal estimates of abundance, biomass, and morphological diversity for the entire picoplankton assemblage in Lake Superior (both heterotrophic and phototrophic components). There were three specific objectives in the study. First, we censused both heterotrophic and phototrophic picoplankton abundance in Lake Superior over the May to October period (three seasons) which captured a broad range of environmental conditions in the lake (warm monomictic lake); Second, we assessed the morphological variation in the picoplankton assemblage. Third, measured we biomass of the entire picoplankton assemblage relative to other measurement so plankton biomass.
Lake sampling
The offshore waters in Lake Superior were sampled on six cruises schedule at approximately monthly intervals in 2013 (May, June, July, August, September, and October) aboard the research vessel R/V Agassiz. Two offshore stations were routinely sampled in the central basin of the lake (Figure 1); the stations were LS-1 (longitude 88.575375, latitude 47.464595) and LS-2 (longitude 88.59778, latitude 47.64387). To evaluate spatial variation in plankton abundance, biomass, and morphological diversity samples were collected at 4 and 2 additional stations in July and September, respectively (Figure 1). At all stations, water column profiles (0.1m resolution) were determined for key physical-chemical parameters using a Seabird CTD equipped with a suite of sensors (e.g., temperature, depth, conductivity, PAR, quantum yields and chlorophyll fluorescence). The water column was sampled according to information collected from the CTD profiles, to ensure samples were retrieved from thermal strata present in the water column in the lake during each research cruise (isothermal, epilimnion, metalimnion, and hypolimnion). All water samples were collected using modified, trace metal clean 5-L Niskin bottles; collected water was poured into 20-L carboys and then dispensed into dark 4-L bottles (polycarbonate) for subsequent analysis. Plankton samples for enumeration were preserved with 1% gluteraldehyde (final conc) in 250 ml amber bottles (stored at 20 °C). Samples for flow cytometry were dispensed into 4.5 ml cryo-tubes, preserved with 1% paraformaldehyde, and immediately stored at -80 °C. Size fractionated chlorophyll analyses were carried out using raw lake water that was processed within hours of collection.
Size-Specific chlorophyll
Size-specific plankton biomass was estimated from chlorophyll-a measurements made by passing collected lakewater through a series of screens (n=50). Duplicate water samples were passed separately through three screens with specific pore sizes (2.0-µm Nuclepore filters, 20-µm nitex mesh, and raw untreated water, see Fahnenstiel and Carrick 1992). The filtrate was subsequently concentrated onto filter membranes (Whatman GFF, 0.7 µm pore size) and the pigments extracted for 1 h in a 45:45:10 mixture of Acetone: DMSO: Water16 without grinding.17 Chlorophyll-a concentrations were corrected for phaeopigments and chlorophyll- b interference18 and coefficients of variation among samples were typically < 5%. Chlorophyll concentrations were estimated for three major plankton size categories (picoplankton 2-µm; nanoplankton 2-20 µm; microplankton > 20 µm) following the terminology of Omori & Ikeda.19
Epifluorescence microscopy
The abundance of heterotrophic (Hpico) and phototrophic (Ppico) picoplankton was measured on preserved samples by concentrating aliquots of lake water onto 0.2-µm nominal pore-size black polycarbonate filters (25-mm diameter; Poretics); these samples were subsequently analyzed using epifluorescence microscopy.20,21 Hpico abundance was measured by direct counts (0.1-0.5 mL) using the acridine orange (AO) method.22 This method was validated through a direct comparison, whereby a duplicate set of Hpico samples were prepared with AO and Sybr-green stain (paired t-test; T=0.249, p=0.81, df=11); no difference was observed between methods which conformed with previous studies.23 As such, we routinely used the AO method of direct counting because it allowed us to make direct comparisons with previous studies in the Great Lakes, and was more affordable. Ppico abundance measurements were made by direct counts (5-20 mL) of unstained water samples.5 All slides were enumerated by counting ~400 cells using a research grade, Leica DMR 5000 (Wetzlar, Germany) research microscope (1000× magnification) equipped for chlorophyll and acridine fluorescence (blue light 450-490 nm excitation and > 515 nm emission), as well as, determination of phycoerythrin (green light 530-560 nm excitation and > 580 nm emission). Dominant pigment fluorescence of individual cells was used to assign general taxonomic (phylum) position,21‒24 Counting error was estimated among duplicate counts were generally < 10%.21 Cells were tallied into morphological categories based upon gross cell morphology and colony arrangement as outlined by Wehr et al.; 25 the phylogeny proposed by Komarek & Anagnostidis26 was used for the cyanobacteria.
Flow cytometry
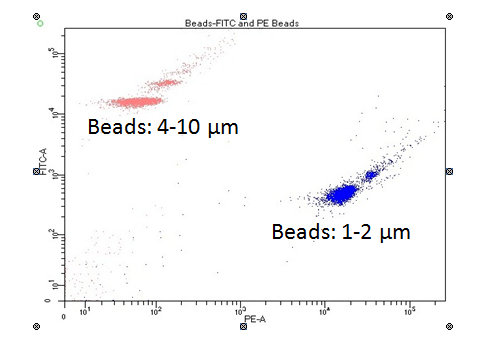
We utilized a series of flow cytometry measurements to obtain independent estimates for picoplankton abundance and general morphology.27 Cell density and size was estimated from water samples analyzed using a FACS Aria II from Becton Dickinson Biosciences; this instrument configuration consists of 4 lasers: (UV laser (355 nm @ 20 mW); blue laser (488 nm @ 200 mW); yellow-green laser (561 nm @ 100 mW); red laser 637 nm @ 140 mW). Water samples stored at -80 °C were thawed at 20 °C, drawn through a flow-cell using a 70-µm aperture (BD FACS sheath fluid, Cat no. 34003), and subsequently exposed to blue (488 nm) and yellow-green (561 nm) excitation lasers. For Ppico samples, resulting data was collected using several detectors; the data presented here was obtained using two detectors (PE 586/15 nm; FITC 530/30 nm), side scatter, and forward scatter. Generally, the instrument was allowed to collect data for 3 min, which corresponded to an aliquot of ~0.25 ml of lake water that was analyzed for each sample (manufacture flow rate of ~80-90 µl min-1). The data collected was post-processed using a series of bivariate plots generated using BD FACSDiva™ software (version 8.0.1); these data were used to estimate cell density, autofluoresence qualities, and approximate cell size. A series of standardized polystyrene beads (1, 2, 4, 6, and 10 µm in size; Life Technologies Cat. No. 13838, 13839) were used to set up data collection gates, as well as, evaluate the counting efficiency of the instrument. BD calibration fluorescence beads (Cat. No. 349502) for FITC (488 nm) and PE (586 nm) were also used for positive detection gating. Instrument threshold setting were optimized to minimize signal to noise ratio. The beginning and ending volume of samples were measured using a standard balance; these data were used to estimate the actual volume of sample analyzed so that cell density could be calculated directly for a subset of our samples (n=12).
Statistics
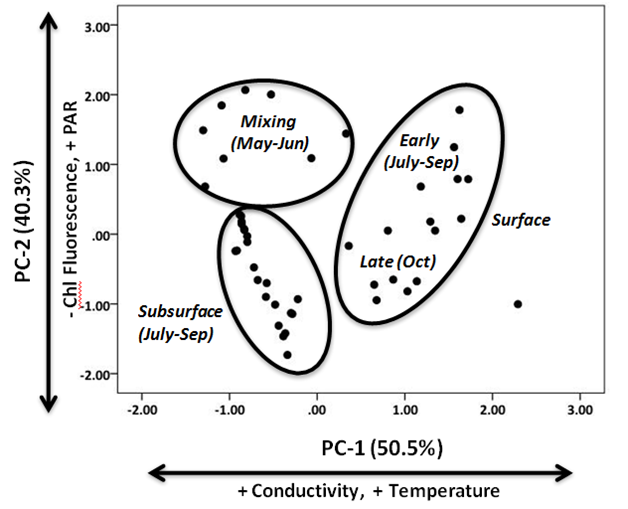
Environmental variation among samples was evaluated using a factor analysis ordination, where the 46 water column sampling events (lake, date, depth combinations) were considered observations and the 11 biogeochemical parameters measured here were considered variables (latitude, longitude, distance from shore, conductivity, temperature, depth, in vivo fluorescence, in vivo phycocyanin, chlorophyll, PAR). Data were log transformed to meet assumptions of normality and to standardize numerical values; these data were assembled into a 46 x 11 data matrix. Factor analysis was then performed on the correlation matrix among variables (principal components analysis, PCA). Factors with eigenvalues > 1.0 were retained for interpretation and axes were rotated using the Varimax method.28 Iterative analyses were run to select the smallest subset of variables that best described variation among the 46 water column samples (4 variables). The observations were scored into the space defined by the newly derived factors; groupings were arranged by visual inspection (Figure 3). Spatio-temporal variation in the chlorophyll and picoplankton abundance among water column sampling events were evaluated using two-way, multivariate analysis of variance (MANOVA). No differences were detected for chlorophyll, Hpico abundance, and Ppico abundance among the six sampling stations (one-way ANOVA, p > 0.70 for all). Thus, data for all stations were pooled to evaluate variation in key dependent variables (chlorophyll, Hpico, Ppico) among sampling dates (May, June, July, August, September, October) and water column strata (epi, meta, hypolimnia) which were considered fixed factors.29 Pairwise comparisons were made with Student Newman Kuel’s multiple means comparisons (alpha 0.05).
Water column conditions
During this study, Lake Superior exhibited typical seasonal changes in temperature and other biogeochemical characteristics with depth in the water column;30,31 these seasonal patterns (monthly) were consistent among the two offshore stations sampled here (Figure 2 for profiles taken at LS-1). In May and June, the water column at both stations was isothermal average temperature (2.3-3.3 °C among depths); conductivity and chlorophyll exhibited iso-grade profiles with depth and the photic zone occupied the upper 40 m of the water column (>1% surface irradiance). In July, the water column began to stratify with surface temperature of 5-7 °C in the upper 15 m of the water column; water below 15 m was ~4.5 °C throughout. The photic zone was 39-42 m in depth and a deep chlorophyll layer was present at 30 m depth. Interestingly, some differences were noted at LS2, where the water temperatures were isothermal at 4.5 °C. In August, a well-developed thermocline was present (15 to 30 m depth); the epilimnion temperature was 12-16 °C and occupied the upper 15 m of the water column. The hypolimnion was present at >40 m depth, where water temperatures ranged from 4.6 to 3.3 °C. At this time, a deep chlorophyll maximum was evident in the vicinity below the thermocline (peak at 40 m depth) and the photic zone extended to a depth of between 30-35 m depth at the two stations with absolute PAR values in the surface waters < 400 µmols due to cloud cover. During September, the thermocline depth had become more pronounced and deepened to 15-35 m in depth, although the epilimnion temperature showed no change from July. Again, chlorophyll concentrations in the deep chlorophyll layer were 3-4 fold higher compared with those in the epilimnion. The photic zone extended to a depth of ~35 m. In October, surface water began to cool (epilimnion temperature 9-10 °C), the depth of the epilimnion deepened to 40m. At this time, the deep chlorophyll layer had disappeared and the depth of the photic zone extended to a depth of approximately 30 m. An ordination of water column variables produced 2 principal components (PC) with eigenvalues > 1.00. Both components were correlated strongly with original variables and collectively accounted for > 90% of the variation in the dataset. Once scored into the space defined by the two PCs, the 46 sampling events formed 3 groups that corresponded well with thermal periods (mixing, stratified; Figure 3). PC-1 accounted for 50.2% of the variation; this axis correlated positively with water temperature and conductivity (r > 0.90 for both). In general, sampling events sorted out along PC-1 according to the thermal conditions of the water column, and thus it appeared to be a proxy for mixing depth. Samples with warm temperatures and higher conductivity scored positively with PC-1, and these samples were collected from surface waters following thermal stratification. Samples collected from colder, low conductance water, had negative scores along this axis. These observations corresponded with samples collected during the spring mixing period or deeper in three water column (either meta- or hypolimnia; Figure 3). The temperature of these deeper samples was generally < 7 °C. PC-2 accounted for 40.3% of the variation; this axis correlated positively with PAR and negatively with in vivo fluorescence. In general, PC-2 seemed to define a productive gradient defined by changes in the light climate of the water column and chlorophyll concentrations. This makes sense as subsurface samples supported the greatest chlorophyll concentrations at correspondingly lower PAR. Interestingly, the surface assemblage transitioned between the spring mixing (early) and subsurface conditions (late).
Size-specific chlorophyll concentrations
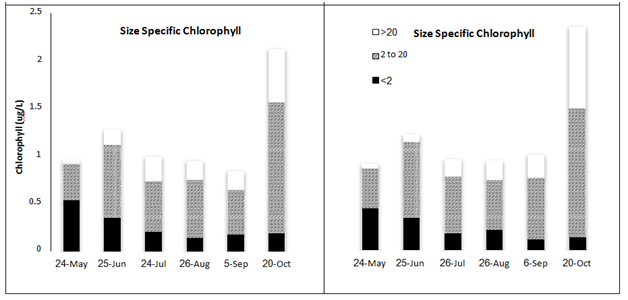
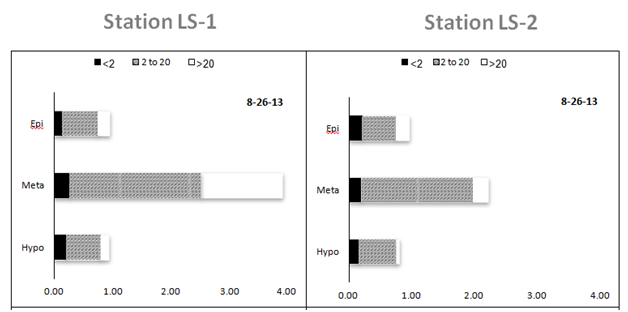
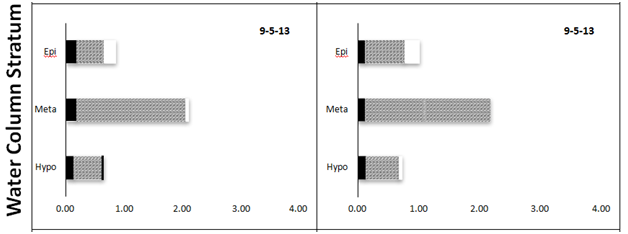
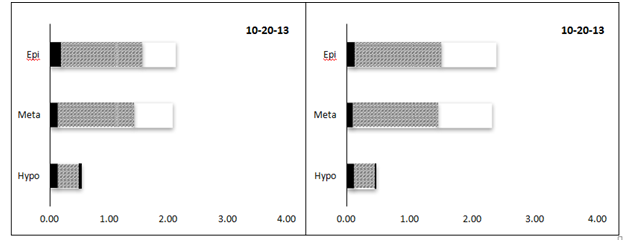
Overall, chlorophyll concentrations ranged from 0.47 to 3.91 µg L-1 among the 60 samples collected from central Lake Superior and analyzed here (Table 1). Significant differences among sampling dates and water strata were observed (two-way MANOVA). Chlorophyll values were similar among most sampling dates (< 1 µg L-1, May-August), although the bloom event captured in October represented a 2-fold increase at both LS-1 and LS-2; these values were significantly greater compared with values measured in May (F=3.9, p<0.011, Figure 4). Strong differences in chlorophyll concentrations were between depths in the water column, with the greatest chlorophyll concentrations measured in the metalimnion, where concentrations increased 2-fold compared with concentrations measured in the epi and hypolimnion (F=20.8, p<0.0001). Again, these difference were readily observed at LS-1 and LS-2, where subsurface chlorophyll maxima were evident in the metalimnion during August and September (Figure 5). The subsurface maximum was no longer present in October during an apparent fall bloom throughout the photic zone, when chlorophyll in both the epi- and metalimnion were higher (Figure 5). The chlorophyll concentrations were not different among the 6 stations (one-way ANOVA, F=0.42, p>0.83). Using fractionated chlorophyll-a as a proxy, the phytoplankton assemblage in Lake Superior was dominated by algae in the 2-20 µm size category (nanoplankton, Table 1). These organisms constituted > 50% of the assemblage regardless of sampling date, depth, or sampling stations (Figure 4) (Figure5). The pico plankton size fraction constituted ~25% of the assemblage; the contribution of pico plankton was lowest in the metalimnion, where they made up < 10% of the total chlorophyll. The nanoplankton also dominated the assemblage at all stations contributing > 50% to the total standing stock of chlorophyll among all samples (Table 1). The micro plankton (> 20 µm) component contributed 15-18% to total chlorophyll in the lake, and this percentage did not change significantly with depth.

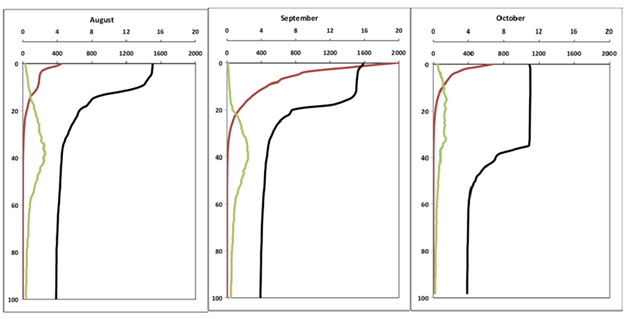
oC,Temperature; units: In vivo Fluorescence; PAR (µmol); m, Depth
Strata |
Statistic |
<2 µm % |
2-20 µm % |
>20 µm % |
Total µg L-1 |
Epilimnion |
Average |
18.8 |
61.6 |
19.7 |
1.24 |
n=21 |
Std. deviation |
11.2 |
8.8 |
10.2 |
0.38 |
Metalimnion |
Average |
6.7 |
74.7 |
18.6 |
2.28 |
n=11 |
Std. deviation |
1.4 |
15.2 |
15.3 |
0.6 |
Hypolimnion |
Average |
20.9 |
63.4 |
15.7 |
0.94 |
n=14 |
Std. deviation |
12.5 |
18.7 |
18.5 |
0.38 |
Table 1 Chlorophyll concentrations distributed among plankton size groups (pico, nano, and microplankton) collected from three depth strata in Lake Superior
Variation in picoplankton abundance
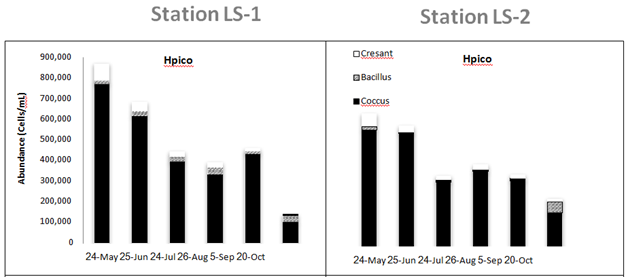
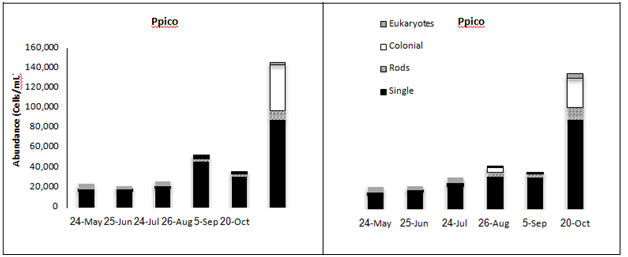
Hpico abundance ranged from 140 to 871 x 103 cells • mL-1 and exhibited considerable temporal variation in Lake Superior (Table 2 & Figure 4). Estimates of Hpico abundance determined using the same direct cell counting methodology have been shown to agree very well with abundance estimates determined using flow cytometry (person rank correlation r=0.732, p<0.01, n=12;).32 Moreover, proxies for cell size derived from side scatter (SS) showed that the majority of cells in these samples ranged in size from 0.03 to 0.7 um in size; a factor that was comparable with the populations present in Lake Superior (Carrick unpublished data). These results indicated that our counting procedures appear to be sound and thus our estimates for Hpico abundance (bacteria) were reasonable. There was no difference in Hpico abundance among the six sampling stations (one-way ANOVA, p>0.75). The greatest source of variation in Hpico abundance was seasonal (Two-way MANOVA, F=13.6, p<0.0001), whereas no differences were observed among water column strata (F=0.01, p=0.72). Overall, Hpico abundance declined significantly over the sampling period, such that the May and October samples were different from one another, with higher numbers in the other months. This pattern was evident as both LS1 and LS2, where a decline in numbers of 5 and 4-fold was observed; Hpico numbers at these stations were 871 103 cells • mL-1 in May and declined to 140 x 106 cells • mL-1 in October (Figure 4). Ppico abundance ranged from 19 to 146 x 103 cells • mL-1 and was (on average) nearly an order of magnitude lower compared with Hpico abundance (Table 2) (Figure 4). The density of cells as derived from epifluorescence cells counts of Lake Superior Ppico populations also agreed well with estimates obtained using flow cytometry, based upon a subset of samples where pair-wise samples were analyzed using both methods (Pearson rank correlation, r=0.637, p=0.035, n=12). Ppico abundance was different among sampling dates and water column strata (two-way MANOVA). Overall, Ppico numbers were different among most dates, with the lowest numbers occurring in May and June (2 to 30 x 103 cells • mL-1); successive increases in abundance were observed in July, August/September, and October when the numbers at both LS-1 and LS-2 increased more than 4-fold from to >120 x 103 cells • mL-1 (F=18.7, p<0.0001). Ppico abundance increased 3-fold in the metalimnion compared with populations in both the epi- and hypolimnia (F=9.7, p< 0.001). Ppico abundance was not different among the six sampling stations (one-way ANOVA, F=0.52, p>0.76).
Group |
Strata |
n |
Mean cells ml-1 |
Minimum cells ml-1 |
Maximum cells ml-1 |
Carbon µgL-1 |
Hpico |
Epilimnion |
19 |
449,485 |
140,224 |
871,529 |
11.27 |
Metalimnion |
10 |
436,638 |
165,519 |
579,133 |
10.95 |
|
Hypolimnion |
7 |
584,246 |
340,635 |
825,237 |
14.65 |
|
Ppico |
Epilimnion |
19 |
48,225 |
21,406 |
145,599 |
11 |
Metalimnion |
10 |
100,547 |
70,758 |
142,054 |
22.92 |
|
|
Hypolimnion |
7 |
30,624 |
19,235 |
66,394 |
4.39 |
Table 2 Abundance estimates (cell mL-1) for picoplankton assemblages collected from three depth strata in Lake Superior. Carbon estimates assume cellular biovolume estimates of 0.06um3 and 0.60µm3 for Hpico and Ppico, respectively (Carrick unpublished). Biovolume estimates were converted to carbon assuming 0.38 pg µm-3.23
Picoplankton morphological diversity
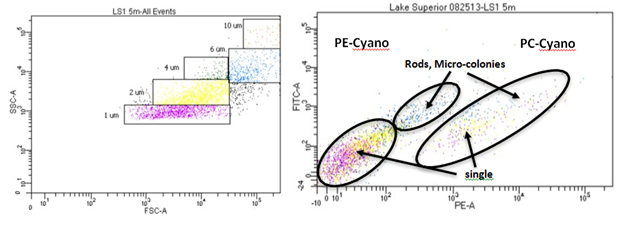
The picoplankton assemblage present in Lake Superior displayed modest morphological diversity, as several groups were present throughout the sampling period (Figure 4). The Hpico assemblage supported three primary morphological types (crescent-shaped, bacillus, cocci), although the assemblage was numerically dominated by cocci forms that constituted 90% of the cells in nearly all samples (Figure 4). Crescent- shaped and bacillus forms were minor contributors, each constituting approximately 5% to total numbers present in any given sample. Interestingly, the Hpico abundance was relatively homogeneous throughout the water column and this pattern was consistent among the six sampling stations in July (Figure 4). The Ppico assemblage was composed of several morphological forms of prokaryotes and a group of eukaryotic cells. Single-celled, picocyanobacteria was the dominant morpho-type present in Lake Superior, regardless of the date or depth of stations sampled; these organisms constituted 70-80% of total Ppico abundance. Rod- shaped and colonial forms were more abundance during late stratification (after July, water temperatures > 10 °C) in the surface waters (Figure 4). Moreover, the large increase in Ppico numbers in October was (in part) made up of colonial prokaryotic cells (chain-forming). The seasonal pattern was similar between the five stations where data was available (Figure 4) (Table 2). Picoeukaryotes were abundance during spring and early stratification when water temperatures were generally < 10 oC (Figure 4). These organisms were more uniformly distributed with depth (range 102 to 103 cells/ml), but constituted a greater proportion of algal biomass in the hypolimnion (depths > 60 m, Table 1). Flow cytometry measurements were useful in verifying our abundance estimates for Lake Superior picoplankton (see above), as well as, evaluating seasonal variation in their morphological diversity. These results augmented our microscope count data, whereby several sub-populations were typically present in samples that bore differing pigment composition (Figure 4) (Figure 6). In August, the assemblage was dominated by phycoerythrin-rich (PE, yellow fluorescence emission) single cells approximately 1 µm in size (Figure 6A) and sub-dominated phycocyanin-rich single cells (PC, orange fluorescence emission, Figure 6A). Less abundance still, rods and micro-colonies that were both PE and PC-rich, constituted a small component of the assemblage. During the October sampling period, the assemblage changed somewhat; the assemblage was still dominated by PE-rich, single cells (~1 µm in size), although rods and micro-colonies (most PC-rich) increased in abundance and constitute a greater fraction of the assemblage (Figure 6B). These organisms were either larger, single cells in the case of rods (~2 µm in size) or occurred as groups of cells (colonies of 4-10 cells), whose overall size was 4-10 µm. The presences of chlorophyll-rich cells were not abundance during these sampling periods (Figure 6).

Picoplankton distribution in lake superior relative to other large ecosystems
A major component of global productivity is tied to the World’s oceans, with the majority of that production has been attributed to the growth of phototrophic picoplankton, Ppico.32−35 While a growing number of studies have demonstrated the importance of Ppico in large lakes, few studies have characterized their seasonal contribution to plankton assemblage.36−39 This gap in our knowledge probably exists, because picoplankton are not routinely measured in most.9 Our data from Lake Superior has shown that both heterotrophic and phototrophic picoplankton were major contributors to the plankton assemblage in terms of their seasonal biomass; this was true in all samples, regardless of date or depth. The abundance of Hpico (bacteria) in the water column ranged from 140 to 871 x 103 cells • mL-1, and on average, supported ~8 fold greater numbers compared with the abundance of Ppico (19 to 146 x 103 cells • mL-1). The abundance of Hpico measured here were similar to those made in oligotrophic lakes and low productivity sites in the ocean,40 and comparable to minimum values determined in mesotrophic lakes such as Lake Constance in Germany.41 That said, few seasonal estimates of Hpico abundances have been made in the North American, Laurentian Great Lakes; however, of those that do exist, Hpico abundances in Lake Superior were similar to previous reports. For example, Pascoe and Hicks42 reported a total prokaryote abundance of 880 x 103 cells • mL-1from one sample in Lake Superior. This was the lowest value they reported among individual grab samples taken from all five Great Lakes, but was comparable to the highest values we reported here (Table 2). Scavia et al.12 reported a seasonal range in Hpico abundance ranging from 600 to 1,100 x 103 cells • mL-1 at an offshore station in Lake Michigan; their estimates were generally 50% greater than those presented here (seasonal average). The chlorophyll concentrations at the Lake Michigan station (range 1.0 to 3.0 µg • L-1) in 1980 were higher than those measured at the six Lake Superior stations sampled here (range 0.5 to 1.5 µg • L-1), therefore any difference were likely attributable to differences in lake productivity between these lakes. The abundance of both Ppico in Lake Superior were similar to that reported from other oligotrophic lakes and marine systems;43,44 the density fell within the range reported for lakes with similar chlorophyll concentrations of ~1 µg • L-1 using the regression analysis presented by Callieri and Stockner.4 For instance, our average estimates for Ppico abundance in the surface and deep waters (Table 2) were similar to those first reported for the central basin of Lake Superior in 1979 (Fahnenstiel et al. 1986), as well as, those reported from 4 samples collected more recently from the western basin of Lake Superior.11 Furthermore, Ppico abundance in Lake Superior was lower compared with historic estimates made in the other four Great Lakes including Lake Ontario,45 Lake Erie,46 and Lakes Huron and Michigan.5 This is not surprising; beaqcuse at the time these studies were done, Lake Superior was less productive relative to these other lakes and had 2-4 fold lower chlorophyll concentrations.47 That said, the relationship between Ppico abundance (contribution) and total chlorophyll is not always a simple one. Several comparative studies have shown a decline in the contribution of Ppico with increasing total chlorophyll,3 although some productive lakes do support high Ppico biomass and considerable contribution (30-50%) to total phytoplankton biomass.21‒49 The < 2µm chlorophyll fraction measured in the epilimnion of Lake Superior in this study (average +/- one std; 18.8%, +/- 11.2%, n=21) was almost 2-fold lower compared with the measurements made in the western basin of Lake Superior.50 Because the relative productivity between basins is not large, these results suggest that there may be other factors at play that might regulate phytoplankton size structure in the lake (e.g., differences in food web structure). Finally, the deep chlorophyll maximum (DCM) is a important and characteristic feature in deep, oligotrophic lakes and marine environments.51 Previous data from Lake Superior indicate that presence of a DCM is a persistent feature during thermal stratification, when chlorophyll levels are generally 2-3 fold greater relative to concentrations in the surface mixed layer31−52 While the abundance of Ppico increased significantly in the surface chlorophyll maximum, their percent contribution declined by approximately 50% (Figure 5).
Morphological diversity of picoplankton in lake superior
Synechococcus and Prochlorococcus are two taxa that often co-dominate marine phototrophic assemblages53 and are considered the major primary producers in the open ocean.54,55 While they are widely distributed in areas ranging from the tropics56 to the northern Atlantic,54 there is no evidence that Prochlorococcus was present in any of our samples. Interestingly, Prochlorococcus appears to replace Synechococcus in the most nutrient-poor regions in the ocean as well as, colder waters characteristic of north Atlantic waters.57 Moreover, other picoeukaryotes dominate the base of the photic zone, characterized by deep, cold water, with low light illuminations (<1% incident light). That said, the Ppico assemblage in Lake Superior was co- dominated by phycoerythrin-rich (PE), single-celled Synechochoccus, and some larger, single-celled organisms (probably Cyanobium) the numbers of which displayed relative constancy in surface water samples. Our microscopic analysis identified other, key morphological groups of Ppico, namely rod-shaped single celled and short-chained aggregates, probably belonging to the genus Synechococcus.26 A third morpho-group of colonial cyanobacterial Ppico taxa (phycocyanin-rich) was identified that most likely belonged to the genera Synechocystis (micro-colonies of 8-16 cells), Aphanocapsa, and Snowella (both colonies > 10 cells, see).26 These micro-colonies of picocyanobacteria were most abundance in the epilimnion during thermal stratification in Lake Superior, although they never made up more than 20% of the assemblage. This pattern is similar to that observed in other lakes, where warmer waters supported higher abundance of colonial Ppico perhaps due to their high growth potential and resistance to grazing pressure during this period compared with single-celled forms.58 That said, their peak occurrence during the summer months in the epilimnion is common among the other four Great Lakes where Ppico seasonal distribution has been studied,26‒46 as well as, in oceanic and coastal estuarine areas where high temperature and low nutrient availability promote Ppico dominance Agawin 2000. We found no evidence for the existence of Prochlorococcus in Lake Superior, nor from the other previous studies on the Great Lakes that specifically evaluated samples for its presence.59−62 Instead, chlorophyll-rich eukaryotes were present as minor contributors to the assemblage throughout the year in Lake Superior; their populations appear to be important during specific spatio-temporal windows (spring and summer deep chlorophyll layer). The pico-eukaryote was observed in our samples that appeared to be representatives of single-celled organisms likely belong to the genera Chloricystis63 and a colonial form of Oocystis sp.64 Both taxa occurred in colder waters <10 °C, thereby occupying a larger niche in Lake Superior compared with their occurrence during the spring in Lakes Erie46 or Michigan and Huron.5 Ivanikova et al.11 also presented data for pico-eukaryotes in Lake Superior (n=4) that ranged from 2.8 to 7.2 x 10³ cells • mL-1; these estimates were comparable those measured here (Table 2). In the Baltic Sea, pico-eukaryotes had larger populations that were more widely distributed throughout the year; interestingly, this lake did not warm above 15 °C.65 The Hpico assemblage was dominated single-celled, bacteria (cocci), while there were other morphological groups observed (e.g., crescent, colonial). These growth forms occurred throughout all the periods and water column depths sampled here (May- October) and are similar to those described previously from lakes studies where assemblages were dominated by small cells with simple geometry.66 However, drawing links between the picoplankton morphological groups identified here versus potential phylogenic identify of these groups is crude at best when relying on observations using epifluorescence, and therefore not realistic. That said, numerous phylogenetic studies have shown that the Hpico assemblage in Lake Superior is largely dominated by bacteria, with Archea and Eukarya representing relatively rare components.42‒67 More recent studies have identified important ammonia-oxidizing bacteria and Archaea present in Lake Superior (sediments) that may play a role in the N imbalance in the lake.68 Our work here can further this research by providing more intensive spatio- temporal measurements regarding the gross abundance and turnover of the collective Hpico assemblage in the lake. In turn, these measurements can be used to evaluate the influence such food web interactions may have on nitrate production in the lake.69
Picoplankton seasonality and water column mixing
In Lake Superior, most of the variation in the picoplankton assemblage appeared to covary with physical, water column conditions that marked key changes in abundance and taxonomic composition (Figure 3)(Table 3). Hpico (bacteria) and pico-eukaryotes achieved their greatest abundance when mixing depths were large (negative correlation with PC-1, Table 3). This makes sense in that the pico-eukaryotic component of the picoplankton assemblage can occupy a cold water niche, a condition reflected by deep mixing depths (3-9 °C ), or subsurface and deep water habitats in the meta- and/or hypolimnion.59 That said, the mechanism driving the decline in Hpico (bacterial) abundance with higher temperature is less obvious, because bacterial abundance and growth is closely correlated with increasing temperature in other lakes such as Lake Michigan.70 Thus, this pattern may be driven by loss factors such as bacterial grazing by microzooplankton, which does increase with temperature and has been shown to be most intense in the surface, mixed-layer in other Great Lakes.5 The greatest concentrations of chlorophyll and pico-cyanobacterial numbers occurred in the subsurface assemblage (positive correlation with PC-2, Table 3); this assemblage appeared to be a mix of the spring and summer assemblages and was similar in taxonomic composition to the subsurface assemblages in Lakes Huron and Michigan.5 Finally, when the mixed layer deepened in October, a surface bloom of phytoplankton was observed, whose Ppico taxonomic composition was reminiscent of the subsurface assemblage. Phytoplankton blooms during late stratification deep mixing periods have been observed in the other Great Lakes,46 and are likely driven by the upwelling of nutrients injected from deep (40-50 m depth), nutrient-rich waters. Moreover, late summer/early fall seasonal blooms of nano and micro-sized phytoplankton, like the one we observed in October, have been documented for Lake Superior in previous years.31−52 Overall, there was remarkable constancy in Ppico numbers between May and September at both stations sampled here (LS-1 and LS-2). Fahnenstiel et al.71 also observed striking constancy in their size-fractionated primary production estimates measured in Lake Superior over a similar temporal period (May-Oct). This is in contrast to the seasonal pattern observed in both Lakes Michigan and Huron (surface mixed layer), where Ppico abundance exhibited a unimodal, mid-summer peak that was (again) closely correlated with water temperature.5 The same was observed for Ppico in Lake Ontario.45‒72 Because the intensity and duration of thermal stratification is less in monomictic Lake Superior compared with the four other Great Lakes (and most other large lakes world- wide, see Herdendorf),73 we believe the colder temperatures and deeper mixing depth in this lake were a major factor that shaped the seasonal dynamics of picoplankton in the lake. Future projections derived from climate models predict that thermal stratification will be extended in Lake Superior, as characterized by higher lake water (surface and deep) temperatures;74 changes such as these would be alter or amplify the seasonal patterns identified here.
Variable |
Statistic |
Principal component-1 stratification |
Principal component-2 productivity |
Chlorophyll |
r-value probability n |
0.114 |
-0.578 |
0.45 |
0 |
||
46 |
46 |
||
Hpico |
r-value probability n |
-0.557 |
0.161 |
0.001 |
0.362 |
||
34 |
34 |
||
Ppico |
r-value probability N |
0.127 |
-0.641 |
0.475 |
0 |
||
34 |
34 |
||
Pico- cyanobacteria |
r-value probability N |
0.169 |
-0.624 |
0.339 |
0 |
||
34 |
34 |
||
Pico- eukaryote |
r-value probability N |
-0.474 |
0.313 |
0.005 |
0.072 |
||
|
|
34 |
34 |
Table 3 Pearson correlations between plankton abundance estimates (chlorophyll, abundance of picoplankton groups) and habitat attributes as represented by principal components analysis (and associated interpretation)
Contribution to plankton biomass
Our estimates of picoplankton biomass (as cellular carbon) indicate that picoplankton contribute significantly to both heterotrophic and phototrophic carbon pools in Lake Superior, and thus, underscore the importance of making these measurements. Our estimates for Hpico and Ppico carbon were similar to one another, ranging from 3.5 to 21.9 and 4.4 to 33.2 µg CL-1, respectively (Tables 2)(Table 4). Interestingly, these values bracketed some of the only picoplankton biomass estimates that were measured by Fahnenstiel et al.75 from samples collected nearly 20 years previously (August 1995) from the central and eastern basins of Lake Superior (Table 3). Moreover, our average, epilimnetic Ppico carbon was 11.0 (n=19) compared with 37.6 µg CL-1 for the lake-wide average of phytoplankton >2 µm in size.76 When these estimates were added to one another, the Ppico fraction constituted 24.0% of total phytoplankton carbon, a value that was strikingly similar to our estimate for Ppico contribution based upon <2 µm fractionated chlorophyll (mean +/- one sd: 25.5 +/- 17.8, Table 1). Our Ppico carbon estimates also rival those for the >2µm phytoplankton assemblage measured during the USEPA basin wide survey lake77 & Table 3. Last, our collective estimates for picoplankton constituted between 15% and 30% of the <1µm fraction of seston in Lake Superior, as measured by78 in the western basin (July). Taken together, these comparisons seem to underscore the quantitative importance of picoplankton in Lake Superior, and also suggest the relative constancy the assemblage, not only seasonally, but inter-annually over the past 20-30 years.32As such, the picoplankton component of the plankton may serve as an important basal resource to the pelagic food, providing relative stability for the diversity of consumers that are likely to rely on them through both direct (grazing) and indirectly (nutrient cycling) trophic linkages.79‒83
Type |
Location |
n |
Range carbon µg cl-1 |
Source |
Hpico |
Central 2013 |
27 |
3.5 to 21.9 |
This study |
Hpico |
Central- East 1995 |
3 |
4.6 to 6.8 |
75 |
<1 POC1 |
West Basin 2002 |
8 |
50.0 to 150.0 |
8 |
Ppico |
Central 2013 |
36 |
4.4 to 33.2 |
This study |
Ppico |
Central- East 1995 |
3 |
9.1 to 13.6 |
75 |
Phyto2 |
Lake-wide 2011 |
53 |
32.6 to 69.9 |
76 |
Phyto3 |
Lake-wide 2011 |
38 |
5.0 to 20.0 |
77 |
Table 4 A summary of carbon estimates for plankton in Lake Superior
1POC, Particulate Organic Carbon as determined by size fractionation and subsequent combustion of organic matter
2Range estimated from 95% confidence limit on mean values for the epilimnion and metalimnion (DCM)
3Biovolume estimates (see their Figure 3) were converted to carbon assuming a specific weight of 1g ml-1 and a carbon conversion factor of 0.2 pg C µm-3 (after) 75
We thank Daniella Daniels, Emon Butts, Christopher Frazier, Andrew Stimetz, Jade Otiz, Audrey Barnett, and Foad Yousef for the excellent technical support to the project. We thank MTU and the Great Lakes Research Center for field support and use of R/V Agassiz. Funding was provided by the College of Science and Technology at Central Michigan University to HJC and NASA grant (80NSSC17K0712) to GLF. The research was also supported in part by the NSF major research instrumentation award (MRI-1337647) to HJC. This paper is contribution number 95 of the CMU Institute for Great Lakes Research, number 1876 from NOAA-GLER number 40 from MTU’s Great Lakes Research Center.
Authors declare there is no conflict of interest in publishing the article.

©2017 Carrick, et al. This is an open access article distributed under the terms of the, which permits unrestricted use, distribution, and build upon your work non-commercially.