International Journal of
eISSN: 2576-4454


Research Article Volume 2 Issue 6
Department of soil, Water & Environment, Sana’a University, Yemen
Correspondence: Mohamed Moslih Al-Sanabani, Department of soil, Water & Environment, Sana’a University, Yemen
Received: September 02, 2018 | Published: November 19, 2018
Citation: Sanabani MMA. Runoff and infiltration rate pattern in water basins for aquifer recharge: a case study in Sanaa, Yemen. Int J Hydro. 2018;2(6):658-662. DOI: 10.15406/ijh.2018.02.00139
This work based on monitoring surface hydrology in the Western part of Sanaa Basin in the last two decades, which include storm runoff events and infiltration in water basins excavated in the Quaternary Alluvium. The long monitoring showed that the occurrence of major storm runoff events was limited to a wet year with a return period of three years. Although, water balance was the main approach used in this work, the results showed a variation in infiltration rate (m3/day). The study attempted to resolve this variation and model infiltration rate in the water basins with different cross-section shape. Furthermore, the trendline of declining infiltration rate curves for basins received frequent storm runoff had a better fit with an exponential model. However, the decline in IR is related to accumulation of sediment and decreases of hydraulic conductivity (kr) in bottom of basins. The result of estimation kr in the basin at commence of rainy season produced an average value of 4.93cm/day, but decreased by magnitude of five by the end of season. Furthermore, the highest hydraulic load (aquifer recharge) occurred in the main rainy seasons (July-August) with a value of 7.68m. Improving management and modifying basins system are essential to increase hydraulic load per season as the study concluded.
Declining of groundwater in Yemen are threating the livelihood of rural areas and presents a big challenge facing both the government and the local authority. Nearly three decades since the government has adapted a policy to mitigate this impact by inducing groundwater recharge through the construction of earth embankment and dams. Dams store storm runoff for later controlled discharge in an effort to recharge the shallow groundwater wells on which local communities depend for their livelihoods. However, there was considerable amount of investments in the construction of dams. An alternative system that would serve the same purpose with low cost is infiltration basins. The basins are widely used1 and designed with various shapes as rectangular, square or circular. Actually there is no criteria for selection best shape and depth to effective recharge. In general, the selection of the shape, size and depth of a basin is made in accordance with hydrological set of an area. Still, the development of clogging layer is the main problem associated with artificial recharge which is caused by suspended solids in the runoff water such as clay and silt particles.2 In addition to the growth of algae and other micro-organism on and in the soil to form biomass that block pores.3 In this case study we are going to analyze the results of long monitoring of storm runoff events and infiltration rate pattern in water basins during rainy seasons, and study the hydraulic factors which effect aquifer recharge in the study area.
Study location
The study site is located in a sub-basin of Sanaa which receives runoff water from upper stream of Soninah catchment in the Western Mountains of Sana’a Basin. In the past, the runoff water coming down from the mountain were diverted into the cultivated fields down slope. But three decade ago urban development expanded into this area, where the campus of Sanaa University occupied the lower part of the catchment. In the campus several water basins were excavated during the period of 1994 to 2015. The first one was excavated into depth of 3m with a capacity 3000m3 and the second one into depth of 5m with a maximum capacity of 10,000m3. The last two basins were excavated in the last five years with an average capacity of 20,000m3.
Method
The approach adopted in this work is a water balance to determine variable such as infiltration rate. The water balance for infiltration basin includes the following components: , where Qin is the inflow into the basin as runoff [m3d-1], Qout is the outflow in [m3d-1], Qf and QE is infiltration rate and evaporation rate from the basin in (m3d-1) and DS is the changes in water storage [m3d-1]. After recesses both inflow and outflow the water balance of basin is reduced to the following: ;or . DS is calculated as follow: , where DL is the change of water level in the basin during the time (t), As is average surface area of ponded water [m2]. Evaporation rate, QE[m3d-1] is calculated as follow: , where Ep is the depth of evaporated water (evaporation Pan - class A), t is time (day), As is defined below and Cp is coefficient of the pan which estimated based on FAO paper number 24 (1984). Furthermore, gauging water level in basins was carried out using scaled pipes (P.V.C).
Statistical analysis
Statistical regression are applied in this work for the following cases: The first case where infiltration data plotted in regression curve and showed linear regression, this function was described by the linear model (Qf=b t+a) where, Qf is the observed infiltration in [m3d-1], t is the independent variable and stands for time, a and b are constants. The second case where infiltration data plotted in regression curve and the suggested function was curvilinear, a logarithmic transformation was applied to linearize this function and regression function defined as the exponential model ( ) which has the same element as the linear function. The steps of the calculation are described by Miller & Freund,4 Neter & Wasserman,5 but the actual calculation is carried out in a spread sheet, Excel (Figure 1).
Season of 1995
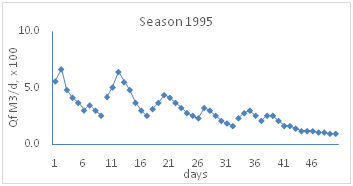
In the rainy season of 1995, med July and throughout of August five runoff events were occurred and reached the basin forming different levels of ponding. The results of Infiltration values (m3d-1) for each ponding case are showing in Figure 2. For the first ponding the highest value of Qf occurred in the first day, while in the second ponding the highest value occurred in the third day of ponding, and also for the third and fourth ponding cases the highest Qf occurred in third day. This variation of infiltration rate seamed unusual where started with a low value in the first day, increased in the second and reached a peak value in the third day of ponding. However, factors that have the potential to cause this variation such as the basin shape (cross-section) and water stored in the delivery systems were accounted for. Nevertheless, the result of recalculation indicated that about 12% to 19% was reduced from Qf1 and Qf2. This reduction was limited to the first and second ponding events. Still this percentage was too small to change this pattern of variation of infiltration rate. However, because there was no acceptable explanation for this variation, and no access to literature (internet) in the country at that time, the researcher had to wait for the coming rainy season to carry more observation and find some answers. Unfortunately, in 1996 only one major runoff occurred when a hurricane hit Yemen in the middle of June. Also, in the following year, 1997, the infiltration basin received only one runoff in the second rainy season.

Figure 2 Pattern of infiltration rate in the infiltration basin for the season 1995, each curve _connected points_ represents IR for one ponding event.
Season of 1998
Fortunately, 1998 was a wet year, two runoff events occurred in the first rainy season (March-May), and three major runoff events occurred in the second rainy season (July-August). For the second season, infiltration rate in basin that resulted from ponding are showing in Figure 3. However, the curves did not show a variation in IR as the season of 1995 except in the last ponding (runoff) event. Furthermore, the infiltration rate in the basin for 1998 was relatively high, and it’s related to the growth of wild narcissus plant in the sediment. The plant was actually intrusive and started spreading all over the area in the middle of nineties. Furthermore, the penetration depth of plant root into the sediment layer was on average of 15 to 18cm. As a result, the researcher had to wait two more years, because, the following years (1999, 2000) turn to be dry years and not much runoff water has reached the infiltration basin. Furthermore, in 1999 most of sediment in the bottom of basin was removed.

Figure 3 Pattern of infiltration rate in the basin for the season 1998, each curve _connected points_ represents IR for one ponding event.
Season of 2001 and 2005
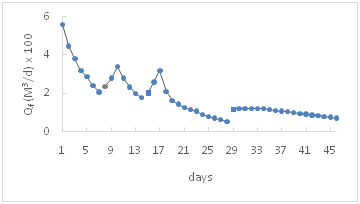
For the rainy season of 2001, two runoff events occurred in the first rainy season (March-May), after that the basin remained dry until the second rainy season (July-August) where four major runoff events flooded the basin. The curve of IR (m/d) resulted from each bonding event is depicted in Figure 4, and showed variation in IR has the following pattern (Qf1<Qf2<Qf3>Qf4>Qf5>.....>Qfn). Although, the result showed a pattern of variation similar to those of season 1995 it was necessary to replace the basin by another one with different shape and larger water storage to receive the increase in size of runoff water resulted from the change in land use and to carry more investigation. However, excavation the basin was delayed more two years and carried out in May 2005, and designed with rectangular cross-sectional shape and has a capacity of 10,000m3 of runoff water. Nevertheless, the basin received three major runoff water in the second rainy season (July-August), the result is presented in Figure 3, and showed a similar pattern to the pervious observation but with larger magnitude.

Figure 4 Pattern of infiltration rate in the basin for season 2001, each curve _connected points_ represents IR for one ponding event.
Resolving the pattern of infiltration rate
In the first ponding in the season a peak value of IR occurred in the second day, In the second and the following ponding event the peak value occurred in third day (Figure 2). Actually, IR started with a low rate and increased over the next two days to reach the peak value in third day, then start declining in the fourth day (Figure 2, Figure 4 & Figure 5) This pattern of IR has occurred in the first basin with trapezoid cross section and in the second basin with a rectangular cross section and also in third basin with parabolic cross section (personal communication). This indicates that the shape factor has limited effect on this pattern of infiltration rate as long as infiltration is calculated based on volume (L3T-1). Furthermore, it should be mentioned that this pattern of IR has occurred in infiltration basins that had been excavated in in the Quaternary Alluvium, and formed sedimentary layer in previous rainy season. Furthermore, in the following season runoff water transport more solid particles (silt, clay) which deposit in the bottom of the basin during ponding and led to partial/temporary plug of soil pores. As results it takes time for seepage forces to overcome resistance resulted from plugging and entrapped air as well. This conclusion is supported by the observation of season 1998, that did not show this variation in IR, due to the growth of wild narcosis plant in the bottom of the basin Figure 3. However, this variation was reported by Bear,6 Manglik7 both related the low values mainly to the dispersion and swelling of soil particles in the bottom of recharge basin; also indicated that rate of recharge follows almost a similar pattern of variation of infiltration with comparatively less intensity with some time lag.
The trendline of infiltration rate curves
The statistical regression is used to calculate the trend line for the infiltration rates curves in Basin1 for both season of 1995 and season 2001 as described in section (1.2). The results are shown in Figure 6 & Figure 7, and both best described by an exponential equation as ( ) and ( ) respectively.
Estimation the hydraulic Conductivity
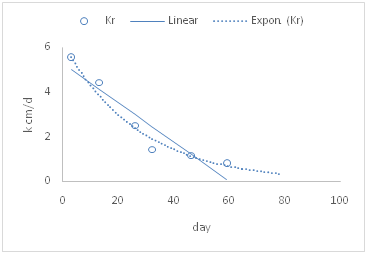
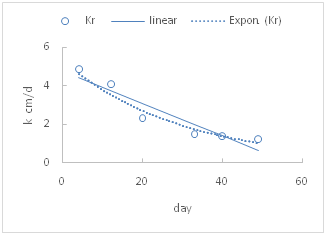
The hydraulic conductivity in the sediment layer (kr) has been estimated using the following relation: 8 where q [LT-1] is the influx, Hw [L] is the depth of water, Lr [L] is the thickness of sediment layer, hae [L-1]is the air entry value at vadoze zone below the sediment layer. The value of Lr obtained from the depth measurements at the beginning and at the end of rainy season. Also, the value of hae was obtained from tensiometer measurement below the sediment layer at the end of ponding period which was the highest value (more negative) while the lowest values (less negative) was considered to occur in first ponding when the high infiltration took place (Bouwer, et. al). However, kr (cm d-1) calculated at average of three value of influx. The obtained results of estimated Kr values in the basins for the ponding period in the seasons of 1995, 1998, 2001 and 2005 are listed in Table 1. For 1995, the kr decreased by almost magnitude of six (0.81cmd-1) during the ponding period of 59 days, and by magnitude of four during the ponding of 2001. For 1998, kr decreased only by magnitude of two due to the growth of the wild narcissus plant in the bottom of the basin. Furthermore, the trend line of kr values for 1995 and 2002 are described by both the linear and exponential model as showing in Figure 8. Although, the linear model showed high correlation (r2=0.94), but gave a poor prediction for kr out of data range, while the exponential model gave a reasonable prediction even at longer period of time (80 days) Figure 8A & Figure 8B.
Hydraulic conductivity |
|||||||
Season 1995* |
Season 1998* |
Season 2001* |
Season 2005* |
||||
cm/d |
day |
cm/d |
day |
cm/d |
day |
cm/d |
day |
5.53 |
3 |
6.3 |
4 |
4.85 |
4 |
48 |
3 |
4.41 |
13 |
5.08 |
12 |
3.98 |
12 |
30 |
7 |
2.5 |
26 |
- |
25 |
2.31 |
20 |
18 |
10 |
1.43 |
32 |
3.62 |
34 |
1.48 |
32 |
8 |
20 |
1.14 |
46 |
3.07 |
44 |
1.37 |
42 |
||
0.81 |
59 |
- |
51 |
1.2 |
49 |
|
|
Table 1 The hydraulic conductivity kr (average) in the bottom of infiltration basins (sediments) for the rainy seasons of 1995, 1998, 2001 and 2005
*Sediment layer thickness (avg.) are 35, 60, 40, and 8 cm for the season of 1995, 1998, 2001and 2005 respectively.

Figure 8A Trend of kr values for season 1995 described by exp. model (r2=0.97) and linear model (r2=0.93).

Figure 8B Trend of kr values of season 2001 described by exp. model (r2=0.98) and linear model (r2=0.94).
Total hydraulic loading
The hydraulic loading (HL) is calculated from accumulated infiltration in water the basin during the two rainy seasons in 1995, 2001 the results are shown in Table 2. The total HL (m) was estimated at 7.68 m for the rainy season of 1995, still this value is relatively low considering the number of runoff received Table 2. This is related to the following factors:
Year |
Season |
System |
Runoff events |
Hydraulic loading (total) |
Period |
Rate of H. loading |
No |
m |
day |
m/day |
|||
1995 |
first |
basin |
- |
- |
- |
- |
Second |
Basin |
6 |
7.68 |
74 |
0.1 |
|
2001 |
First |
Basin |
2 |
2.23 |
8 |
0.28 |
Second |
Basin |
4 |
5.68 |
65 |
0.09 |
Table 2 Total hydraulic loading (m) during the rainy season of 1995 and seasons of 2001
Also, the highest hydraulic loading rate (HLR), m/day, was observed in the first rainy season of 2001 with an average 0.28m/day, and it is associated with first ponding event. But in the second rainy season for the same year the HLR decreased to a value of 0.09 m d-1, because the last three ponding in the season were post-ponding events.9
This case study concluded that the variation of infiltration rate, IR (M3/d) which has the pattern of low values in the beginning and reach a peak value in the third day of ponding occurred in water basins that have been excavated in the Quaternary Alluvium and had sedimentary layer from pervious runoff. Furthermore, runoff water in the following season transport more solid particles (silt, clay) that precipitate in the bottom of the basin and led to partial and temporary plug of soil pores. As results it takes time for seepage forces to overcome the resistance brought about by plugging. Nevertheless, this pattern of IR has been reported by other research and indicated that recharge rate has a similar pattern to IR but with time lag. The decline of IR in water basins during the rainy seasons are related to decreases in hydraulic conductivity (kr) in the bottom of basin. The result of kr estimation for season 1995 has an average 5.53cm/d, but decreases by magnitude of six during ponding period of 59 days. For season 2001, Kr was 4.85cm/d and decreased by magnitude of four. The least decrease in kr (6.3cm/d) occurred in season 1998 by magnitude of two and this is related to the growth of wild narcosis plant in the bottom of the infiltration basin which limit the effect of clogging layer. Nevertheless, the highest value of kr (48cm/d) occurred in the first ponding season of 2005, due to absence of sediment. Also, the study found that the highest total hydraulic load (aquifer recharge) occurred in the main rainy seasons (July-August) with value 7.68 m. Still, such value is relatively low due to the following management factors:
The study recommends that these factors should be considered in designing infiltration basins system in area with similar hydrological set to increase IR and subsequently recharge rate. However, adapting two basins systems is essential to overcome these factors and to reduce accumulation of sediment and to minimize contamination brought about by the changes in land use.
None.
The author declares that there is no conflict of interest.

©2018 Sanabani. This is an open access article distributed under the terms of the, which permits unrestricted use, distribution, and build upon your work non-commercially.