International Journal of
eISSN: 2576-4454


Research Article Volume 1 Issue 1
1Hydrologic Sciences, University of California, Davis, USA
2Earth and Planetary Sciences, University of New Mexico, Mexico
Correspondence: Meirovitz Casey, Hydrologic Sciences, University of California, Davis, Shields Ave, Davis, California, 95616, USA
Received: May 30, 2017 | Published: July 10, 2017
Citation: Casey M, Graham FE, Gary WS, et al. Non-stationary hydrostratigraphic model of cross-cutting alluvial fans. Int J Hydro. 2017;1(1):1-10. DOI: 10.15406/ijh.2017.01.00001
The groundwater system of southern Sacramento County was formed by the glacially dominated American River fan and the non-glacial Cosumnes River fan. Recent hydrostratigraphic analysis with borehole log data and soils maps shows that the American River gravelly channels not only migrated to the south, cutting into the Cosumnes sediments in the Holocene, but also did the same during the Quaternary, leaving deep, coarse grained incised valley fill deposits embedded in what would otherwise be considered Cosumnes fan sediments. These coarse-grained incised valley fill deposits are expected to act as preferential flow paths, potentially influencing groundwater flow and transport throughout the Sacramento County groundwater system. Three dimensional Markov chain models are created for each of the two systems using transition probability geostatistics. Each system is simulated separately and then combined to produce a regional three-dimensional representation of subsurface heterogeneity that preserves cross-cutting relationships between American River coarse-grained (incised valley fill) sediments and finer-grained Cosumnes River deposits. Analysis of the resulting conceptual geologic model realizations shows that hydrofacies proportions and architecture are preserved, producing a reasonable approximation of the interaction of the American and Cosumnes River fluvial fans on a regional scale. This geologic model will be incorporated into future groundwater flow and transport models to investigate the effects on regional groundwater conditions.
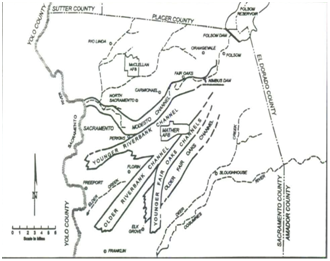
As one of the last undammed rivers in the state of California, the Cosumnes River has received considerable attention from the scientific community. Of particular concern has been declining flows in the late summer to early fall which restrict fall run Chinook salmon migration.1-3 Over a half century of groundwater overdraft has caused the surrounding aquifer to drop well below the river channel. With growing water demands in Sacramento County, it is unlikely that groundwater pumping will be reduced sufficiently to restore the water table, base flow, and fall flows.3 Previous work has shown that geologic heterogeneity significantly influences groundwater/surface water interactions.2-6 Found that the incorporation of geologic heterogeneity in modeling groundwater/surface water interactions led to local connection between the river and the depressed water table. Each suggested that such connections could be used along with surface water augmentation or artificial recharge to restore fall flows.6 Concluded that management of near channel perched systems could be used to help maintain these connections and supplement base flow, further aiding the restoration of fall flows. To implement these solutions and predict what effect they may have, a sound understanding of the geologic heterogeneity of the region is essential.7-9 In connection with others10-14 demonstrated that cyclic depositional sequences formed by glacial/inter-glacial periods could be used to characterize regional subsurface heterogeneity of alluvial fans. Characteristic of these fans are large incised-valley-fill deposits (IVF), which form as glaciers melt, repeatedly releasing copious amounts of sediment and runoff to the incised rivers of the Central Valley. While confined to the incised valleys, water velocities are high and coarse sediments are carried far into the Central Valley.8,13 With time the incised valleys are filled and surface water spreads over the fan, significantly reducing velocities and allowing only fine sediments to reach the more distal parts of the fan. The coarse-grained IVF deposits (upwards of 30 meters thick), surrounded by mainly fine sediments, act as preferential flow paths, significantly influencing regional groundwater flow and transport8-15 and others16 identified paleochannels that appear to be similar to IVF deposits in the shallow subsurface to the north of, and likely crossing the Cosumnes river (Figure 1). Although it is likely these incised valley fill deposits influence the nature of flow and transport in Sacramento County, to date we are unaware of any model that has adequately incorporated them. Prior to this study only limited local geologic data have been available for modeling. As a result, regional scale heterogeneity throughout Sacramento County has been largely ignored. The purpose of this study is to incorporate abundant local and regional data into a more realistic representation of subsurface geology allowing for improved flow and transport modeling of groundwater in Sacramento County and the Cosumnes River region. To do this I:
Study Area
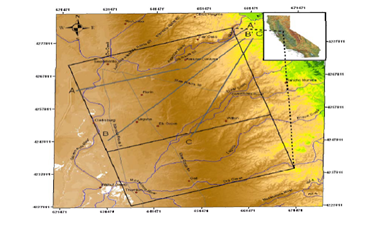
The study area covers a 1262 km2 section of Sacramento County (Figure 2) within which the Cosumnes and American River fluvial fans enter the Central Valley. The American River (which forms the northern boundary of the study area) drains a 4290 km2 catchment stretching east from Folsom Reservoir to the crest of the Sierra Nevada.17 The elevation of this basin ranges from 3170 m (10400 ft.) near the crest to 67 m (220 ft.) at Folsom Reservoir. Similar to the Kings River10,18, Tuolemne River9,13 and Merced River13,14 fluvial fans, deposition of the American River fan has been significantly influenced by cyclic Plio-Pleistocene climate change and resulting glaciation in the Sierra Nevada.9-21 Immediately south of the American River watershed, the Cosumnes River drains a much smaller (1900 km2) basin ranging in elevation from 2400 m (7875 ft) at the headwaters to near sea-level at its confluence with the Sacramento/San Joaquin Delta.2 The river leaves the Mesozoic bedrock of the Sierra foothills near Michigan Bar, entering the fluvial fan dominated Central Valley. From here the river flows 58 km (36 mi) to its confluence with the Mokulemne River. The Cosumnes River, similar to the Chowchilla River fan,9,22 experienced relatively little, if any, glacial input. Therefore, it produced a smaller fan containing less coarse-grained sediment as compared to the American River fan.
Since the early Pliocene epoch (~5.3 mya), the geology of Sacramento County has been dominated by the deposition of American River fluvial sediments. Early deposits consist of eroded volcanic sediments, forming the black sands and andesitic gravels characteristic of the Mehrten Formation. Later, non-volcanic sediments were deposited as the Laguna, Fair Oaks and Riverbank formations, dating from the end of the Pliocene into the Pleistocene (~100,000 bp).15,16 These formations were deposited by the American River and other streams that had become quite sizeable with the introduction of glaciation in the High Sierra. During Plio-Pleistocene glaciation the American River channel belt was upwards of 8,000 feet wide and carried up to boulder-sized sediments, depositing them in channels, incised valleys and, near the apex of the fan, as broad sheets.15 Repeatedly jumping its banks and changing course, the American River left numerous coarse-grained paleochannels “which are of vast importance as conveyance channels and sources of groundwater”.15 Attempts to trace these paleochannels in near-surface sediments have shown that a southern fork of the American River flowed to the southwest toward the Cosumnes River, likely crossing the current flow path of the Cosumnes River.15,16.This would suggest that the American River fluvial fan is intertwined with the much finer grained Cosumnes fan and that American River channel deposits may influence groundwater/surface water interactions along the Cosumnes River.
Hydrofacies characterization
Well logs and the most recent Sacramento County soil survey23 were the primary sources of lithologic data for this study. Of the more than 23,000 well logs provided, 1320 of the highest quality logs were chosen based on selection criteria used by the USGS in their characterization of the Modesto Fan.12 These criteria require a well log to contain at least one depth interval with a textural modifier (e.g., sandy clay, silty sand, gravelly sand, etc.), at least one depth interval with a color description (e.g. black sand) and sufficient location data for the log to be placed on the county map.12 Sediments were grouped into four hydrofacies (gravel, sand, sandy-mud and mud) based on the lithologic descriptions provided (Table 1). Additional cores taken along the Cosumnes River provided insight into the character of sediments (grain-size, color, distribution, constraints on sand and gravel mean lengths) present and possible depositional trends. Lithologic data was analyzed in plan view and as cross-sections to identify possible depositional trends. Following methods used by7 on the Kings River alluvial fan, C-horizon soil descriptions from the Sacramento County Soil Survey23 were used to create a training image of depositional trends within the study area. The soil survey provides a description of each soil series to roughly 1.5 meters (60 inches) depth along with any local variations. Each soil series was grouped into one of the four hydrofacies (gravel, sand, sandy-mud, mud) based on C-horizon soil descriptions and plotted in ArcGIS (Figure 3). The C-soil horizon is generally considered “parent material” and therefore more representatives of original sediment textures. Also, by using the C-horizon, soils that had been reworked by anthropogenic processes (like tilling for agriculture) were avoided.
Hydro-Facies |
Hydro-Facies |
Hydro-Facies |
Gravel |
Channel deposits |
Boulders-gravel and very coarse sand |
Sand |
Near-channel |
Sand (fine to coarse) |
Sandy-mud |
Proximal floodplain/levee |
Silty/clayey sands, sandy clays and silts |
Mud |
Floodplain |
Clay, silty clay, shale, paleosol |
Table 1 Attributes of the four hydrofacies used in geologic characterization.
Hydraulic conductivity of sediments
Estimates of hydraulic conductivity for each of the four hydrofacies were gathered for use in later flow and transport modeling. It is assumed that each hydrofacies has a unique, effective hydraulic conductivity. This results in a representative characterization of heterogeneity as long as the variation in K between hydrofacies exceeds sufficiently the variation in K within hydrofacies, which is certainly true for the extremes of the system–the high-K sands and gravels and the low-K muddy sediments–but it may not hold as well for the intermediate hydrofacies of muddy sand. A review of relevant literature provided a range of possible K values of similar textural facies for other study areas in the Central Valley (Table 2). Of the available K estimates and assumptions, the USGS Modesto Fan values12 were based on the most data. As part of that study, initial values for each facies were calculated from well logs, slug tests and pumping tests for the Modesto area and later adjusted during extensive model calibration. Values used by2,5 were based on data from only three wells in the immediate vicinity of the Cosumnes River and seem low, especially for the gravel hydrofacies. Additional values for the gravel hydrofacies in the American/Cosumnes Rivers combined area were calculated using specific capacity and perforation data provided in well logs. 18 of 63 available driller’s logs containing specific capacity and perforation data were selected based on:
Hydraulic Conductivity [m/d] |
||||||||||||
|---|---|---|---|---|---|---|---|---|---|---|---|---|
Modesto Fan USGS Report |
Kings |
Cosumnes Fan Fleckenstein2 |
Cosumnes |
Cosumnes/ American R.Well Logs |
Hypothetical Fetter, 2001 |
|||||||
Vert |
Hor |
Vert |
Hor |
Vert |
Hor |
Vert |
Hor |
Vert |
Hor |
Vert |
Hor |
|
Gravel |
800 |
727 |
864 |
864 |
86.4 |
86.4 |
14.4288 |
14.4288 |
86.4 to 8640 |
|||
Sand |
98 |
45 |
86.4 |
86.4 |
43.2 |
43.2 |
5.4 |
5.4 |
0.864 to 86.4 |
|||
Sandy-mud |
2.2 |
1.1 |
0.864 |
0.864 |
4.32 |
4.32 |
0.8956 |
0.8956 |
86.4E-5 to 8.64E-3 |
|||
Mud |
0.001 |
0.0031 |
0.086 |
0.086 |
0.129 |
0.13 |
0.023414 |
0.023414 |
8.64E-8 to 86.4E-5 |
|||
Table 2 Estimated facies hydraulic conductivity (K) values for the Modesto, Kings River, Cosumnes/American Rivers Fans along with literature values reported by Fetter (2001).
Hydraulic conductivity was estimated using the method of Logan as described in Kruseman and De Ridder. Transmissivity is related to hydraulic conductivity and specific capacity by the following equation:
Where T [L3/T] is the aquifer transmissivity, K [L/T] is the hydraulic conductivity, D [L] is aquifer thickness, Q [L3/T] is the steady state pumping rate, and s is the well drawdown. For this calculation, it is assumed that the well screen length represents the aquifer thickness, and wells have been pumped long enough for the drawdown rate to stabilize. It is further assumed for this study that wells are primarily completed in the channel hydrofacies and calculated values represent horizontal hydraulic conductivity.
Transition probability geostatistical modeling
Incorporation of subsurface heterogeneity into flow and transport modeling has been shown to produce representative simulations of hydrogeologic heterogeneity.2-25 Creating representative, geologically based models of subsurface heterogeneity nevertheless remains challenging. Boring and geophysical logs provide, in some cases, ample vertical information about facies locations and transitions, but borings are rarely close enough together to provide sufficient lateral correlation. T- ProGS (Transition Probability Geostatistical Software), a modular geostatistical program introduced by,26 uses transition probabilities and Markov chains to simulate the spatial distribution of categorical variables. T-ProGS was developed “to encourage infusion of subjective interpretation by simplifying the relationship between observable attributes and model parameters”27. The use of transition probabilities (as opposed to more traditional geostatistical approaches like indicator cross-variograms) allows the user to incorporate observed depositional trends (i.e. fining upwards sequences, symmetry/asymmetry) from the natural system into the simulation. Compared to traditional geostatistical simulations (i.e. indicator cross-variograms), the final result is a more geologically realistic representation of the modeled environment that also conserves the laws of probability.2-29 Moreover, the dominant, hydrogeologic influence of heterogeneity is that it controls connectivity of aquifer and aquitard materials which is in turn predominantly controlled by proportions and lateral and vertical extent (lengths) of these materials.29 T-ProGS not only uses proportions and lengths directly in the simulation but also facilitates the adjustment of these quantities in light of geologic information. The T-ProGS simulation module TSIM uses Markov chains and available conditioning data to create a 3-D conditional simulation of subsurface heterogeneity. The data on which these realizations are based are typically not “hard”, in the sense that the estimated facies at a particular location commonly range from a good estimate to a rough estimate. Accordingly, it is appropriate to treat much of the data as “soft”30 to reflect this uncertainty. TSIM_S, an improved version of TSIM, was selected for this study based on its ability to incorporate soft conditioning data into the “sequential indicator simulation” (SIS) and simulated annealing steps.25,31 In TSIM_S this is handled by adding a “hardness” value between 0 and 1 to each line of conditioning data based on the user’s confidence in the data provided. A “hardness” value of 1 indicates “hard data” while a value of 0 suggests that the data should be ignored. If the value is ignored, the likelihood of a given facies appearing at that node is equal to the volumetric proportion of that facies.
Model boundaries (Figure 2) were selected to encapsulate the area of interest while simplifying boundary condition assignments in later flow and transport modeling. The eastern model boundary was placed in the Sierra foothills, while the north, south and west boundaries were placed along the American River, Dry Creek, and Sacramento River respectively. To account for differences between the two fluvial fans, the model area was divided into two sub-domains with the American River model to the north and the Cosumnes River model covering the entire model domain (Figure 2). Coarse-grained American River sediments found primarily in the northern sub-domain were inserted into the Cosumnes River model to create a single combined realization. The final combined model covers an area that is 36.2 km by 45.4 km and consists of approximately 17.6 million nodes.
Geologic characterization
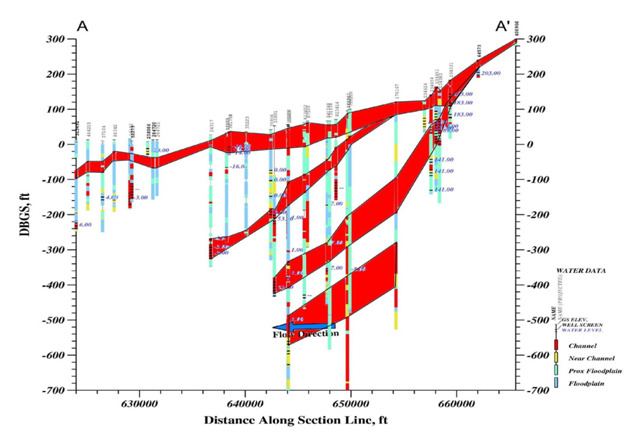
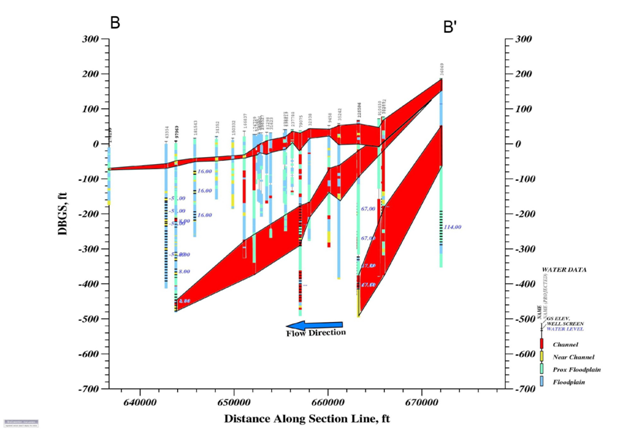
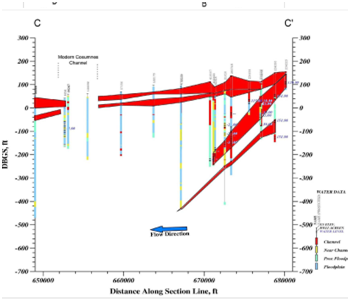
Inspection of the hydrofacies soils map (Figure 3) provides some initial information concerning depositional trends in the study area. The modern Cosumnes River flows to the southwest surrounded by fine grained sandy-mud and mud deposits and a few local sands. To the south of the Cosumnes River small dendritic gravel and sandy-mud deposits trend primarily east to west toward the confluence of the Cosumnes River and Dry Creek with a more southwesterly trend near the confluence. The American River to the north is surrounded by large, coarse-grained sand and gravel deposits which appear to fine laterally and basin-ward. In addition to the modern channel, three coarse-grained branches, upwards of 2000 meters wide, reach well into the valley and fan to the southwest. The location of these three branches (northernmost branch just south of the modern American R. fines more rapidly) corresponds with the Younger Riverbank, Older Riverbank and Fair Oaks “paleochannels” observed by.15 The locations of these paleochannels indicate that during the Holocene epoch the American River fanned from a southwest course toward the modern Cosumnes River to its modern westward trend. Following,10 a number of unsuccessful attempts were made to divide the subsurface into relatively conformable units by correlating what were believed to be laterally extensive paleosols throughout the model area. In these attempts it was observed that drillers’ logs from just east of the Florin area had no paleosols and a much higher concentration of sand and gravel than logs from other parts of the study areapon inspection of the hydrofacies soils map created for this study (Figure 3) and 15 map of Pleistocene American River “paleochannels” (Figure 1) it was noted that his Older Riverbank and Younger Fair Oaks channels diverge in this area. It was also noted that the gravel units recorded in the drillers’ logs are much thicker than those generally observed on the soils map or in drillers’ logs to the south near the Cosumnes River. Following this observation three cross-sections were created following the strike of Shlemon’s channels: A-A’, B-B’, and C-C’ (Figures 2-6). Earlier attempts to identify laterally extensive units in east to west oriented cross sections were unsuccessful. By rotating to a northeast-southwest orientation with the easternmost wells near Folsom Reservoir (Figures 4-6), Shlemon’s channels were immediately visible in the upper 30 meters followed by what appear to be earlier channel deposits at depth (< 200 m bls). Based on the orientation, thickness (upwards of 25 m) and grain sizes found within (sand to boulders) these gravelly units, they appear to have been deposited by a southwest flowing American River and suggest that the sequence of American River coarse-grained “paleochannels” identified by15 in the shallow subsurface (upper 30 m) also occur at depth (upwards of 200 m bsl following basin subsidence), slicing into Quaternary and older sediments. Unfortunately mineralogical samples of these deeper sediments are not currently available to more thoroughly evaluate their origin.
The occurrence of these Plio-Pleistocene coarse-grained deposits and their deposition by the historically glacially influenced American River is consistent with the efforts of others to characterize similar fluvial fans in the San Joaquin Valley to the south.7-14 These earlier studies suggest that these “paleochannels” as described by Shlemon may be incised valley fill (IVF) deposits. If these are in fact IVF deposits, the process of their formation would be as follows. At the end of a glacial period (during glacial recession) vast quantities of sediment and water were flushed from the mountains into the Sacramento Valley. Initially, sediment would pile up near the apex of the fan, steepening gradients and creating greater accommodation space across the fan surface. As sediment load decreased (with glaciers fully receded fine-grained glacial material dwindles) the steep gradients needed to carry earlier glacial outwash were reduced by erosion. In this way an incised valley would form, beginning at the apex of the fan and continuing down gradient. Significant fluctuations in global sea-level may have also influenced the formation of incised valleys within the study area.8 During the Pleistocene, the Sacramento River (for which the American River is a tributary) incised a bedrock canyon which increased in depth from 36 meters (120 feet) below sea level at the Carquinez Strait to 115 meters (380 feet) below sea level at the Golden Gate.15 Such drastic incision of the Sacramento River would likely aid in the development of deep American River incised valleys. Whether formed by fluctuations in sediment supply or sea-level (likely both), subsequent glacial/interglacial cyclicity would fill the incised-valleys and form deep IVF deposits. In summary, the hydrostratigraphy of the study area consists of the interaction of two overlapping fans, the coarse-grained glacially dominated American River fluvial fan to the north and the relatively fine-grained Cosumnes River fluvial fan to the south with the modern Cosumnes River forming a natural divide between the two. Sediments deposited to the south of the Cosumnes River trend east to west, bending southward to the confluence of the Cosumnes River and Dry Creek in the west. American River IVF deposits appear to dominate the northern portion of the study area reaching as far west as Elk Grove (possibly further, although a lower density of deep well logs and basin-ward fining limit our ability to identify them) and fan from a southwest trend near the Cosumnes River to nearly due west at the modern American River. Based on the soils map, cross sections and observations made by,15 it appears that these are IVF deposits and likely cross underneath the modern Cosumnes River. Where this is the case, increased groundwater/surface water interaction would be expected, as was observed in the lower reach of the Cosumnes River by.2
Hydraulic conductivities
K values were calculated for each well. Where wells were completed in multiple aquifers the sum of all screens was used in the calculation. Since water well logs were the primary source of data for this study, specific capacity data were not available for the other hydrofacies (Table 2). Compares estimates of hydrofacies K for alluvial fan systems in the San Joaquin Valley. It should be noted that K values calculated for this study assume that water supply wells are completed only in the gravel hydrofacies. By including well sections completed in less coarse-grained units (medium-grained sand or finer), the K value of implicitly very coarse-sand to boulder deposits would be underestimated. Considering the simplified and up-scaled record of sediments provided in well logs, and the likelihood of a distribution of grain-sizes (not just gravel to boulder grain-sizes) found within units recorded as “gravel”, it is unlikely that this assumption would add significant error to future modeling results. Additionally, 16 of the 18 wells used to calculate K are located north of the Cosumnes River where the majority of deep well completions are located in deposits closely matching the gravel hydrofacies.
Model of heterogeneity
Although the American and Cosumnes Rivers fluvial fans include a similar variety of sediment textures, mean lengths, transition rates and volumetric proportions (Table 2 &Table 4) for each are quite different. To model heterogeneity and crosscutting relationships created by these two overlapping fans it was necessary to model each separately before combining them into a single realization (Figure 2 & Figure 7). From a hydrogeologic perspective, the coarse-grained gravel deposits of the American River would have the greatest impact on subsurface flow and transport. With this in mind, the area north of the Cosumnes River was modeled separately and later combined with the larger Cosumnes River model. American River IVF deposits (gravel hydrofacies) from a single American River realization were inserted into a Cosumnes River realization to create a single combined realization in which both systems were represented. Geologic interpretation of the available lithologic data suggests that American River coarse-grained sediments cross the location of the modern Cosumnes River but are largely confined to the northern half of the model area. Based on this interpretation, the southernmost boundary of the American River model (and therefore American River IVF deposits) was placed just south of the modern Cosumnes River (Figure 2). Basin-ward fining, decreased well density and reduced gravel hydrofacies thicknesses south of the dividing line made it so no clear distinction could be made between American and Cosumnes River coarse-grained sediments beyond that point. To avoid a sharp contrast in hydraulic conductivities along the dividing line, the location of American River IVF deposits from the southern boundary of an American River realization were included as conditioning data for the respective Cosumnes River realization. In this way modeled gravel bodies were allowed to pass slightly beyond the boundary between the two realizations, reducing the influence of the modeled divide on future groundwater flow and transport modeling. Trends in depositional azimuths for the two fluvial fans differ significantly. Depositional azimuths fan from nearly due west near the modern American River to southwest just north of the Cosumnes River. Sediments to the south of the Cosumnes River generally trend east to west with a southwesterly component near the western boundary of the model area. Dip and azimuth files were created for each sub-domain, matching the trends in depositional azimuth noted above, using a linear kriging function. Gravel deposits and paleosols correlated in cross section (Figures 4-6) were used to calculate averaged dips for model nodes. A near-surface dip of approximately 2 degrees (0.003 m/m) exists throughout much of the model area, increasing sharply to 5 degrees in the foothills along the eastern model boundary. These dips appear to increase with depth approximately 0.0067 degrees per meter below land surface. Stratigraphic dips were assigned to each node perpendicular to channel azimuths. Grid cell sizes (Table 3) were selected based on Cosumnes River facies mean lengths (smaller than the American River facies) allowing for sufficient detail to represent vertical and lateral spatial variability. The model depth extent was selected to include sediments most affected by pumping and stream interaction while staying within computational limitations.
Model Parameters |
|||||||||
|---|---|---|---|---|---|---|---|---|---|
Cell Size |
Grid Dimensions |
Origin (UTM Zone 10N) |
|||||||
X (m) |
Y (m) |
Z (m) |
X (m) |
Y (m) |
Z (m) |
X (m) |
Y (m) |
Z (m) |
|
Cosumnes R. System |
200 |
200 |
0.5 |
181 |
227 |
430 |
636630.976 |
4228115.691 |
-125 |
American R System |
200 |
200 |
0.5 |
181 |
139 |
430 |
636630.976 |
4245715.691 |
-125 |
Table 3 Outline of model parameters and location of origin for each model.
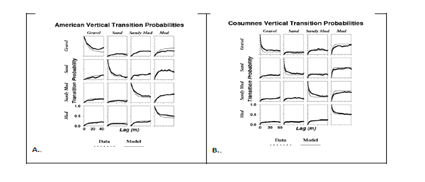
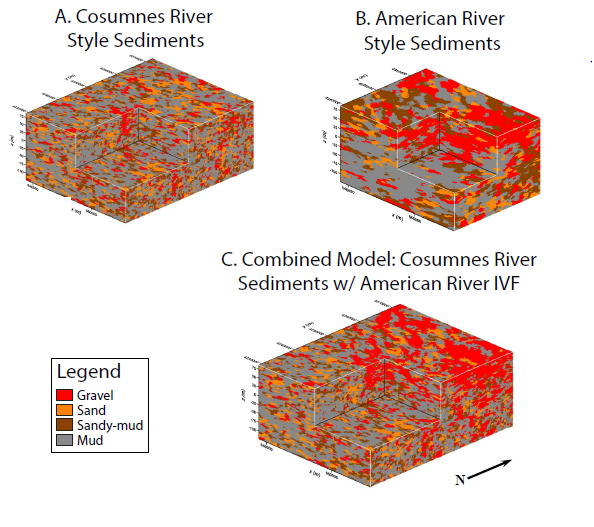
Lithologic logs provided ample data to evaluate transition rates and depositional trends in the vertical direction. Available data were divided between the two sub-domains with only wells found south of the Cosumnes River used for the Cosumnes model. Volumetric proportions and transition probabilities were evaluated separately for each model domain (for discussion of transition probabilities see.26 Transiograms were plotted and Markov chain models created to fit the vertical data (Figure 7). Volumetric proportions (Table 4) and these transiograms reflect that this is a mud dominated system with a greater volume of the gravel hydrofacies occurring in the north. A tendency toward fining upward sequences, common in alluvial systems, was not observed in the spatial variability analysis. This is consistent with the lack of fining upward sequences observed in well logs from the study area. While it is possible that insufficient attention to detail in the creation of well logs may limit the recognition of fining upward sequences, the decision was made to honor the data instead of inserting such trends. Due to large data spacing and uncertainty in depositional dip and strike [31], lateral spatial variability is typically much more difficult to interpret than vertical spatial variability. To resolve this issue, facies mean lengths for the lateral directions were estimated using calculated vertical transition probabilities, the hydrofacies soils map (Figure 3), cross-sections (Figures 4-6), field observations, and past work performed in the study area.2-15 Lateral hydrofacies mean lengths were assigned, while off diagonal transition rates for each sub-domain were estimated by assuming lateral symmetry and adopting the transition rates from the vertical data (Table 5). Since the off-diagonal transition rates represent juxtapositional tendency, this procedure is tantamount to assuming that Walther’s Law holds approximately. Walther’s Law states that “The various deposits of the same facies-area and similarly the sum of the rocks of different facies-areas are formed beside each other in space, though in a cross section we see them lying on top of each other…”.31 Assuming lateral symmetry means that the probability of transitioning laterally (along strike) from one material to another is independent of direction. While it can be debated that the presence of paleosols in the study area, marking periods of non-deposition along portions of the surface of the fluvial fan, weakens the case for using Walther’s law (requires system to be relatively conformable), well log data and cross sections from both this study and the literature15,16 suggest that paleosols throughout the area are not laterally extensive and do not appear to represent regional unconformities or the loss of significant periods of time in the geologic record. Based on this observation, the regional focus of this study, and the limited influence of off-diagonal transition probabilities on the overall model, the above approach was deemed reasonable and sufficient. Hardness values used in this study (Table 4) were based on subjective judgment concerning well log accuracy. It is reasonable to expect that the drillers most accurately estimate locations of the water-bearing sands and gravels, since their objective is to construct water wells screened in those facies. Ideally, one would have side-by-side core and drillers logs with which to statistically analyze the probability that the driller’s log picks are accurate, but no such data are available for this study area7 was able to compare some core and drillers logs directly in the Kings River fan system, and found that the drillers logs agreed with the core descriptions with probability of about 0.5. Accordingly, hardness values for the gravel and sand hydrofacies were set at 0.8 and 0.7, respectively, while a value of 0.5 was used for the fine-grained hydrofacies (sandy-mud and mud). Systematic sensitivity analysis of the model to these hardness values was not performed. Visual inspection of the individual and combined model realizations reveals some of the strengths and weaknesses of the modeling efforts. Figures 8A though 8C show
Hydro-facies |
Geologic Interpretation |
Texture |
American Volumetric Proportions |
Cosumnes Volumetric Proportions |
Hardness Value |
Gravel |
Channel deposits |
Boulders-gravel and coarse sand |
0.21 |
0.13 |
0.8 |
Sand |
Near-channel |
Sand (fine to coarse) |
0.13 |
0.16 |
0.7 |
Sandy-mud |
Proximal floodplain/levee |
Silty/clayey sands, sandy clays and silts |
0.26 |
0.22 |
0.5 |
Mud |
Floodplain |
Clay, silty clay, shale, paleosol |
0.4 |
0.49 |
0.5 |
Table 4 Attributes of the four hydrofacies used in TProGS simulations including the hardness values for each facies used in the simulation step.
Vertical (z) Direction |
Strike (y) Direction |
Dip (x) Direction |
||||||||||
Cosumnes River Model |
||||||||||||
G |
Sd |
sm |
m |
g |
Sd |
sm |
m |
G |
sd |
sm |
M |
|
G |
L = 3.852 |
0.129 |
0.305 |
b |
L = 450 |
S |
s |
b |
L = 1300 |
s |
s |
B |
Sd |
0.046 |
L = 2.814 |
0.278 |
b |
0.079 |
L = 450 |
s |
b |
0.079 |
L = 1100 |
s |
B |
sm |
0.139 |
0.077 |
L = 4.553 |
b |
0.184 |
0.298 |
L = 350 |
b |
0.184 |
0.298 |
L = 800 |
B |
M |
B |
B |
b |
b |
b |
B |
b |
b |
B |
b |
b |
B |
American River Model |
||||||||||||
G |
Sd |
sm |
m |
g |
Sd |
sm |
m |
G |
sd |
sm |
M |
|
G |
L = 3.852 |
0.129 |
0.305 |
b |
L = 1000 |
S |
s |
b |
L = 7000 |
s |
s |
B |
Sd |
0.046 |
L = 2.814 |
0.278 |
b |
0.143 |
L = 750 |
s |
b |
0.143 |
L = 4150 |
s |
B |
sm |
0.139 |
0.077 |
L = 4.553 |
b |
0.36 |
0.21 |
L = 900 |
b |
0.36 |
0.21 |
L = 6250 |
B |
M |
B |
B |
b |
b |
b |
B |
b |
b |
B |
b |
b |
B |
Note: g: Gravel Facies; sd: Sand Facies; sm: Sandy Mud Facies; m: Mud Facies; s: Symmetry; b: Background Category. |
||||||||||||
Table 5 Embedded transition probability matrices and hydrofacies mean lengths in feet (diagonal entries) used to create 3-D Markov chains for each system.2
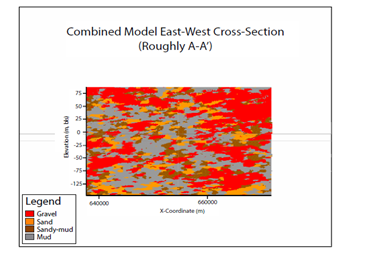
Comparison of apparent depositional azimuths in the Cosumnes model realization (best seen on top surface) to the hydrofacies soils map (Figure 3) indicates that these azimuths have been successfully approximated in the modeling efforts. The “fanning” southward trend in the American River model realization is less clear, although inspection of the full suite of realizations does show the channel hydrofacies deposits rotating southward approaching the southern boundary of the American River model. A cross-sectional slice through the combined model (Figure 9) corresponding with the approximate location of cross-section A-A’ (Figure 4) shows dips increasing with depth as interpreted. In both cross-sectional (Figure 9) and plan views (Figures 8A-8C), the American River gravel hydrofacies appears to be only moderately continuous. This is an artifact of the 2D images of the 3D channels.29-32 One concern in combining the two sub-domain models as described above was the possibility of artificially inflating the volumetric proportion of gravel within the combined model realizations. To investigate this possibility, volumetric proportions of each hydrofacies in the combined realizations were computed and compared to volumetric proportions calculated using all of the well logs available for the area (Table 6). Note that prior volumetric proportions were calculated specifically for each sub-domain using only the appropriate well logs (wells north of the Cosumnes River for the American River sub-domain, and only wells south of the Cosumnes River for the Cosumnes sub-domain). For all but the sandy-mud hydrofacies, modeled and observed results vary by less than 5%. Considering the high level of uncertainty associated with well logs, and especially correct identification of the sandy-mud hydrofacies, these differences in volumetric proportions are within an acceptable range. Overall, the combined model realizations do appear to be a reasonable approximation of geologic heterogeneity found within the study area.
Comparison of Volumetric Proportions |
||||
|---|---|---|---|---|
Gravel |
Sand |
Sandy Mud |
Mud |
|
Combined Model |
0.23 |
0.14 |
0.18 |
0.45 |
Total Study Area |
0.2 |
0.12 |
0.27 |
0.41 |
Table 6 Comparison of volumetric proportions. Suggests 5% more coarse-grained materials in the combined models.
The conceptual geologic model created for this study is intended for use in addressing groundwater/surface water interactions along the Cosumnes River and groundwater issues in south Sacramento County. Nevertheless, coarse-grained American River deposits observed in the northern portion of the study area are expected to have the greatest influence on groundwater flow and transport due to their high hydraulic conductivity (Table 2) and regional extent. With this in mind, the decision was made to combine model realizations from the two sub-areas by extracting the gravel hydrofacies from the American River model and inserting it into a corresponding Cosumnes River realization. This method assumes that
Coarse-grained American River deposits in the north, hypothesized to be incised valley fill (IVF), sit unconformably on older sediments of varying grain-size and depositional dip and azimuth. By inserting the gravel hydrofacies from the American River sub-domain into the Cosumnes model, this unconformable surface is created in the resulting combined realizations of the geologic model. In this way the non-stationary interaction of the two fans is represented. The absence of the American River sand hydrofacies in the combined model may reduce connectivity of the sand hydrofacies in the northern sub-domain. The more than order of magnitude difference in hydraulic conductivities between the gravel hydrofacies and the other three hydrofacies (Table 2) should overshadow this change in future flow and transport modeling. The influence of any differences in K of American River and Cosumnes River fine-grained sediments should be similarly overshadowed. Sensitivity analysis would help illuminate this further. Identification of a boundary between the two sub-basins, denoting the southernmost extent of American River IVF deposits, was problematic. To map the full lateral extent of American River channels would require much more subsurface characterization and lithologic data than is currently available. Without these data, the boundary was placed where differentiation between American and Cosumnes Rivers coarse-grained sediments was no longer possible while still allowing the IVF deposits to pass below the modern Cosumnes River channel. IVF deposits were allowed to pass below the modern Cosumnes River channel to facilitate the investigation of these IVF deposits as drivers for localized groundwater/surface water interactions along the Cosumnes River, as hypothesized by.2 The contrast in hydraulic conductivities along this boundary may influence flow by creating a somewhat artificial transition, but the overall influence on regional flow will likely be minimal. Where groundwater/surface water interactions along the Cosumnes River are considered, attention should be given to how this boundary affects local flow. Also of concern was the lack of control over where coarse-grained deposits enter the model. The American and Cosumnes Rivers have likely entered the Central Valley at consistent locations for millions of years, primarily influenced by the geomorphology of the foothills. The location of modeled channel deposits could not be constrained to these locations. Major American River IVF deposits appear to have been accurately placed as a result of conditioning data, but unrealistic channel deposits along the eastern edge of the model do exist. In regional flow and transport modeling it may be advisable to modify this part of the geostatistical model to restrict the American River channels only to plausible locations.
For this study, the location of IVF deposits were modeled implicitly with borehole conditioning data, providing some constraint on the distribution of the gravel hydrofacies without “hardwiring” the location of any IVF deposits. In contrast,2,13 used an explicit approach in which the locations of IVF deposits were determined and the distribution of sand and gravel within the deposits were modeled. The decision to allow for variation in the location of IVF deposits was largely based on the desire for maximum variation between realizations. In this way the results of Monte Carlo groundwater flow and transport modeling would apply to a more broad geologic interpretation of the system. One drawback of this approach is a lack of control over IVF locations along the boundaries. Also, with greater subdivision of the modeled IVF deposits as compared to an explicit model, one would expect the influence of these channels to be less pronounced than those observed by.2,13 Therefore, future groundwater flow and transport models created using this geologic model might underestimate the impact of these IVF deposits. Future work could include the development of a conceptual geologic model for the study area in which the paleochannels discovered by15 were explicitly included. An additional limitation of the geologic model is that paleosols were not included as a separate geologic unit. Where fluvial sediments have been long exposed on land surface (e.g. during an interglacial period) and later buried, oxidized red paleosols have formed. These paleosols can be quite dense and significantly impact stream flow and infiltration by forming perched aquifer systems.4 The location of these paleosols could not be sufficiently identified using available data and were therefore included in the mud hydrofacies. On the Kings River alluvial fan the regional movement of contaminants between aquifer units is largely controlled by the occurrence of paleosols.8 Throughout much of the Kings River fan laterally extensive paleosols form confining layers between water-bearing units. In a few places IVF deposits cross-cut these paleosols forming “windows” for contaminants to move between aquifers .Large scale GPR (ground-penetration radar) or EM (electro-magnetic) surveys could be used to investigate the presence of regional paleosols within the study area and evaluate their influence.14 It is hypothesized that American River coarse-grained IVF deposits act as large scale preferential flow paths connecting groundwater in north Sacramento County to the Cosumnes River and surrounding aquifer. This would suggest that pumping from American River gravels to the north could have a greater influence on groundwater conditions beneath the Cosumnes than if the American River IVF deposits had not cut across the Cosumnes fan. Also, existence of this hydrostragraphic architecture creates greater potential for migration of groundwater contaminants from the Sacramento area into the Cosumnes groundwater system. Based on these conclusions, future flow and transport modeling will need to incorporate these preferential flow paths to better represent hydrogeologic conditions.
Recent hydrostratigraphic analysis using borehole log data shows that the groundwater system of south Sacramento County is comprised of two overlapping depositional systems, the glacially dominated American River fan and the non-glacial Cosumnes River fan. Cyclic glaciation in the American River drainage basin produced large incised-valley fill (IVF) deposits which reach far into the Central Valley. These incised valleys were filled with coarse-grained glacially derived sediment and extend west to southwest from the apex of the American River fan, cross-cutting the much smaller Cosumnes River fan to the south. First identified in the shallow subsurface (30m),15 well logs and cross-sections show that these coarse, incised-valley fill deposits repeat with depth into Holocene and late Tertiary formations. These IVF deposits can be expected to act as considerable preferential flow paths controlling groundwater flow and transport throughout the county. Based on these conclusions, any efforts to restore flows in the Cosumnes River will need to account for groundwater pumping in the north as well as the south. Additionally, contaminants introduced in the north could potentially find their way into these flow paths and migrate to the south, depending on regional patterns of groundwater pumping and natural discharge. Therefore, future flow and transport modeling of Sacramento County will need to account for the effect of these American River IVF deposits. A geostatistical representation of subsurface heterogeneity which incorporates these IVF deposits was produced. Cross-cutting relationships were preserved by overlaying modeled American River gravels into a separate model based on Cosumnes River fan depositional patterns. Analysis of the resulting model suggests that the modeled realizations do represent a reasonable approximation of the interaction of the American and Cosumnes River fluvial fans on a regional scale. Future work will incorporate this model into a full regional scale model of groundwater conditions for much of Sacramento County.

©2017 Casey, et al. This is an open access article distributed under the terms of the, which permits unrestricted use, distribution, and build upon your work non-commercially.