International Journal of
eISSN: 2576-4454


Research Article Volume 9 Issue 1
1Department of Atmospheric Sciences, Institute of Astronomy, Geophysics and Atmospheric Sciences, University of São Paulo, São Paulo, Brazil
2School of Arts, Sciences and Humanities, University of São Paulo, São Paulo, Brazil
3Federal University of Espirito Santo, Vitoria, ES, Brazil
Correspondence: Amauri Pereira de Oliveira, Department of Atmospheric Sciences, Institute of Astronomy, Geophysics and Atmospheric Sciences, University of São Paulo, São Paulo, Brazil
Received: January 25, 2025 | Published: February 13, 2025
Citation: Sánchez MP, Oliveira AP, Tito JV, et al. Low-level jet modeling investigation in the metropolitan region of São Paulo, Brazil. Int J Hydro. 2025;9(1):1-9. DOI: 10.15406/ijh.2025.09.00397
Main properties of the Low-Level Jet (LLJ) in the metropolitan region of São Paulo (MRSP) are numerically simulated with the WRF (Weather Research Forecasting) model for two 10-day field campaigns of the MCITY BRAZIL Project, carried out in February 19-28 (Summer) and August 6-15 (winter) 2013. The WRF model was able to simulate 66.6% of the observed LLJ events, displaying a high degree of agreement with the observed main properties. These modeling results confirmed that the presence of an Upper Tropospheric Cyclonic Vortex northeast MRSP during summer and South Atlantic Subtropical High circulation in the MRSP during winter favor the LLJ formation. On average, the simulated LLJ is 2.9 m s-1 more intense in the rural area and 189 m higher in the urban area. The direction of the LLJ does not vary much between the urban and rural areas. These differences can be attributed to the urban- rural contrast in the roughness and thermal properties at the surface, which together influence the intensity of turbulence in the urban boundary layer. The simulations indicated that LLJ is part of a shallow flow reminiscent of the daytime sea-breeze circulation produced by shallow baroclinicity associated by the daytime land-ocean thermal contrast. The WRF-model simulation indicates that the LLJ observed in the MRSP spreads westward for more than 300 km over the interior of the State of São Paulo, becoming more intense. The behavior of the rural LLJ can be explained in terms of the mechanical blocking effect produced by the Serra de Cantareira high hills to the easterly flow from ocean caused by a combination of sea breeze and large-scale circulations in the MRSP.
Keywords: low-level jet, metropolitan region of São Paulo, urban boundary layer, sea-breeze, local circulation
LLJ, Low-Level Jet; SBL, stable boundary layer; MRSP, metropolitan region of São Paulo; SODAR, Sonic Detection and Ranging; MCITY, megaCITY; UHI, urban heat island; SB, sea breeze; PM2.5, particular matter diameter ≤ 2.5 µm; MYJ, Mellor-Yamada-Janjic; PBL, planetary boundary layer; UBL, urban boundary layer; SASH, south Atlantic subtropical high; WRF, weather-research forecasting; ARW advance research WRF; NCEP, national center for environmental prediction; GFS, global forecast system; SLUCM, single layer urban canopy model; WUDAPT, world urban database access portal tool; LCZ, local climate zone; CF, cold front; ACM, “Aeroporto campo de Marte” (airport “campo de Marte”); VLLJ, LLJ intensity (m s-1); ZLLJ, LLJ height (m); DLLJ, LLJ direction (o); MBE, mean bias error; RMSE, root mean square error; d, Willmott’s index of agreement; DIGORA, model of data acquisition system manufactured by Vaisala; RS92-GSP, model of rawinsonde manufactured by Vaisala; UTCV, upper tropospheric cyclonic vortex; LT, local time
The term low-level jet (LLJ) refers to a relative maximum in the vertical profile of nose-shape horizontal wind speed, which most often occurs between 100 and 500 m above the surface at night.1–12 They occur most frequently in continental areas east of large mountain ranges in medium and high latitudes, under climatic conditions characterized by the absence of significant synoptic disturbances and by mesoscale baroclinicity induced by permanent horizontal thermal contrast associated with gently sloping terrain.4,10,13–15
Several studies have shown that LLJs can be formed by different mechanisms depending on geographic location and terrain characteristics.15–17 Although inertial oscillation is considered the main mechanism in the formation of LLJs,1,4,12,18,19,20 they are often triggered and modulated by shallow baroclinicity induced by sloping terrain15,21,22 and land-ocean thermal contrast in coastal areas.7,12,23,24 LLJs are also generated by orographic blocking and channeling effects25,26 and synoptic-scale meteorological forcings.11,22 There is also observational evidence of LLJs generated by land breeze in association to the thermal contrast induced by extensive rivers in the Amazon rain forest.27 LLJs play an important role in low level moisture transport, favoring the formation of convection and contributing to the development of mesoscale convective systems and causing intense precipitation events.28–36 Knowledge of the LLJ properties is very important to evaluate the potential for energy production in wind farm projects.37–40
In urban regions, LLJs can reduce urban heat island (UHI) intensity,12,19,41,42 surface pollutants and greenhouse gas concentrations by increasing dilution (turbulent vertical diffusion) and horizontal advective transport.12,43–50
In addition to a more complete understanding of the stable boundary layer (SBL) dynamics, improving the knowledge of LLJ properties has important practical applications, especially in urban areas where a large fraction of the world's population is concentrated. Furthermore, compared to mid- and high-latitude regions, LLJ properties at subtropical and tropical latitudes have received less attention, and much less is known about LLJs in urban regions at low latitudes compared to cities at mid- and high-latitudes.12 Both issues are critical for Brazil, as the urban fraction of its population is expected to grow from 87.6% in 2022 to 92.4% in 2050.51
In the metropolitan region of São Paulo (MRSP), four observational studies on LLJs are available in the literature.12,52–54 Nair et al.52 presented the first observational evidence of a LLJ event in the MRSP using SODAR measurements during July 19, 1999, with intensity of 21 m s-1, height of 1300 m and direction from northeast. Oliveira et al.53 using high-resolution rawinsonde data, collected during the 2013 field campaigns of the MCITY(MegaCITY) BRAZIL Project, identified the presence of LLJ events during typical undisturbed days in the summer (February 20, 2013) and winter (August 8, 2013) field campaigns.
The most detailed observational description of the LLJ properties was provided by Sánchez et al.12,54 Sánchez et al.54 analyzed 160 rawinsondes (high resolution) launched in the MRSP every three hours during 20 days in the 2013-summer and winter field campaigns of the MCITY BRAZIL Project. They showed LLJs occurred in 80% of the days, with height between 95 and 962 m, intensity between 2.7 and 14 m s-1 and direction from northeast quadrant. Sánchez et al.12 expanded analysis performed previously53,54 by including 2611 consecutive regular (coarse resolution) rawinsondes, launched twice a day, between 2009 and 2013. They also developed an algorithm to identify LLJ from vertical profiles of wind speed that takes into consideration the climate of the MRSP. Sánchez et al.12 results indicated that LLJ occurred in more than 77% of the days analyzed, mainly during nighttime and under undisturbed conditions, corroborating previous studies that LLJ can be considered as typical feature of the MRSP climate. They also showed observational evidence that the LLJs in the MRSP occur due to the inertial oscillation mechanism despite the low latitude. It was also found that jet-induced turbulent mixing contributes to inhibiting UHI and surface inversion layer intensities, playing a significant role in diluting the concentrations of carbon monoxide and particulate matter PM2.5 in the MRSP. They hypothesized that in the case of the MRSP, inertial oscillation may occur in association with shallow baroclinicity induced by the land-ocean thermal contrast, topographic and land use effects, and in consonancy to sea breeze (SB) and other local scale circulations.
Although these observational studies provided an important description of the LLJ properties (height, intensity and direction) in the MRSP, addressing the mechanism that causes and modulates them, it becomes mandatory expand the description of these features over a large spatial domain containing the entire MRSP, demanding information about the tridimensional wind field and other properties of the Urban Boundary Layer (UBL), what can only be made by numerical modeling. Several studies have shown the ability of the Weather Research and Forecasting (WRF) model in to reproduce the LLJ properties (height, intensity, direction and horizontal extension) in different regions such as the Great Plains,37,55–57 and Central Iowa40 in the USA, Tarim basin, Tibetan Plateau, northeastern and southern China,34,48,58 northern South America,59,60 Yerevan in Armenia,61 and Sahel in Africa.62 In this sense, numerical simulations become mandatory approach, with the WRF model being the most successful tool in numerical simulations of LLJs worldwide.
In urban areas, the number of numerical investigations of LLJs using the WRF model is lower.12 Hu et al.41 showed that jet-induced mechanical mixing plays a key role in modulating UHI intensity in Oklahoma City, USA. Lin et al.42 showed, using WRF model, that turbulent mixing produced by the LLJ increases the UHI intensity in Beijing, China. They also showed that the LLJ contributes to increasing the temperature downwind the Beijing urban area, expanding the UHI horizontally. On the other hand, Tsiringakis et al.63 used the WRF model to show that in London, UK, urban processes shift the LLJ upwards while decreasing its intensity. In the case of the Brazil, Tito et al.64 focused on the sensitivity of the Planetary Boundary Layer (PBL) schemes on the WRF model performance in to simulate the UBL properties observed at the surface of the MRSP during the MCITY-BRAZIL Project summer and winter field campaigns of 2013. The best performance was obtained by the WRF-model simulations using the Mellor-Yamada-Janjic (MYJ) PBL scheme.
The main objective of this work is to simulate, using WRF model, the main properties of LLJ (height, intensity, and direction) observed in the MRSP during 10 consecutive days in the Summer (February 19-28) and Winter (August 6-15) field campaigns of the MCITY BRAZIL Project of 2013. To improve the understanding of the LLJ in the MRSP by analyzing objectively how well the WRF model reproduces the LLJ events, and their properties obtained by Sánchez et al.12 Special attention will be given to the formation of the LLJ in the MRSP. The three-dimensional wind field used in this work is based on numerical simulations conducted by Tito et al.64 with WRF model.
Geographic and climate features of the MRSP
The MRSP is a conurbation of 39 municipalities with a population of 21.7 million inhabitants,65 located in southeastern Brazil, on the “Paulista” plateau, 722 m above sea level (asl) and 65 km from the Atlantic Ocean. The topography of the MRSP is complex, with the urban area located on the plateau delimited to the north and northwest by a chain of hills ranging from 300 to 700 m and, to the southeast by the slopes of “Serra do Mar”. The MRSP is composed of three river valleys: “Tiete” (east-west orientation), “Tamanduatei” and “Pinheiros” (northwest-southeast orientation).
The climate of MRSP is classified as high elevation subtropical humid (Cwb),66 with dry and mildly cold winter between June and August, and wet and warm summer between December and February. Large-scale circulation is controlled by the semi-permanent South Atlantic Subtropical High (SASH) and continental low-pressure systems, which induce weak surface winds from north-northeast sector during summer and from northeast-east sector in winter. The large-scale pattern is often disturbed by the passage of cold front (CF) throughout the year, which induces pre-frontal northwest winds and post-frontal southeast winds. There is observational and numerical evidence that several characteristics of the UBL in the MRSP are modulated by local circulations such as SB, mountain-valley and UHI centripetal circulations, induced by land-ocean, topographic and urban-rural thermal contrasts.12,53,67–69
WRF Model, Rawinsonde and LLJ Detection Algorithm
In this study, version 4.1.2 of the WRF-ARW model70 was used to simulate the LLJ in the MRSP. The simulations were performed for two 10-day field campaigns of the MCITY BRAZIL Project conducted in February (19-28) and August (6-15) of 2013. The first 12 h of each 10-day simulation was discarded as the spin-up period. The initial and boundary conditions are set up from the National Center for Environmental Prediction-Global Forecast System (NCEP-GFS), with horizontal and temporal resolution of 1° × 1° and six hours, respectively available in 27 vertical levels between 1000 hPa and 10 hPa.
Three nested horizontal domains were employed, corresponding to grid sizes of 15 km (200 x 200 grid points), 3 km (151 x 151 grid points) and 0.6 km (151 x 151 grid points). The first domain corresponds to an area of 3,000 km x 3,000 km covering the southeastern region of South America (Figure 1a). The second domain corresponds to an area of 450 km x 450 km covering most of the southeastern portion of the state of São Paulo (Figure 1a), and the third domain corresponds to an area of 90 km x 90 km, covering most of the urban area of the MRSP (Figure 1b). The center of all three domains were set closer to São Paulo City center (23o30’21.6” S; 46o38’7.48” W, 762 m asl) and near to the rawinsonde release area at the Campo de Marte Airport (ACM) (Figure 1b) . In all three horizontal domains, the vertical grid consists of 38 levels set from the surface to 50 hPa with vertical grid size variable. To ensure the highest resolution in the atmosphere adjacent to the surface, 25 out of 38 vertical levels were set below 4000 m and 14 levels are set below 1 km.
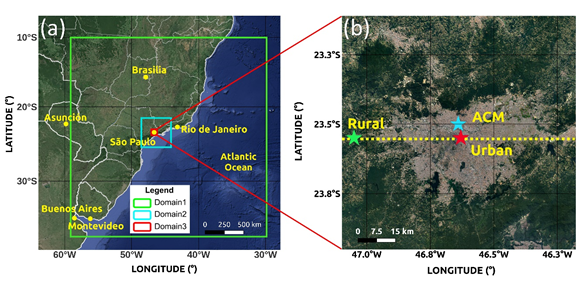
Figure 1 Geographic features of the horizontal domains of three-nested grids used by the WRF model in the numerical simulation of LLJ properties in the MRSP. In (a), the first (green square) and second (cyan square) domain correspond to areas of 3,000 km x 3,000 km and 450 km x 450 km, respectively. The third domain in (a) corresponds to an area of 90 km x 90 km covering the urban areas the MRSP (grey areas) is shown in (b) (Google Earth). Geographic position of rawinsonde site ACM (23º30'32" S, 46º38'04" W, 722 m asl) is indicated by a cyan star in (b). The dotted-yellow horizontal line in (b) indicates the position of the longitudinal cross section at latitude 23°33’01”S. Locations defined as typical urban and rural land use in the MRSP are indicated by red star (23°33’01”S, 46°33’42”W, 730m asl) and green star (23°33’01”S, 47°03’02”W, 920 m asl) in (b).
The physical configuration schemes consist of: MYJ for PBL turbulence scheme, Single-Moment 5-class for microphysics, Grell-Freitas for cumulus cloud, Rapid Radiative Transfer Model of Global Circulation Models for shortwave and longwave radiation, and Noah for land surface energy balance. In the urban area the Single Layer Urban Canopy Model (SLUCM) was used. The Noah scheme handles 24 categories of land use defined by United State Geological Survey (USGS) (https://www.usgs.gov/special-topics/land-use-land-cover-modeling). The SLUCM model includes 10 urban land use categories available in the World Urban Database Access Portal Tool (WUDAPT) and identified by the Local Climate Zone classification (LCZ) indexes.64,71
Rawinsonde data
This study is based on 160 rawinsondes carried out with a frequency of three hours during two periods of 10 consecutive days, from February 19 to 28 and from August 6 to 15, during MCITY BRAZIL Project field campaigns of summer and winter in 2013.53
The soundings were performed at the ACM (Figure 1b), north of São Paulo City, by a DIGORA III data acquisition system and rawinsonde model RS92-GSP, manufactured by Vaisala, Inc. In the first 4000 m, the average vertical resolution of soundings was 62 m, and all balloon trajectories remained within the MRSP urban limits.12,54,72,73
LLJ Identification Algorithm
Sánchez et al.12 developed and validated an algorithm to retrieve LLJ events in the MRSP from vertical wind speed profiles yielded by rawinsonde with vertical resolution varying from 62 m (high) to 302 m (coarse). It is based on a set of objective criteria (thresholds definitions) proposed by Baas et al.4 to identify LLJ in the rural area of Cabauw, Netherlands, and adapted to the MRSP climate features. According to the Sánchez et al.,12 a LLJ occurs in the MRSP when the maximum wind speed at the jet nose is greater or equal to 2 m s-1 below 1000 m and 25 % faster than the next minimum. Furthermore, a LLJ is only considered an event when this local maximum is observed in at least two consecutive wind speed profiles. During the field campaigns of the MCITY-BRAZIL Project in 2013, rawinsondes were released in the MRSP every three hours, therefore a LLJ event occurs whenever the duration of the LLJ is at least equal to 3 hours.
In this work, the above-described algorithm is applied to the vertical profiles of wind speed simulated by the WRF model to identify objectively the presence of LLJs and LLJ events. The vertical resolution of modeled wind profiles varied from 44 m at the surface to 220 m at 1500 m, equivalent to the high resolution rawinsondes (62 m). Figure 2 shows an example of two consecutive LLJ obtained from WRF-model simulations (Figure 2a) and rawinsonde (Figure 2b). All four wind profiles satisfy the criteria described above to detect LLJ objectively. They also exemplify LLJ events because they last at least 3 hours, satisfying the criteria of LLJ events adopted in this work.
WRF model performance
To verify the performance of the WRF model in to simulate observed LLJs in the MRSP, the simulated and observed LLJs properties, such as: intensity (VLLJ), height (ZLLJ), and direction (DLLJ), are objectively compared considering Mean Bias Error (MBE), Root Mean Square Error (RMSE), and Willmott’s index of agreement (d), as reference statistics parameters. A good model performance is indicated by a combination of small MBE and RMSE values, and d values close to 1. In this case, positive (negative) MBE, given by difference Rawinsonde-WRF, indicates that the model underestimates (overestimates) observation.64
For this purpose, the LLJ detection algorithm was applied to wind speed vertical profiles simulated at the grid point corresponding to the ACM (Figure 1b) during both summer and winter field campaigns of the MCITY BRAZIL Project conduct in the MRSP in 2013. Sánchez et al.54 showed that the positions of the balloons during ascent to 4000 m remain within urban limits, so it is plausible to assume that in the first 1500 m their position varied little with respect to the launch position in the ACM.
The WRF model showed good performance in simulating the main LLJ properties in the MRSP and reproducing 66.6% of the LLJ events detected from rawinsondes. Considering the statistical parameters, it was found that:
The WRF model shows acceptable values of all three statistical parameters for LLJ intensity and height (Figure 3a-b), with a slight tendency to overestimate the intensity (MBE<0) and underestimate the height (MBE>0). Equivalent results were obtained by Miao et al.11 in Beijing and Guangzhou, China. With respect to LLJ direction, the model shows excellent performance (Figure 3c).
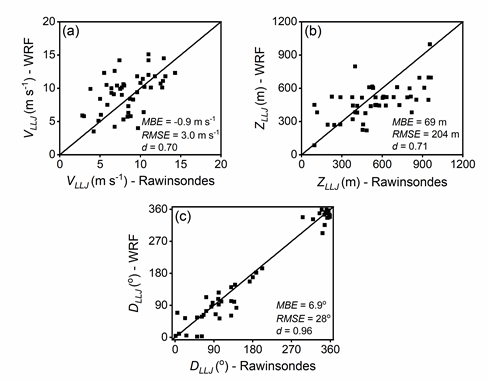
Figure 3 Dispersion diagrams of (a) intensity, (b) height and (c) direction of the LLJ estimated by the detection algorithm using vertical wind profiles retrieved every 3 hours by rawinsondes and WRF model simulations during two 10-consecutive days periods in the summer (February 19-28, 2013) and winter (August 6-15, 2013) field campaigns of MCITY BRAZIL project carried out in the MRSP. Diagonals correspond to 1:1 line.
Time evolution of the circulation
The visual inspection of time evolution of wind speed in the 1500-m layer next to the surface indicates that simulation and observation agree during most of the summer (Figure 4) and winter (Figure 5) field campaigns of 2013. This remarkable result shows that the WRF model can reproduce quite well the behavior of the lower part of wind field, including the UBL in the MRSP and the observed LLJ events (Figure 4,5).
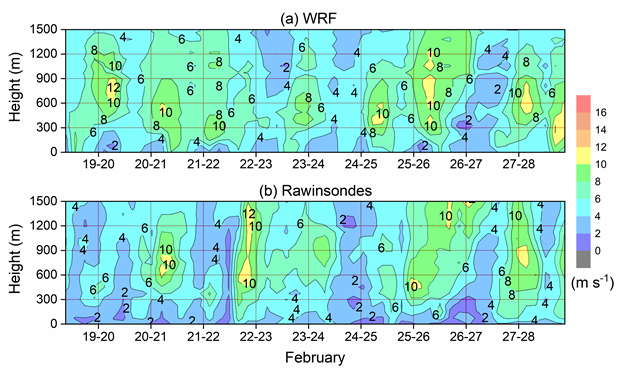
Figure 4 Contours maps of the wind speed time variation up to 1500 m in the MRSP for 2013 summer field campaign of the MCITY BRAZIL Project, based on (a) WRF-model and (b) rawinsonde data.
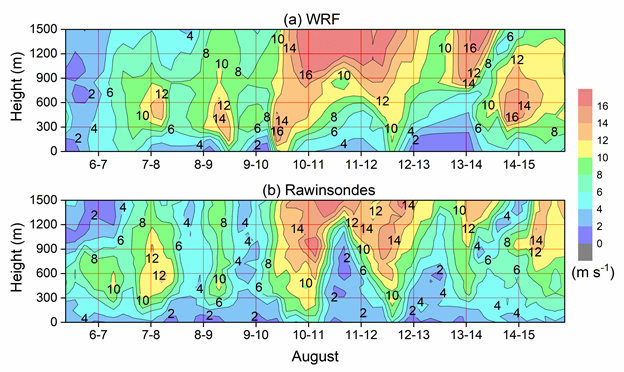
Figure 5 Contours maps of the wind speed time variation up to 1500 m in the MRSP for 2013 winter field campaign of the MCITY BRAZIL Project, based on (a) WRF-model and (b) rawinsondes data.
Summer field campaign of 2013
The WRF model simulated 62.5% of the LLJ events (5 events) retrieved from rawinsondes (8 events) in the 2013 summer field campaign. It simulated the LLJ events detected on the nights of February 20-21, 23-24, 24-25, 25-26 and 27-28 (Figure 4). During these days, an Upper Tropospheric Cyclonic Vortex (UTCV) positioned northeast inducing subsidence and light winds at the surface inhibiting clouds and favoring LLJ formation in the MRSP.12
However, the WRF model did not perform as well as on the previous days for the LLJ events detected on the nights of February 19-20 and 21-22, and in the afternoon on February 22. Although the LLJ events on February 19-20 and 21-22 occurred under favorable synoptic conditions (partly cloudy sky and light surface wind), the corresponding simulated LLJs have a much longer duration and are significantly less intense than the observed ones. In the afternoon of February 22, the LLJ event occurred associated with the passage of a SB front by the MRSP, starting at 1500 LT and lasting only 3 hours. After 1800 LT, the atmospheric conditions in the MRSP becomes very unstable due to a shortwave Upper Air Trough, producing 23.7 mm of rain and inhibiting the overnight LLJ development.12
Simulations carried out by Ribeiro et al.69 showed that, although the WRF model reproduces changes caused by the passage of a SB front, such as sharp changes in wind direction from northeast to southeast, followed by sharp and simultaneous decrease in temperature and increase in specific humidity in the surface of the MRSP, it was not able to simulate the changes observed in the wind flow above the surface produced by the passage of this SB front.
During the night of February 26-27, disturbed conditions prevailed in the MRSP due to the combination of Bolivia High and UTCV circulations, producing 39 mm of precipitation and consequently, both observations and simulations did not identify LLJ formation.
Winter field campaign of 2013
Similarly, during the 2013 winter field campaign the WRF model simulated 71.4% (5 events) of the LLJ events retrieved from rawinsondes (7 events). It simulated LLJ events observed during the nights of August 6-7, 7-8, 8-9, 9-10 and 14-15 (Figure 5). During most of the winter field campaign, a semi-permanent SASH positioned southeast induced subsidence and light winds at the surface inhibited clouds formation and favored LLJ formation in the MRSP. However, the model did not simulate the LLJ events observed on the nights of August 11-12 and 12-13. These two events lasted 6 and 9 hours, respectively, and occurred after the passage of CF through the MRSP.12
During the nights of August 10-11 and 13-14, weather conditions were disturbed by the passage of CF. Therefore, LLJ formation was not observed in the MRSP according to rawinsondes and simulations. It should be noted that WRF simulations reproduced very well the observed behavior of the wind (Figure 5) and air temperature during the passage of both CFs.71 Like summer, the WRF model satisfactory performance in reproducing the LLJ events in the winter field campaign, corroborating with inference that relevant LLJ formation mechanism was simulated satisfactorily.12 Therefore, these results make it possible to use WRF model simulations in the MRSP to clarify the physical processes that reproduce the main mechanisms of LLJ formation: inertial oscillation, shallow baroclinicity associated with land-ocean thermal contrast and thermal and mechanical effects induced by the topography and land use.
Shallow Baroclinity and Inertial Oscillation
The time evolutions of the wind speed and direction simulated by the WRF model (Figure 6a) and observed from rawinsonde (Figure 6b) in the first 2000 m between 1700 LT of February 27 and 1900 LT of 28, 2013, display a remarkable similarity. This indicates that the model successfully reproduces the vertical structure of the observed wind field during the entire period. A maximum intensity core in the first 1000 m associated with the presence of the LLJ during nighttime appears in both simulation (Figure 6a) and observation (Figure 6b). After 0900 LT of February 28, the LLJ is completely removed by turbulent mixing induced by daytime thermal convection. The WRF-model successfully reproduced the beginning (1800 LT) and end (0900 LT) of this LLJ event. On the other hand, the LLJ intensity was slightly overestimated by the model. Like observations, the simulation displays a counterclockwise wind vector rotation during the life cycle of the event (Figure 6 a, b).
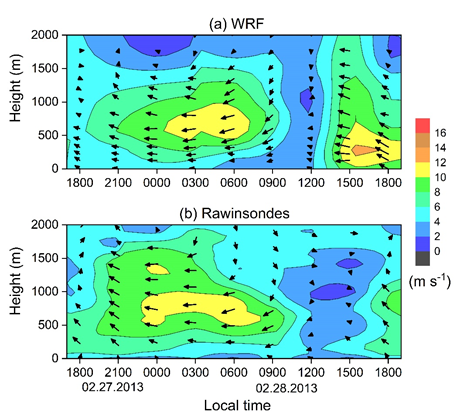
Figure 6 Time evolution of wind speed (contour maps) and direction (wind vectors profiles) during a typical LLJ event based on vertical wind profiles (a) simulated by WRF model and (b) observed with rawinsondes every 3 hours in the MRSP during the night of February 27-28, 2013.
Both simulation and observation indicate that LLJ are immersed in a very weak northeast background flow, more visible during the convective period (Figure 6). Therefore, it is possible to infer that this shallow southeast flow is reminiscent of the daytime SB circulation, reflecting the shallow baroclinicity associated by the daytime land-ocean thermal contrast.
Figure 7 displays the time evolution of the vertical profiles of wind speed (Figure 7a-f) and wind direction (Figure 7g-l), simulated by WRF model and obtained from rawinsondes from 1800 LT on February 27 to 0900 LT on 28, 2013, during a typical LLJ event in the MRSP. Considered as a typical summer LLJ event in the MRSP, it occurred under undisturbed synoptic conditions associated with the presence of a semi-stationary UTCV positioned northeast of the MRSP.12
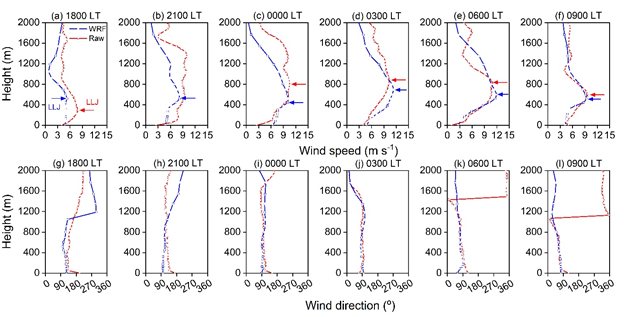
Figure 7 Comparison of (a-f) wind speed and (g-l) direction vertical profiles simulated by WRF model (blue) and observed with rawinsondes (red) every 3 hours, from 1800 LT on February 27 to 0900 LT on February 28, 2013, in the MRSP. Horizontal arrows correspond to the LLJ identified objectively by the algorithm.
The observations indicate that LLJ appears around 1800 LT at 289 m, with intensity of 7.9 m s-1 and direction from southeast (Figure 7a, g), reaching around 0600 LT a maximum intensity of 11 m s-1, from east-northeast, at height of 804 m (Figure 7e, k). The WRF model was able to simulate a complete cycle of the LLJ in the MRSP, from beginning to end, with duration of 15 hours (1800-0900 LT). The simulations indicate that at 0600 LT the LLJ event reached a maximum intensity of 11.9 m s-1, from east-northeast, at 599 m from the surface.
Wind hodographs based on the wind vector simulated and observed, interpolated linearly at 200 m (Figure 8a) and 600 m (Figure 8b), during LLJ event of February 27-28, 2013, indicate that WRF model was able to capture the inertial oscillation observed in the MRSP. The analysis of all LLJ events simulated by the WRF model (not show here) indicate that 85% of the LLJ events observed during both field campaigns of the MCITY BRAZIL Project displayed inertial oscillation.12
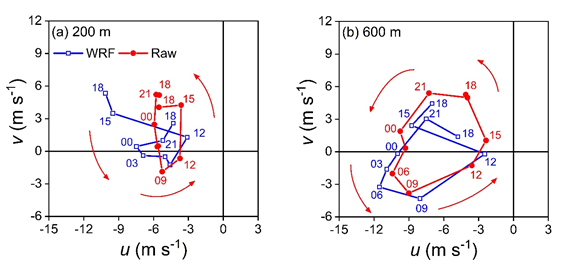
Figure 8 Comparison of wind hodographs based on WRF model simulations (blue) and rawinsondes (red) data interpolated at (a) 200 m and (b) 600 m from 1800 LT on February 27 to 1800 LT on February 28, 2013, at ACM. Numbers indicate local time. Anticlockwise rotations are indicated by red arrow.
Topographic and Urban-Rural differences land use effects
To identify the impact of urban-rural land use differences in LLJ properties in the MRSP, it will be analyzed in this section WRF model simulations carried out during February (19-28) of 2013, more specifically from 1800 LT on February 27 to 0900 LT on February 28, 2013, in two typical urban and rural land use sites (Figure 9). Both sites correspond to grid points in the domain 3, with urban site (23°33’01” S, 46°33’42” W, 730 m asl) near the São Paulo City center as indicated by the red star in Figure 1b, rural site (23°33’01” S, 47°03’02” W, 920 m asl) at 42.8 km west urban site and indicated by green star in Figure 1b. In this analysis it is assumed that observed wind profiles are representative of wind field at the point of released of rawinsonde ACM.
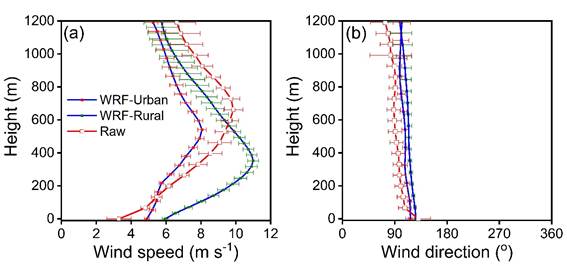
Figure 9 Mean vertical profiles of wind (a) speed and (b) direction simulated by WRF model (blue line with red and green error bars) and observed by rawinsondes (red line and error bar). Based on hourly wind profiles simulated at the urban and rural sites and observed rawinsondes every 3 hours from 1800 LT on February 27 to 0900 LT on February 28, 2013, in the MRSP. The red and green horizontal bars indicate the standard error of the mean.
Figure 9 displays the mean vertical profiles of wind speed and direction of the LLJ simulated (urban and rural sites) and observed (ACM) during the night of February 27-28, 2013. On average, the intensity of the simulated LLJ shows significant variation between urban (8.1 ± 0.2 m s-1) and rural (11.0 ± 0.3 m s-1) sites (Figure 9a). On the other hand, the LLJ in the urban area (541 ± 62 m) is significantly higher than at the rural site (352 ± 36 m). In both locations, the simulations indicate that the average direction of the LLJ in the urban location does not differ from that in the rural location, remaining within the error bar intervals and from east-southeast during the night (Figure 9b).
Comparatively, the observed LLJ intensity at ACM (red line in Figure 9a) is 1.8 m s-1 stronger than LLJ intensity of simulated at the urban site (blue line and red error bar) and 1.14 m s-1 weaker than LLJ intensity simulated at the rural site (blue line and green error bar) the observed (red line and error bar). The observed LLJ direction displays smaller but noticeable difference (Figure 9b). Taking into consideration the error bars, the LLJ direction observed is slightly more from east than the simulated in the rural site. The height of the observed LLJ at urban site ACM is 120 m (309 m) higher than the LLJ simulated at the urban (rural) sites.
The local differences in the LLJ simulated WRF model in the MRSP (Figure 9) are similar behavior to LLJs observed in other regions of the world, such as Oklahoma (USA), Moscow (RU), and London (UK). Wang et al.74 studied the LLJs properties in the period between June 28 and July 31, 2003, in Oklahoma, USA, and showed that LLJs over the urban areas are higher (~25-100 m) and 10-15% weaker than at suburban areas. Kallistratova et al.75 compared the characteristics of LLJs between an urban and a rural site of Moscow, Russia during 27 days of July 2005 and found that in the urban area LLJs occurred at a higher height (100-150 m) than in the rural area. On the other hand, Tsiringakis et al.63 studied two LLJ events that occurred in May 14-16, 2019, in London, UK and showed that LLJ in the urban area occurred at higher height (60-90 m) and was less intense (0.3-2 m s-1) than in the rural area. These studies attributed the urban-rural differences in the LLJ characteristics to the urban-rural contrast in roughness and surface thermal properties, which together intensify the turbulence in the UBL over the urban portion of these cities. Therefore, it is plausible to infer that similar effects (roughness and surface thermal contrasts) are acting to reduce the intensity and increase the height of the LLJ in the urban portion of the MRSP.
Spatial distribution of LLJ in the MRSP
The WRF model simulations described in this section indicate that, compared to the rural areas, a stronger turbulent mixing over the urban area of the MRSP act to increase the height and decrease intensity of the LLJ. The urban-rural contrasts on the spatial distribution of the LLJs are better portrayed by the wind speed contour maps (Figure 10). They display the horizontal extent of the wind speed and direction up to 2400 m and at 0300 LT on February 28, 2013, when observations indicate that the LLJs in MRSP reach the mature stage.12 In fact, WRF model simulations indicate the LLJ intensity reaches a maximum of 11.4 m s-1 at 0300 LT in the MRSP (Figure 7d). The contour plots correspond to the longitudinal cross-section at 23°33’01” S, a grid line of domain 2 and 3, passing through the rural and urban sites (Figure 1b).
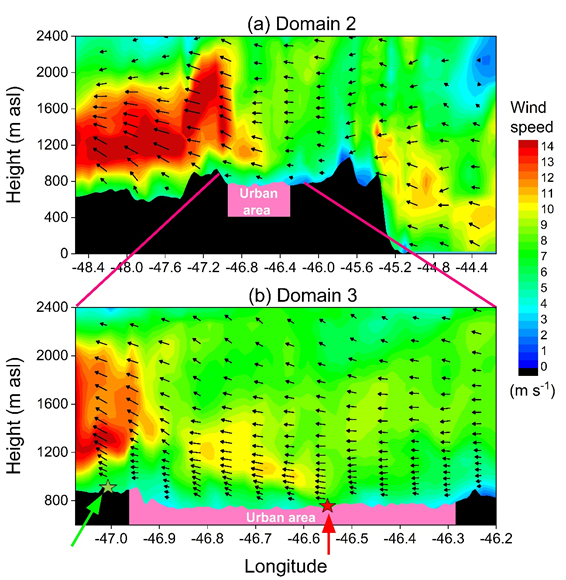
Figure 10 Contour maps of wind speed simulated by the WRF model at 0300 LT on February 28, 2013. These cross sections correspond to horizontal extensions of (a) 450 km (domain 2) and (b) 90.6 km (domain 3), corresponding to the grid line crossing the urban (red star) and rural (green star) sites as indicated by red and green vertical arrows in (b). Vertical profiles of horizontal wind vectors are indicated by black arrows. The urban and rural land use are indicated by magenta and black representation of the topography.
Figure 10a indicates that a coastal LLJ with maximum intensity of 11.5 m s-1 around 700 m from the surface. In the MRSP located between the top of “Serra do Mar” slopes and the “Serra da Cantareira” hill basis the LLJ weakens towards west, almost disappearing at São Paulo City center (red star Figure 10b). From this point the LLJ appears again and intensifies towards the rural region, reaching its highest intensity (~14-16 m s-1) between 800 and 2200 m asl, approximately over the extreme west of the domain. The LLJ direction remains from east and east-southeast throughout the domain 2 (Figure 10a).
From these numerical results, it is reasonable to assume that the LLJ in the MRSP is part of a larger easterly flow that propagates from the east coast responding to the topography and land use changes as it moves inland.
The wind field simulated with higher grid resolution domain 3 reveals that a less intense (~4 m s-1) in west portion of the urban area (Figure 10b). These results coincide with what was observed in London, UK, by Tsiringakis et al.63 and show that, along with topography, urban land cover also has an important influence on the evolution and properties of the LLJ that forms in the MRSP.
The main features of the LLJs in the MRSP are numerically simulated by the WRF model. The simulated period corresponds to two 10-day field campaigns of the MCITY BRAZIL Project, carried out in summer (February 19-28) and winter (August 6-15) of 2013, in the MRSP. The detection algorithm, developed and validated by Sánchez et al.12 to retrieve LLJ properties in vertical wind speed profiles yielded by rawinsondes, was successfully applied to vertical wind speed profiles simulated numerically. The WRF model simulations reproduced 66.6% of LLJ events identified previously by Sánchez et al.12 The LLJ properties (height, intensity and direction) are better simulated by the WRF during periods when undisturbed synoptic conditions prevailed. The modeling confirmed that atmospheric conditions determined by an UTCV northeast MRSP during summer and SASH circulation during winter, favors the LLJ formation in the MRSP. The combination of MYJ scheme, for PBL turbulence, with the SLUCM scheme, for surface energy balance that takes into consideration 10 categories of urban land use available in the WUDAPT, contributes for the WRF model to simulate the LLJ in the MRSP with acceptable performance for height and intensity and excellent performance for wind direction. Consequently, the WRF model simulation data can be used to investigate LLJ formation mechanisms: shallow baroclinicity associated with land-ocean thermal contrast, inertial oscillation, and thermal and mechanical effects induced by the topography and land use.
The analysis of the LLJ behavior simulated by the WRF for the typical event in the night of February 27-28, 2013, indicates that LLJ is immersed in a very weak northeast background shallow flow reminiscent of the daytime SB circulation, reflecting the shallow baroclinicity associated by the daytime land-ocean thermal contrast. The time evolution of the wind vector simulated at 600 m, during the typical LLJ event of February 27-28, 2013, does also indicate that WRF model was able to capture the inertial oscillation observed in the MRSP. Cross section wind field analysis indicated that urban-rural land use contrast, mainly surface roughness and thermal properties modified turbulence in the UBL, acting to reduce the intensity and increase the height of the LLJ in the urban portion of the MRSP. Similar behavior has been observed in other cities.63,74,75 Finally, the analysis of the simulated wind cross section also indicates that the LLJ observed in the MRSP spreads westward for more than 300 km over the interior of the State of São Paulo. This analysis also indicates that the intensity of rural LLJ increases systematically in high hills. Therefore, the rural LLJ can be explained in terms of the mechanical blocking effect produced by the “Serra de Cantareira” hills to the easterly flow from ocean caused by a combination of SB and large-scale circulations (SASH) in the MRSP.
This research was sponsored by the Brazilian Research Foundations: FAPESP (2011/50178-5; 2020/07141-2; 2022/06511-6; 2023/11211-4; 2024/21872-0), FAPERJ (E26/111.620/2011; E-26/103.407/2012), CNPq (305357/2012-3; 309079/2013-6; 462734/2014-5; 166519/2017-0; 304786/2018-7; 306889/2022-6; 312892/2023) and CAPES (001; 88882.328044/2019-01). The first author acknowledges the scholarship provided by CAPES. We would like to thank the Brazilian Air Force.
The authors declare that they have no conflicts of interest.

©2025 Sánchez, et al. This is an open access article distributed under the terms of the, which permits unrestricted use, distribution, and build upon your work non-commercially.