International Journal of
eISSN: 2576-4454


Research Article Volume 5 Issue 3
Department of Hydrology, Mexican Institute of Water Technology, México
Correspondence: Miguel Angel Mejía-González, Mexican Institute of Water Technology, Paseo Cuauhnahuac 8532, Jiutepec, Morelos, México
Received: April 28, 2021 | Published: June 1, 2021
Citation: González-Hita L, Mejía-González MA, Carteño-Martinez B, et al. Isotopic composition of rainfall in Baja California Sur, México. Int J Hydro. 2021;5(3):93-100. DOI: 10.15406/ijh.2021.05.00271
The study of the connection between precipitation and groundwater recharge/discharge using stable isotopes has been limited in México. One of the main limitations is the lack of local stable isotopes monitoring for rainfall. Indeed, only two stations of the Global Network of Isotopes in Precipitation operated in Mexico from 1962 to 1988. This study reports temporal characterization of stable isotopes in meteoric waters in the northwest of Mexico that has been lacking up to the present. Stable isotope analyses of the rain collected in the city of Loreto, state of Baja California Sur, from 2018 to 2021 were conducted using laser water isotope analyzers Picarro L2110-i and Los Gatos Research LWIA-45EP. A least squares regression of the isotope data was used to obtain the local meteoric water line: δ2H =8 δ18O + 9.4 (r2=0.98). The average value of winter rain is δ18O=-2.46 ‰ and δ2H=-10.2 ‰, monsoon rain δ18O=-4.93 ‰ y δ2H=-30.3 ‰, atmospheric river rain δ18O=-5.35 ‰ and δ2H=-33.3 ‰ and tropical cyclones rain δ18O= -10.7 ‰ y δ2H=-76.3. Isotope data indicated that tropical cyclones are the main source of recharge for the coastal aquifers of Baja California, Sur.
Keywords: Baja California Sur México, stable isotopes, rainfall, local meteoric water line, national network of isotopes in precipitation
GNIP, global network of isotopes in precipitation; IMTA, Mexican institute of water technology; RENIP, national network of isotopes in precipitation; NPSH, north pacific subtropical high; NAH, north American high; MM, Mexican monsoon; TS, tropical systems; ARs, atmospheric rivers; TC, tropical cyclones
Several researchers have studied the contribution of different atmospheric mechanisms to the precipitation and groundwater recharge of the subtropical zones of Mexico. Rodgers1 reports that tropical cyclones (TC) contribute 30 to 40 percent of the rainfall of Baja California Sur. Jiang2 found that the maximum contribution of TC in the East-Central Pacific Basin occurs near the coast of Baja California Sur (about 55%). Breña-Naranjo3 after analyzing rainfall data from 1998 to 2013, determined that TC contributes with 40% of the total annual rainfall in Baja California Sur. According to García4 in Baja California Sur the monsoon produces 28.3% of the cloudiness.
Eastoe5 analyzed the isotopic composition of coastal aquifers in Baja California Sur, finding that coastal groundwater has depleted values, which is not common at this latitude at sea level. Eastoe assumes it is because tropical cyclones are the main source of recharge for coastal aquifers. Ouyss6 carried out a study of the groundwater flow systems and their environmental interactions, in the protected area of Valle de Los Círios, Baja California. They found some groundwater samples with depleted heavy isotopes and low Cl content. They considered these results could be produced by modern recharge from tropical cyclones.
In order to characterize the spatial and temporal variability of the stable isotopes of precipitation on a global scale, the International Atomic Energy Agency and the World Meteorological Organization, implemented the Global Network of Isotopes in Precipitation (GNIP).7,8 The network began operating in 1960, collecting thousands of isotope and meteorological data to date. Only two GNIP stations operated in Mexico, one in the city of Chihuahua (north Mexico) and the other in the city of Veracruz (Gulf of Mexico) from 1962 to 1988. The study of the connection between precipitation and groundwater recharge/discharge using stable isotopes has been limited in México. One of the main limitations is the lack of local stable isotopes monitoring for rainfall.
In order to incorporate isotope hydrology into national water resources assessments, the Mexican Institute of Water Technology (IMTA) installed in 2018 a National Network of Isotopes in Precipitation (RENIP). This paper presents the stable isotopes of oxygen and hydrogen in precipitation, obtained from 2018 to 2021 in the rainwater collector installed in the coastal city of Loreto in the state of Baja California Sur. Results provide temporal characterization of stable isotopes in meteoric waters in the northwest of Mexico that has been lacking up to the present. This study may contribute to the understanding of groundwater recharge mechanisms in the arid subtropical regions of Mexico.9,10
Study area
The state of Baja California Sur is located in the northwest of Mexico, and limits to the north with Baja California (28o N), to the east with the Gulf of California (109 o W), to the south (23o N) and west (115o N), with the Pacific Ocean11 (Figure 1). The state has a length of 750 km, an average width of 100 km and 2,200 km of coastline.11 The entity is located within a high-pressure subtropical zone, with dry winds descending, which induce a dry and semi-warm to hot climate.11 The central desert is hot and dry, while the cape region has a hot, semi-arid steppe climate. Precipitation is very irregular in time and quantity, so almost all surface currents are intermittent. The average annual precipitation in the period 1941-2000 was 176 mm, with the highest rainfall from July to January.12 The potential evaporation is approximately 1,500 mm per year.12 The most relevant physiographical characteristics are: the Vizcaino Desert in the northwest, the plain Llano de Magdalena in the west, and La Giganta range in the southeast.13 The mountains to the west are gently sloping and steep towards the Gulf.
Two geomorphological units are distinguished (1) coastal valleys and (2) mountain ranges. The valleys have flat shapes with slight slope to the sea, reduced dimensions and intermittent dense drainage, dendritic and subdendritic type in the mountains and parallel in the valleys. The coastal aquifers are unconfined, and consist of alluvial sediments deposited along the stream courses and on the coastal plain, with small dimensions and little storage capacity.14 Coastal aquifers are recharged by direct infiltration of rain over the valleys, as well as by infiltration of runoff in intermittent streams during the rains. The discharge occurs naturally by groundwater flow to the sea, and by evapotranspiration in small areas that have shallow water tables; artificially it is carried out by the extraction of water in dug and tube wells.
Climatic and meteorological characteristics
Among the climatic and meteorological components of the study area are: North pacific subtropical high (NPSH), North American high (NAH), Mexican monsoon (MM), cold fronts, atmospheric rivers and tropical systems (TS) (cyclones, storms and depressions). The NAH is a center of high atmospheric pressure (1020 mb) produced in the winter by low temperatures, in the United States of North America and Canada. Masses of cold and dry air flow from the NAH, causing cold fronts in the region.15 Depending on the thermodynamic characteristics of the environment, the convergence of the cold fronts with low-level moisture advected from the eastern tropical pacific, produces moderate rain. The NPSH is a center of high atmospheric pressure (≥1020 mb) in the pacific, located in winter around 28°N,130oW and in summer at 38oN,150oW.16 The NPSH cause intense subsidence and atmospheric stability at those latitudes reducing deep convection, which prevents the formation of clouds.17
The movement of the NPSH to the north in the summer allows low-level winds transport moisture from the Pacific Ocean to Baja California Sur.18,19 The moisture warmed by the hot ground produces convective rain, also known as Monsoon rain. Atmospheric rivers (ARs) are long (thousands of kilometers) and narrow (hundreds of kilometers) regions where strong low-level winds transport water vapor across the midlatitudes.20 AR are important source of precipitation in many regions, for instance, Dettinger21 estimated that 25-50% of rainfall in California is produced by AR. The northeast Pacific is the region where the highest number of AR occurs.22
The movement of the NPSH to the north also allows that tropical cyclones (TC) approach to Baja California Sur, reducing atmospheric stability and causing ascending motion that produce deep convection and precipitation.17 Most of the TC of northeast pacific originate near the Mexican pacific coast, offshore of the Gulf of Tehuantepec.23 Many of the TC turn toward the northwest of México. The states of Baja California Sur and Sinaloa have the highest frequencies of TC touching land in México, both in the northwest.24
Monthly precipitation samples were collected from June 2018 to January 2021 using a RS2 PALMEX25,26 rainwater collector (Figure 2) that allows monthly sampling without evaporation or isotopic fraction. Samples were filtered using cellulose membranes with 0.45 µm pore size, collected in 60 mL high-density polyethylene bottles with conic and polyseal inserts, and filled with no headspace when permitted. The collector is located at the facilities of the Loreto National Meteorological Service, CONAGUA, whose coordinates are (26.011N, 111.35 W) and altitude of 6 m above sea level. Rainfall amounts were measured using a Data-Logging Rain Gauge, WatchDog 1120.
Stable isotope analyses were conducted at the Isotope Hydrology Laboratory of the Mexican Institute of Water Technology (IMTA), using laser water isotope analyzers Picarro L2110-i and Los Gatos Research LWIA-45EP. The analytical precision was ±0.5 o/oo for δ2H and ±0.13 o/oo for δ18O. The secondary standards were: Popocatepetl Volcano Water, PVW (δ2H=- 81.4‰, δ18O=- 11.79‰), Laguna Verde Water, LVW (δ2H=17.1‰, δ18O=3.38‰), and Playa del Carmen Well Water, PCWW (δ2H=-28‰, δ18O=-4.8‰). PVW and LVW standards were used to normalize the results to the VSMOW2-SLAP2 scale, while PCWW was used as quality control and drift control standard.
Rainfall
The accumulated monthly rainfall samples from 2018 to 2021 used in this study were analyzed to determine their content of stable isotopes. The values of the δ18O ‰ (VSMOW) and δ2H ‰ (VSMOW) are shown in Table 1. With the data, the graph of the relationship δ18O ‰ (VSMOW) versus δ2H ‰ (VSMOW) was elaborated (Figure 3). A least squares regression of the precipitation isotope data was used to obtain the local meteoric water line:
|
Collector |
Latitude |
Longitude |
Altitude |
Sampling |
δ18O (‰) |
δ2H (‰) |
Precipitation |
Rain system |
|
Loreto |
26.012 |
-111.349 |
6 |
Jun-18 |
-13.48 |
-97.8 |
33.9 |
Hurricane Bud |
|
Loreto |
26.012 |
-111.349 |
6 |
Sep-18 |
-12.13 |
-86.9 |
52 |
Tropical depression Nineteen-E |
|
Loreto |
26.012 |
-111.349 |
6 |
Jan-19 |
-2.38 |
-6.9 |
13.7 |
Winter rain |
|
Loreto |
26.012 |
-111.349 |
6 |
Aug-19 |
-5.74 |
-34.7 |
89.9 |
Monsoon rain |
|
Loreto |
26.012 |
-111.349 |
6 |
Sep-19 |
-9.43 |
-60.8 |
30.2 |
Hurricane Lorena |
|
Loreto |
26.012 |
-111.349 |
6 |
Oct-19 |
-10.63 |
-80.9 |
36 |
Tropical depression Invest 96E |
|
Loreto |
26.012 |
-111.349 |
6 |
Nov-19 |
-7.74 |
-55 |
86.4 |
Tropical storm Raymond |
|
Loreto |
26.012 |
-111.349 |
6 |
Dec-19 |
-1.98 |
-0.7 |
1.4 |
Winter rain |
|
Loreto |
26.012 |
-111.349 |
6 |
Mar-20 |
-2.23 |
-13.9 |
5.2 |
Winter rain |
|
Loreto |
26.012 |
-111.349 |
6 |
Aug-20 |
-4.11 |
-25.9 |
4.8 |
Monsoon rain |
|
Loreto |
26.012 |
-111.349 |
6 |
Sep-20 |
-3.26 |
-19.1 |
11.32 |
Winter rain |
|
Loreto |
26.012 |
-111.349 |
6 |
Jan-21 |
-5.35 |
-33.3 |
8.38 |
Atmospheric river |
Table 1 Stable isotopes of oxygen and hydrogen of precipitation in Loreto
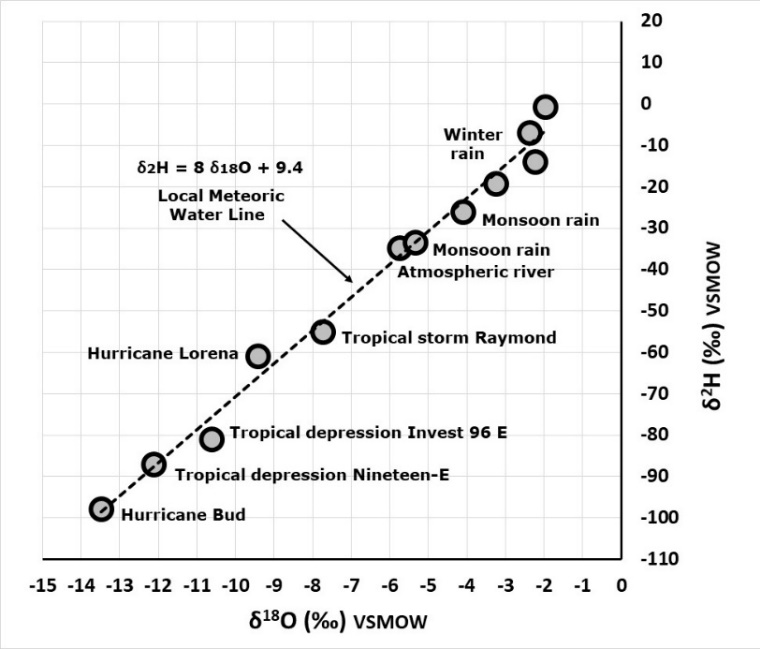
Figure 3 Relationship between δ18O and δ2H in precipitation of Loreto, and local meteoric water line.
δ2H =8 δ18O + 9.4 (r2=0.98). The average value of winter rain is δ18O=-2.46 ‰ and δ2H=-10.2 ‰, monsoon rain δ18O=-4.93 ‰ y δ2H=-30.3 ‰, atmospheric river rain δ18O=-5.35 ‰ and δ2H=-33.3 ‰ and tropical cyclones rain δ18O=-10.7 ‰ y δ2H= -76.3 ‰ (Figure 4).
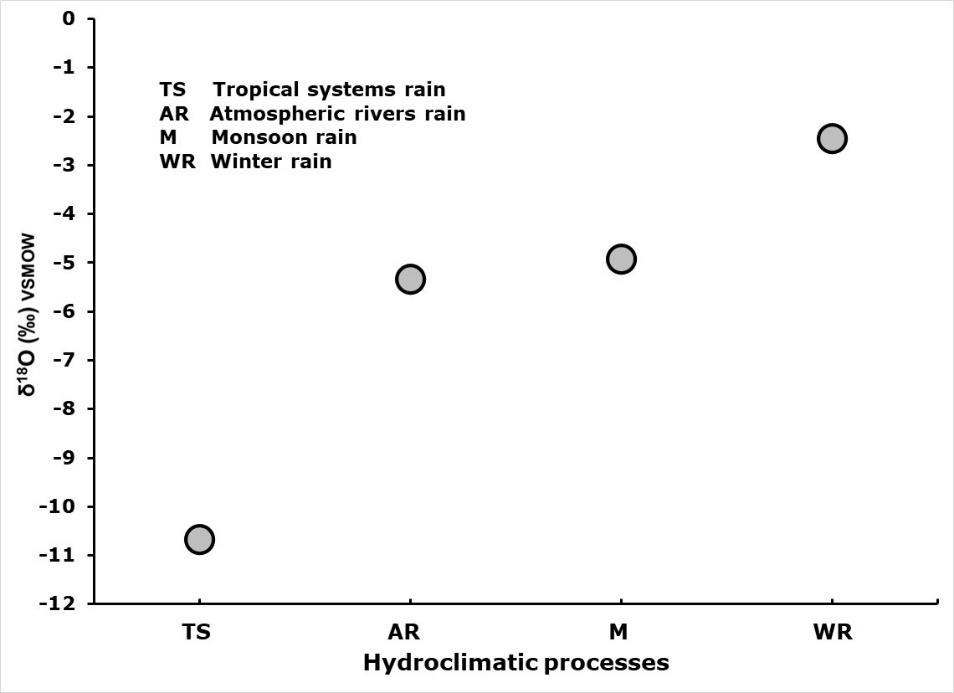
Figure 4 Average value of δ18O of winter rain, monsoon rain, atmospheric rivers rain, and tropical systems rain (cyclones, storms and depressions).
The depleted heavy isotope values (more negative) correspond to tropical systems rain (cyclones, storms, and depressions). The enriched heavy isotope values (less negative) correspond to winter rain.
Winter rainfall
The cold fronts season in Mexico begins in September and ends in May of the following year.27 In the period 1981-2010 there were an average of 44 frontal systems during this season.27 Moisture transport in the American continent, during winter, has a westward flow in the tropics and eastward in the middle latitudes.28 During this season, there is a moisture flux from the Pacific Ocean towards the northwest of Mexico.28 Depending on the thermodynamic characteristics of the environment, the convergence of the cold fronts with moisture advected from the Pacific Ocean, produces moderate rain.
On January 6 and 7, 2019, the convergence of a cold front with moisture from the Pacific Ocean (Figure 5), caused rains in the Loreto area.29 According to the daily rain report of Loreto30 in the month of January 2019, it only rained on the 6th and 7th, therefore the accumulated monthly rain in the collector for this month corresponds to winter rain. In December 2019, the entry of a cold maritime air mass through the northwest of Baja California and a cold continental air mass that descended from the center of the United States, in combination with entry of moisture from the Pacific Ocean associated with a subtropical jet stream, caused rains in Baja California Sur.29 Winter precipitation in Baja California Sur is enriched in heavy isotopes, because represents the early stage of rainout with minimal evolution from the Pacific Ocean.31
Tropical cyclone rain
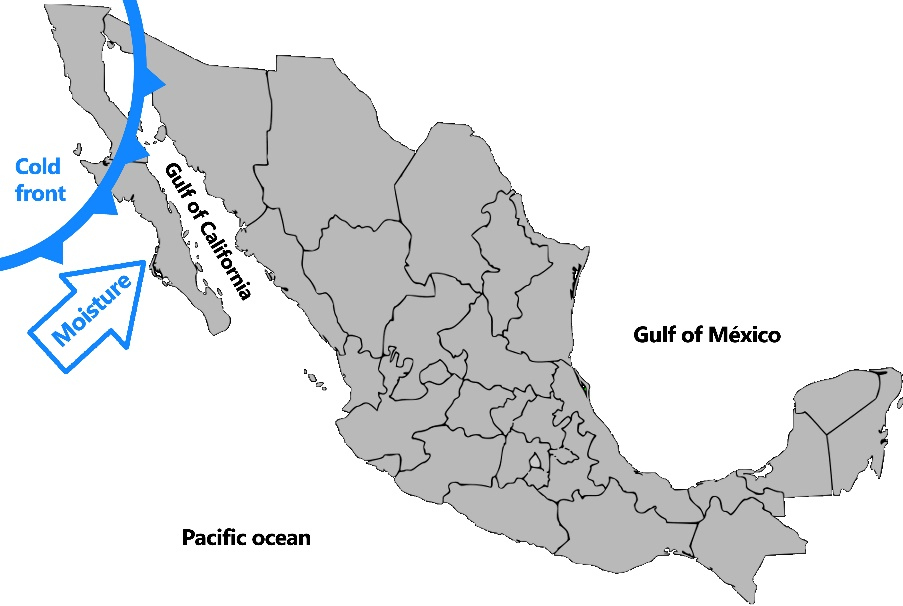
Figure 5 Weather systems on January 6, 2019 in Baja California Sur.29
In the area, during the study period, various tropical cyclone systems were present. One of them was hurricane Bud that formed on June 9 off the coast of Guerrero, and moved westward in a parallel trajectory to the coasts of Guerrero, Michoacán and Jalisco, making landfall in Baja California Sur on June 1532 (Figure 6). According to the daily rain report of Loreto33 in the month of June 2018, it only rained on the 15th and 16th, therefore the accumulated monthly rain in the collector for this month corresponds to tropical cyclone rain. Another event corresponded to hurricane Lorena that affected the Mexican Pacific coast during the second half of September 2019.34 It began as a zone of instability in the state of Chiapas on the 14th. It reached the category of a tropical storm on the 17th when it was located in Guerrero, and category of hurricane when it arrived in Colima. It made landfall on September 19 in Jalisco. On September 20, the hurricane made landfall in Baja California Sur with winds of 130 km/h and a minimum pressure of 986 mb (Figure 7). According to the daily rain report of Loreto30 in the month of September 2019, it only rained on the 20th and 21st, therefore the accumulated monthly rain in the collector for this month corresponds to tropical cyclone rain. Tropical cyclones produce rain with depleted heavy isotopes due to fractionation in massive precipitating clouds.35,36 During horizontal transport of vapor from the outer edge of the rainshield to the eyewall, and later vertical transport to great heights, condensation and precipitation occur, decreasing the values of δ18O and δ2H due to progressive removal of heavy isotopes.35,37,38,39
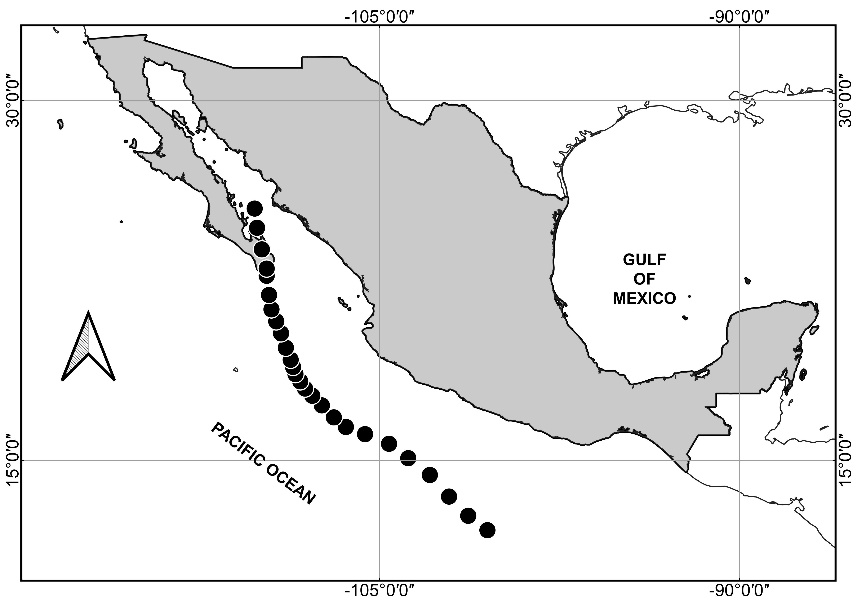
Figure 6 Hurricane Bud, positions 9-15 June 2018.
(Data retrieved from https://https://www.nhc.noaa.gov/data/tcr/EP032018_Bud.pdf)

Figure 7 Hurricane Lorena, positions 17-22 September 2019.
(Data retrieved from https://www.nhc.noaa.gov/data/tcr/EP152019_Lorena.pdf)
Monsoon rain
In the summer, the air over the continent warms up more than the air over the ocean, producing a pressure gradient between the continent (low pressure) and the Pacific Ocean (high pressure). The barometric gradient induces wind currents that transport moisture from the Pacific Ocean to the continent.40 Intense warming of the Sonora Desert during the summer, produces a thermal gradient between the sea surface in the Gulf of California (30 oC) and the Pacific Ocean (22 oC).41 The thermal gradient is associated with an atmospheric pressure gradient between the Pacific Ocean (1012 hPa) and the Gulf of California (1008 hPa).41 The pressure gradient induces moisture transport from the Pacific Ocean to the Gulf of California.
The moisture warmed by the hot ground is lifted in a strong upward air motion to high altitudes.42 Convective updrafts are supply with parental moisture enriched in heavy isotopes from the Pacific Ocean. After condensation, raindrops fall in a strong downward air motion.42 The high falling speed of the raindrops43 does not allow isotopic exchange with surrounding moisture44,45 preserving the heavy isotopes acquired during the updraft.
Atmospheric rivers rain
At the convergence zone of the cold front and the warm conveyor belt of extratropical cyclones, high vertically integrated water vapour bands are formed.46 The moisture bands, known as Atmospheric Rivers (ARs) are long (thousands of kilometers) and narrow (hundreds of kilometers) corridors.47 When the moisture of the ARs interact with cold fronts in Baja California Sur, produces precipitation with heavy isotope ratio due to incipient rainout. The interaction of moisture of an atmospheric river with a cold front, in January 2021, produced rains in the northwest of the Mexican Republic48 (Figure 8).
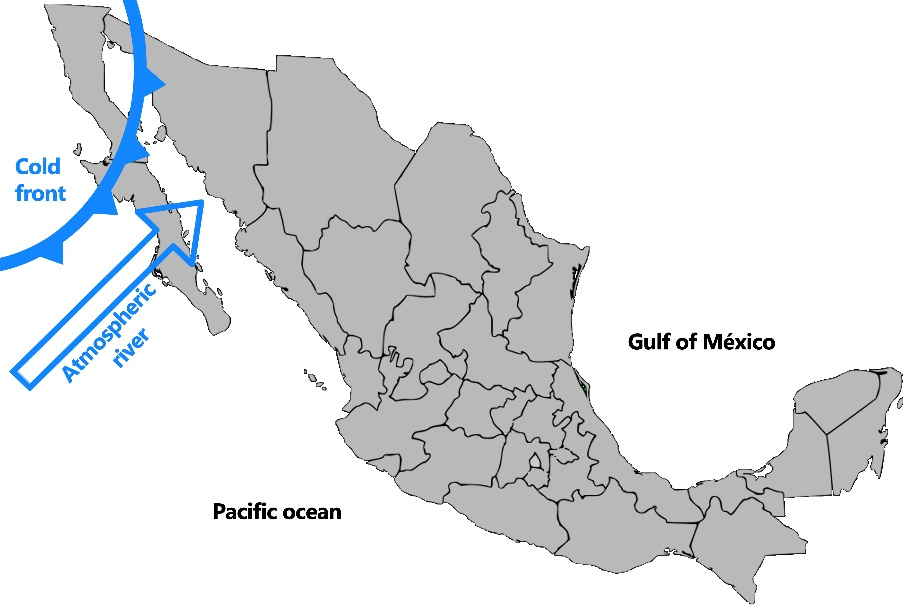
Figure 8 Weather systems on January 21, 2021 in Baja California Sur.48
Groundwater
Wassenaar49 and Eastoe50 determined the stable isotopes of oxygen and hydrogen of groundwater in various coastal aquifers of Baja California Sur (Todos Santos, Santiago, Plutarco Elías, Santa Rita and Santo Domingo). They found that coastal groundwater has depleted heavy isotopes, which is not common of aquifers close to the sea. Eastoe assumes it is because tropical cyclones are the main source of groundwater recharge. According to the data obtained in this study, the isotopic composition of tropical systems rain (cyclones, storms and depressions) is similar to the isotopic composition of coastal groundwater (Figure 9). This would indicate that tropical systems are the main source of recharge for the coastal aquifers of Baja California Sur, México.
This study presents the temporal characterization of stable isotopes in meteoric waters in the northwest of Mexico, during 2018 to 2021. In this arid region, with scarcity of long-term groundwater and precipitation monitoring, isotopic assessments could help to determine the origin, period, and areas of effective recharge of groundwater resources, which would be useful information for their sustainable use, protection, and administration. The results revealed a temporal pattern in the isotope composition of precipitation, with enriched isotopic composition during the winter season, and depleted during the cyclones season. Four hydroclimatic processes were identified as determining the local meteoric water line: tropical systems (cyclones, storms and depressions), atmospheric rivers, monsoon systems and cold fronts. Likewise, stable isotope data indicated that tropical cyclones are the main source of recharge for the coastal aquifers of Baja California, Sur. Climate models and observed trends suggest that warmed climate will drive latitudinal redistribution of precipitation, decreasing rainfall at subtropical latitudes.51,52,53 Information of the currently rainfall isotope data could be useful as a baseline to evaluate future changes of the precipitation and groundwater recharge.
The data used in this work were generated in the National Network of Isotopes in Precipitation in Mexico (RENIP), operated by the Mexican Institute of Water Technology, with the collaboration of the National Meteorological Service of CONAGUA, The Water System of Mexico City, and The International Atomic Energy Agency.
The authors declare that no conflict of interests is present in this study.

©2021 González-Hita, et al. This is an open access article distributed under the terms of the, which permits unrestricted use, distribution, and build upon your work non-commercially.