International Journal of
eISSN: 2576-4454


Short Communication Volume 2 Issue 6
Department of Civil Engineering and Environment, Ju
Correspondence: David Zu
Received: December 07, 2018 | Published: December 31, 2018
Citation: león DZ. Hydrogeological characterization of the perennial spring “El Pozito” Northeast of the Juárez city mountain, Chihuahua, México. Int J Hydro. 2018;2(6):737-742. DOI: 10.15406/ijh.2018.02.00151
"El Pozito" spring has been the source of consumption during 50 years by nearby communities of Juárez city, so it can be said that it is perennial. Therefore, two main aims justify the present research. Firstly; Its Physical-Chemical Characterization and Secondly, their hydrological behavior. First, two water samples were obtained, transported and analyzed in the Environmental Laboratory of the UACJ. One of them, was analyzed on April (P18-073) and the other on July of 2018 (P18-145). The results were;
Which indicates that it is water with a high risk of salinization and a medium adsorption ratio, on the other hand, the sample P18-145 corresponds to the group C2-S2, showing a high risk of salinization and a medium adsorption ratio? Second, regarded to hydrological behavior, it can be seen that: evapotranspiration were higher than rainfall, so evapotranspiration influenced the discharge of the spring during the period from April to September. The discharge observed and the rainfall and temperatures were recorded (Table 1). Summarizing, the physical and chemical water characterization is associated with the rocks predominately limestone while the hydrological behavior is a consequence of arid climate.
Keywords: Spring, Perennial, Hydrogeological, Characterization, discharge, precipitation
The research aims are to assess water quality as well hydrogeological behavior of “El Pozito” spring. Therefore, Geological settings and quality water characterization models were performed. Geological settings were a key to understand the water origin as well its flow path: Traditional model such as: Physical-Chemical models of Piper; Total Solids Dissolved to assess; Hardness, Salinity and (SAR) Index for Agricultural purposes. Also, the hydrogeological behavior was assessed using the hydric balance between water discharge and hydrological cycle parameters such as: Rainfall, Temperature, True Evapotranspiration and discharge.
Study area location and main features
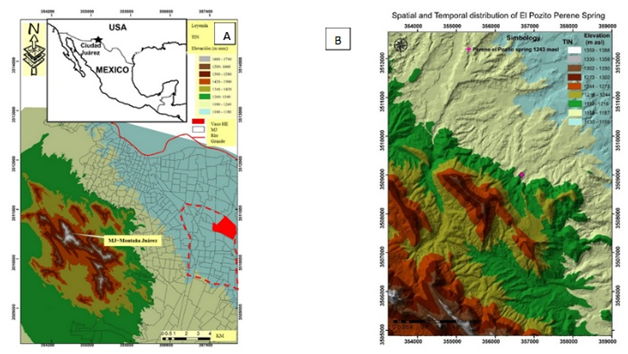
Ciudad Juárez, Chihuahua, northern México, is the southern continuation of New México and El Paso Texas. Its landscape is permeated by late Tertiary-Quaternary soils from southern USA to northern México (Figure 1A) Moreover, in a desert climate, there are few rainfall events mostly of high intensity and short duration, in average rainfall in the city is nearly 254 mm by year. Finally, El Pozito spring is located Northeast of Juárez Mountains (Figure 1).
Geological map, structural sections and climatic settings of the study area
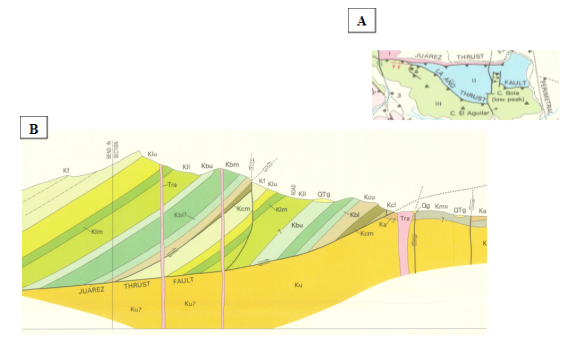
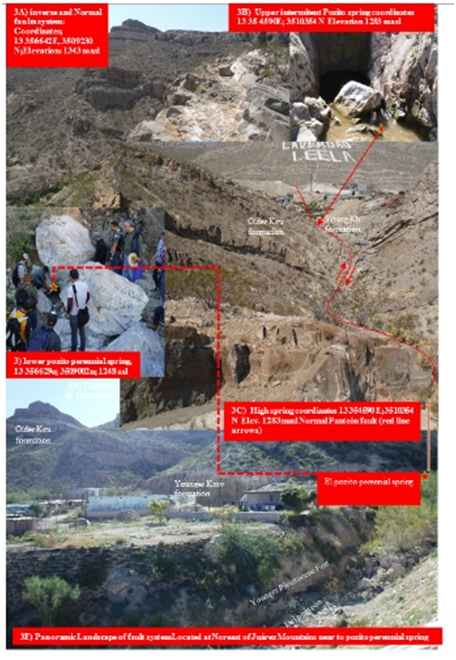
The Pre-Neogene landscape in the region began from Laramide Orogeny occurring during Paleocene to Eocene time. Then, a synclinorioum emerged. After that, four thrust sheets oriented slightly towards NW were developed in the study area (Figure 2A). Later, during the Eocene to Oligocene time, intrusive rocks, extrusive lavas, reverse, normal and oblique faults of the Basin and Range physiographic province were developed. Finally, these previous events were associated with block rotation throughout Chihuahua State, Juárez city, New México and El Paso Texas,1 (Figure 2). Furthermore, during Miocene to Pleistocene time volcanism produced volcanic-ashes and mudflows. The geological map (Figure 2) was derived from Drewes & Dryer1 and adapted with fieldwork to verify contacts between formations as; lithologies, structures, intrusive and extrusive rocks. Rock formations were grouped from older to younger as: (Kc=cuchillo, Kbe=Benigno, Kl=Lagrima, Kf=Finlay, Ksf=Supra Finlay and Tra=tertiary rhyolite and andesitic dikes. However, for simplicity’s sake, a subgroup (Kdn=Del norte, Ka=Anapra, Kmv=Mesilla valley, Ksm=Smeltertown, Kmu=Muleros, Kdr=Del rio, Kbo=Boquillas and Tf=Tertiary felsite named Supra-Finlay (Ksf) was added. Also, Oligocene to Miocene (30-12 ma) and Miocene to Pliocene (12-5 ma) as well as the Upper Santa Fe Group from Pleistocene to Holocene time. In order to illustrate water source of el “Pozito spring” a sequence of figures are presented (Figure 3D & Figure 3E). Located on the Basin and Range geological province (Figure 2A), The Panteón stream normal fault (Figure 3C) is a key to understand the water source of el Pozito perennial spring. Moreover, there are an upper outcropping springs near a volcanic andesite dike with carbonaceous shale of Mesilla Valley formation (Kmv) in contact with Limestones of Benigno Formation (Kb).Therefore, a normal fault is located in these two locations (Figure 3D & Figure 3E). Summarizing, a future research related to the present is to assess the origin of “Ël Pozito Perennial spring”. Then, models to find the trajectory of the underground water flow lines will be needed.

Figure 1 (A) Location of the study area: Digital elevation model (see legend on the upper right map); Streets network (gray lines) BravRiver also named (Rio Grande) red color line. UTM datum WGS 1984; (B) El Pozito Perennial spring (Magenta cross elevation 1243 masl (simbology masl) red line El Panteón perennial stream.

Figure 2 (A) Plant view of the northeast Juárez Mountain were two geological provinces were presented. Two nappes from older to younger: Juárez thrust (Kmv) in contact with (Kcu) and the año thrust fault (Kf) in contact with (Kcu) oriented nearly NW. (B) Sequence of normal faults of Basin and Range geological province nearly orthogonal to the napples. Geological cross section on the Panteon Stream indicated in Figure 2C. Source: Drewes & Dryer (1993).

Figure 3 Chronological sequences of pictures related to El Pozito perennial spring. (A) nappes inverse low angle thrust oriented NW. and normal faults of the Basin and Range geological province; (B) Upper intermittent spring, (E) Lower El Pozito perennial sping.
Hidrogeological results
Firstly, Turc model were used to assess Evapotranspiration. Then, annual rainfall (104.85mm) and average temperature (25ᵒC) were obtained (Table 1) from historical dates of regional meteorological stations from 10/2017 to 10/2018. Therefore using Turc model; True Evapotranspiration were (109.21 mm) Figure 4.
|
Temperature (ºC) |
Rainfall (mm) |
Date |
|
||
|
max |
mean |
min. |
monthly |
|
|
|
32 |
27 |
22 |
0 |
10/2017 |
|
|
26 |
20 |
13 |
11.43 |
11/2017 |
|
|
21 |
15 |
10 |
31.75 |
12/2017 |
|
|
20 |
15 |
10 |
0 |
01/2018 |
|
|
31 |
26 |
21 |
0 |
02/2018 |
|
|
30 |
22 |
15 |
6.35 |
03/2018 |
|
|
32 |
25 |
20 |
0 |
04/2018 |
|
|
36 |
31 |
26 |
0 |
05/2018 |
|
|
40 |
33 |
27 |
13.46 |
06/2018 |
|
|
40 |
32 |
27 |
16.56 |
07/2018 |
|
|
36 |
31 |
26 |
14.97 |
08/2018 |
|
|
35 |
30 |
22 |
10.33 |
09/2018 |
|
Table 1 Monthly rainfall and temperatures
Spring discharge results
Result was measured from (12/04/2018 to 28/09/2018).Then, the behavior response is shown (Table 2).
|
Day |
Hour |
Time (10 L) |
Filled (10L/min) |
Volume (10L/min) |
|
12/04/18 |
16:15 |
2.0066 |
12.0396 |
4.98 |
|
16/04/18 |
12:49 |
2.0144 |
12.0864 |
4.96 |
|
24/04/18 |
12:32 |
2.0504 |
12.3024 |
4.88 |
|
06/05/18 |
12:36 |
2.0679 |
12.4074 |
4.84 |
|
14/05/18 |
15:24 |
2.1072 |
12.6432 |
4.75 |
|
22/05/18 |
19:24 |
2.1091 |
12.6546 |
4.74 |
|
28/05/18 |
19:33 |
2.1052 |
12.6312 |
4.75 |
|
04/06/18 |
17:33 |
2.2144 |
13.2864 |
4.52 |
|
19/06/18 |
12:45 |
2.3622 |
14.1732 |
4.23 |
|
24/06/18 |
19:19 |
2.3346 |
14.0076 |
4.28 |
|
30/06/18 |
14:35 |
2.4135 |
14.481 |
4.14 |
|
15/07/18 |
15:44 |
2.1389 |
12.8334 |
4.68 |
|
21/07/18 |
18:05 |
2.0348 |
12.2088 |
4.91 |
|
05/08/18 |
12:48 |
2.1309 |
12.7854 |
4.69 |
|
11/08/18 |
08:24 |
2.0899 |
12.5394 |
4.78 |
|
18/08/18 |
16:26 |
2.0563 |
12.3378 |
4.86 |
|
25/08/18 |
19:07 |
2.0828 |
12.4968 |
4.80 |
|
03/08/18 |
17:03 |
2.0732 |
12.4392 |
4.82 |
|
08/09/18 |
13:40 |
2.0687 |
12.4122 |
4.83 |
|
16/09/18 |
12:02 |
2.0009 |
12.0054 |
5.00 |
|
22/09/18 |
13:25 |
2.0103 |
12.0618 |
4.97 |
|
28/09/18 |
17:21 |
2.0002 |
12.0012 |
5.00 |
|
28/10/18 |
18:18 |
0.5744 |
5.744 |
10.45 |
|
11/11/18 |
12:31 |
0.5082 |
5.082 |
11.81 |
Table 2 Spring Discharge filling time of a10 liters deposit
Water quality results
Water samples were carried out in the Environmental Engineering Laboratory UACJ to obtain the values of Physical and Chemical parameters. The results obtained are shown in Table 3. Corresponding to the month of April and July consecutively. Then in order to asses Piper water Characteization translate to Meq/l was required (Table 3 & Table 4).
|
Sample P18-073 |
|||||||
|
|
Analyzed ions |
Concentration Mg/L |
Molecular weight |
Equivalent number |
Concentration (meq/l) |
Concentration |
|
|
|
% |
max |
|||||
|
Cations |
Calcium (Ca2+) |
194 |
40 |
2 |
9.70 |
73.37 |
|
|
Magnesium (Mg²⁺) |
14.9 |
24.31 |
2 |
1.23 |
9.27 |
||
|
Sodium (Na⁺) |
49.96 |
23 |
1 |
2.17 |
16.43 |
200 |
|
|
Potassium (K⁺) |
4.8 |
39 |
1 |
0.12 |
0.93 |
||
|
|
|
|
|
Total |
13.22 |
100 |
|
|
Aniones |
Sulfhates (SO4-2) |
90 |
48 |
1 |
1.88 |
27.00 |
400 |
|
Chlorides (Cl-1) |
46 |
35.5 |
1 |
1.30 |
18.66 |
250 |
|
|
Nitrates |
2.23 |
62 |
1 |
0.04 |
0.52 |
||
|
Alcalinity (HCO3-) |
228 |
61 |
1 |
3.74 |
53.82 |
||
|
|
|
Total |
6.94 |
100.00 |
|||
|
Muestra P18-145 |
|
|
|
|
|
|
|
|
|
Analyzed ions |
Concentration Mg/L |
Molecular weight |
Equivalent number |
Concentration (meq/l) |
Concentration |
|
|
|
% |
max |
|||||
|
Cations |
Calcium (Ca2+ ) |
206 |
40 |
2 |
10.30 |
76.34 |
|
|
Magnesium (Mg²⁺) |
14.9 |
24.31 |
2 |
1.23 |
9.09 |
||
|
Sodium (Na⁺) |
42.4 |
23 |
1 |
1.84 |
13.66 |
200 |
|
|
Potassium (K⁺) |
4.8 |
39 |
1 |
0.12 |
0.91 |
||
|
|
|
Total |
13.49 |
100.00 |
|||
|
Anions |
Sulfates (SO4-2) |
85.4 |
48 |
1 |
1.78 |
21.34 |
400 |
|
Chlorides (Cl-) |
95 |
35.5 |
1 |
2.68 |
32.09 |
250 |
|
|
Nitrates |
1.92 |
62 |
1 |
0.03 |
0.37 |
||
|
Alcalinity (HCO3-) |
235 |
61 |
1 |
3.85 |
46.20 |
||
|
|
|
|
|
Total |
8.34 |
100.00 |
|
Table 3 Shown results of analyzes performed on water samples source: (UACJ)
|
Parameter |
ID P18-073 |
ID P18045 |
Max. value |
|
Alcalinity (mg/L CaCO₃) |
228 |
235 |
|
|
Electric conductivity (μs/cm) |
830 |
461 |
|
|
Total hardness (mg/L CaCO₃) |
288 |
298 |
500 |
|
Solids dissolved (mg/L) |
459 |
460 |
1000 |
|
Chlorides (mg/L) |
46 |
95 |
250 |
|
Nitrates (mg/L) |
2,23 |
1,92 |
10 |
|
pH |
7,75 |
8,06 |
6.5-8.5 |
|
Sulphates (mg/L) |
90 |
85,4 |
400 |
|
Magnesium (mg/L) |
<0,05 |
<0,05 |
|
|
Calcium (mg/L) |
194 |
206 |
|
|
Potassium (mg/L) |
<4,80 |
<4,80 |
|
|
Sodium (mg/L) |
49,96 |
42.4 |
200 |
Table 4 Laboratory parameters of two samples
Chemical quality for human use is good according to results given by Piper model.2 However, According, with the comments in previous paragraphs, it is possible to typify the water taking into account the given on Table 5 & Table 6. Summarizing, we have that the sample P18-073 is classified in the (group 6e c2) and sample P18-145 was classified as (group 5e c2) Sulphated water. In addition, In order to express salinity, it will be measured through the Electrical Conductivity test, which according to Table 6 shows four degrees of salinity risk with the different types of water according to the electrical conductivity at 25ºC. In report shown in Table 4, it is observed that the variation of the total dissolved solids (TSD) in both samples is only 1 mg/l. This means that the presence of these concentrations of solids, whether they are suspended or dissolved in the water, cause physiological reactions harmful to humans. In this aspect, Davis & De Wiest,1 and Wergner.3 Classify water based on the distribution of dissolved solids. (Table 7) Classification according to the total dissolved solids. Summarizing, the type of water was classified according to the ranges in Table 7. In the case of this project, both samples are included in the Sweet water group Custodio & Llamas.4 Classify water according to its hardness range, that is, the content of calcium carbonates (CaCO3). Therefore, in this research only the degree of hardness in the samples was made. It was determined that in both cases the water is classified in the very hard group since it exceeds 180 mg/l of CaCO3 (Table 8). Water interacts with minerals from rocks and soils. Then, salt dissolution is acquired as: Na; Ca and Mg. This, it is the case, of the area of the spring. (SAR index) that takes into account the concentration of soluble salts and is expressed by means of electrical conductivity and sodium concentration with respect to the concentration of calcium and magnesium (See equation 6). Results of electrical conductivity and concentrations are expressed in meq/L, which are indicated in Table 9. Finally, (Figure 5) shows irrigation water according to the Salinity Laboratory Staff4 and SAR index for spring water (see equation1). Concentrations are expressed in meq/L.
|
Type |
Anions |
|
Cations |
|
1 |
rCl->rSO-24>rHCO-3 |
a |
rNa+>rMg+2>rCa+2 |
|
2 |
rCl->rHCO-3> rSO-24 |
b |
rNa+> rCa+2 >rMg+2 |
|
3 |
rSO-24>rCl-> rHCO-3 |
c |
rMg+2 >rNa+> rCa+2 |
|
4 |
rSO-24> rHCO-3>rCl- |
d |
rMg+2>rCa+2>rNa+ |
|
5 |
rHCO-3>rCl- >rSO-24 |
e |
rCa+2>rNa+ >rMg+2 |
|
6 |
rHCO-3>rSO24>rCl- |
f |
rCa+2> rMg+2>rNa+ |
Table 5 Results of types of water
|
Type |
C.E. a 25ºC en (μ mhos/cm) |
|
C1 |
0-250 |
|
C2 |
250-750 |
|
C3 |
750-2250 |
|
C4 |
>2250 |
Table 6 Salinity in terms of electrical conductivity
|
Classification |
TSD in parts per milion |
|
Sweet water |
0-1000 |
|
Brackish water |
1000-10000 |
|
Saltwater |
10000-100000 |
Table 7 Water characterization of TSD
|
Description |
Hardness |
|
Soft |
0 a 60 mg/l de CaCO3 |
|
Moderately hard |
61 a 120 mg/l de CaCO3 |
|
hard |
121 a 180 mg/lt de CaCO3 |
|
Very hard |
Más de 180 mg/l de CaCO3 |
Table 8 Classification in agree with hardness
|
Sample |
|
C.E. (μ mhos/cm) |
SAR (meq/l) |
|
P18-073 |
830 |
0.929 |
|
|
P18-145 |
461 |
|
0.768 |
Table 9 SAR index and C.E
None.
The author declares that there is no conflict of interest.

©2018 león, et al. This is an open access article distributed under the terms of the, which permits unrestricted use, distribution, and build upon your work non-commercially.