International Journal of
eISSN: 2576-4454


Research Article Volume 3 Issue 5
Department of Soil, Water and Climate, University of Minnesota, USA
Correspondence: Andry Z Ranaivoson, Department of Soil, Water and Climate, University of Minnesota, Saint Paul, USA, Tel 507-752-5078
Received: August 31, 2019 | Published: September 26, 2019
Citation: Ranaivoson AZ, Moncrief JF. Gravel inlet hydrology and trends of contaminant concentration and loading. Int J Hydro. 2019;3(5):376-388. DOI: 10.15406/ijh.2019.03.00203
In Le Sueur County, Minnesota, the hydrology of a gravel inlet system was explored using curves of water height, surface velocity, rainfall rate for major rainfall events in 2002. The stage-discharge relationship of the gravel inlet was presented based on water height and discharge rate measured in the field. Three types of flow were identified in the gravel inlet system: ponded, edge, and sidewall. The first type of flow dominated in most of rainfall events. This location had a surface inlet system before being converted to a gravel inlet system. The difference of flow capacity between the two systems was evaluated with average flow rate from two similar events in June of 1998 and June of 2002. The flow system of the surrounding area influenced the flow capacity more than the equipment field setup for either surface or gravel inlet by generating back-pressure in the outlet pipe. Contaminant loadings were examined by monitoring their above and below gravel concentrations. The gravel inlet reduced to some extent the concentrations of total solids, chemical oxygen demand, particulate phosphorus, and total phosphorus. Trapping efficiency of the gravel inlet ranged from 14% to 32% with respect to previously listed contaminants. Concentration of soluble contaminants such as soluble phosphorus and nitrate increased over the duration of each rainfall event. Ponding of water in the depression played a major role in releasing soluble phosphorus via oxygen depletion and decreased redox potential. Nitrate concentration increased significantly toward the end of one rainfall event. An estimation of gravel longevity was attempted based on the assumed uniform deposition of total solids over the void volume in the gravel trench and on the quantity of total solids deposited. The gravel matrix was filled with sediment at 28% compared to its initial void volume following the rainfall events of summer 2002.
Keywords: gravel inlet, blind inlet, surface inlet, flow types, back-pressure, pollutant loading, soluble and particulate contaminant, deposition, trapping efficiency
Drainage in the Midwest is important for profitable crop production. Minnesota is the number one state for wet soil area in the continental US. On a large acreage of Minnesota agricultural land drainage is the first land improvement option for crop production. On Minnesota “prairie pothole” landscapes it is necessary to have surface tile inlets to remove water rapidly enough (usually less than 24hrs.) to minimize plant stress. The challenge is to get rid of excess water without contributing excessive pollutants to rivers and lakes. Currently, a large number of surface inlets exist in the Minnesota River Basin. With surface inlets, contaminants such as solids, nutrients, and oxygen demanding materials make a direct entry in the tile drainage system. Gravel inlets, also called blind inlets, have been proposed as a tool to reduce the amount of pollutants that enter those inlets. The principle of replacing surface inlet with gravel inlet stems from the expectation that if the latter can filter runoff suspension going into the drainage system, an additional benefit would be achieved with respect to environmental impact by reducing loads of sediment, nutrient, and pesticides.1,2 Some authors have also assessed blind inlet impacts on herbicides.3,4 Hundreds of surface inlets have already been converted to gravel inlets in Minnesota.5
From an agronomic point of view, ponded water on a planted area poses a threat to crop growth. Moreover, precipitation can be substantial in this part on the state and flooding conditions may last for several days. The oxygen supply in the soil is depleted after about 48hours in a flooded soil; in some cases, oxygen can be used up in matter of hours.6 without oxygen, major metabolic functions in the plant are impaired such as nutrient uptake and root growth. Flooding may have a long-term negative impact on crop performance.
Next, ponded water works as a sedimentation basin and allows significant infiltration to occur. Overland flow comes in contact with and erodes soil particles, plant residue, and any chemicals applied to the ground. The flow eventually accumulates in the depression to form a temporary water body in the landscape.
Finally, the ponding water alters the dynamics of chemical contaminants due mostly to its decreased oxygen content and low redox potential. A sequence of reactions of chemical redox pairs and associated oxygen depletion can be established under water ponding conditions. Other factors contribute to change pollutant fate entering the pond including soil concentration of the same pollutants, pH of overlying water and soil, and temperature. Two major pollutants, nitrogen and phosphorus, are influenced by physico-chemical processes in the pond. Diffusion of oxygen under flooded condition is much slower than in well-aerated soil by several orders of magnitude.7 Furthermore, oxygen depletion occurs in less than a few hours in such pond as stated previously.
In summary, ponding of water in landscape depressions fulfill several functions such as settling of soil particles, decrease of nitrate concentration, and increased flux of soluble phosphorus concentration in the water column are among the most important. The first two functions can be beneficial from an environmental standpoint while the third one poses a threat to drainage water quality. The following exposition will focus on the Le Sueur site where rainfall events occurred with collection of samples pertinent to filtration study.
Locations and field operations
The gravel inlet experiment location was in LeSueur County, West of New Prague, at the corner of Minnesota Highway 19 and Lesueur County Highway 30. One pothole-shaped watershed of 6.0ha in size was drained by a gravel inlet (Gravel Inlet 3, Figure 1). Soil series in the depressions are mainly LeSueur clay loam, Cordova silty clay loam, and Glencoe clay loam. The second inlet at this site is open (Surface Inlet 4, Figure 1). Both inlets have 3-5years of existing data characterizing the flow through of water and delivery of contaminants. Field operations for 2002 were conducted during the first week of April and included the following: (1) application of liquid ammonium at 151kg/ha, (2) fertilizer N-P-K (9-23-30) (336kg ha-1) and (3) cultivation and planting. N-P-K was a one-time application for that year; there was no addition of N-P-K fertilizer in previous years. Field tillage for this site was fall chisel plow following corn and field cultivation (double disc) in the spring following soybean. Corn yield was 6,870kg ha-1 despite some serious damages to the crop due to wind lodging and water ponding.
Instrumentation
The field set up consisted of a gravel pit connected to an “in-ground” enclosure containing the flow sensors and “grab sampler” line (Figure 2). The gravel pit size was 1m (width) x 4m (length) x 1.2m (depth). It was filled with gravel size between 0.6cm to 2.0cm in diameter. A 12.7cm-diameter corrugated pipe with three 2cm-perforations spaced 15cm apart underlies the gravel trench over its length. One aim of the experiment is to be able to measure flow and concentration of chemicals and sediment “above and below” the gravel inlet. These data will allow comparison of the filtration capacity of the gravel inlet. Water height and velocity monitoring with several sensors complete the water flow measurement. Chemical and sediment concentration were measured through water sample collection at set time intervals and laboratory measurement for the elements of interest.
The enclosure houses the equipment, which includes:
At the main sensor pipe, a 21-cm diameter PVC pipe runs from the gravel inlet muck pipe to the ISCO area velocity flow rate sensor. The area velocity sensor is connected to an ISCO 4150 data flow logger. The flume and impeller sensors are connected to a Campbell Scientific data logger, 21X or CR23X. The Campbell Scientific data logger monitors two other water height measurements; one is the water height in the gravel pit below ground level and another measure the water height above ground level. Water height measurements are made using a system with nitrogen gas bubbling out of a pipe placed at the low point of that measurement. The pressure to push the bubble from the pipe is a function of the water height and is measured by a pressure transmitter. The Campbell Scientific data logger queries the water heights and will prompt one of the two ISCO samplers, model 3700 or 6700, when it is time to collect water sample. One sampler unit collects samples from the subsurface pipe while the other obtains samples from the ground surface.
Water chemical analysis
A water quality laboratory runs analysis of total solids, biochemical oxygen demand (BOD), chemical oxygen demand (COD), soluble Phosphorus (P), particulate P, bioavailable P, and total P. Total solids, which include particulate and dissolved salts, are determined gravimetrically on sample aliquots evaporated to dryness at 105oC. Chemical oxygen demand is determined by delivering a 2.0mL sample aliquot to commercially prepared digestion vials (BioScience, accu-TEST COD, standard range twist cap vials), digesting for 2hours at 150oC, and reading the absorbance at 440nm on a spectrophotometer (Milton Roy Spectronic 20D). BOD is determined using incubation and a filter system, a procedure modified from the American Water works Association and from Water and Wastewater Examination Manual.8
Total P is determined using the molybdenum blue method following a complete nitric/perchloric acid digestion. Soluble P is tested with the molybdenum blue method on sample aliquots passed through a 0.45um filter (Millipore, Millex HA). Particulate P was determined as the difference between Total P concentrations and soluble P concentrations. Bioavailable P is measured with the Iron Oxide Extraction method with an aliquot poured through a filter impregnated with iron chloride, which binds phosphorus in the water sample. The P-laden filter is dipped into 5% ammonia hydroxide solution for P extraction with 16-hour shaking and spectrophotometer reading. Total dissolved inorganic nitrogen (N) and ammonium N concentrations are determined using the conductimetric method and nitrate was expressed as the difference between those two measurements.9,10
Soil analysis
The soil at Le Sueur site was sampled at a grid size of approximately 30mx30m at two depths, 0-7.5cm and 7.5–15.0cm. Four soil tests were run for the samples that included pH, organic matter (%), Bray phosphorus (ppm), and potassium (ppm). Test values at sampling points were extrapolated using the Kriging method using Surfer 7.0 software to cover the entire area. Soil pH ranged from 6.0 to 6.4. A major portion of the depression area had a soil pH of 6.2 except for the northern and southern portions (pH 6.0) and the part of the eastern area at pH 6.4. Average soil organic matter as percent of soil weight is 6.3%. The soil organic matter distribution forms typical concentric circles on the map with lower values on the higher elevation (5%) increasing to about three times higher (15%) toward the lowest point in the depression where the runoff sampling point is located. Average Soil Bray P concentration is 21.1mg/kg of soil. Soil phosphorus content shows a similar pattern to that of soil organic matter with increasing concentration toward the lowest elevation. Bray P test varies from 15 mg/kg of soil on higher elevations to 45 mg/kg of soil at the lowest elevation close to the runoff sampling point. The northern part of the depression has a spot of higher Bray P (45mg/kg of soil) test as well. Average Potassium content is 159mg/kg of soil. Trends of soil K are slightly different from soil organic matter and Bray P. There is an increased soil K concentration from higher area toward the lower area in the depression (135mg/kg of soil to 195mg/kg of soil); Overall, soil organic matter and Bray P showed a clear trend of accumulation toward the lowest elevation in the depression area. This distribution of soil concentration for those two tests will influence the runoff concentration and loading of nutrient for the rainfall event samples.
The contaminant loading analysis and estimate of total solids deposition are based on the rainfall events from the east gravel inlet in Le Sueur County. Large rainfall events occurred successively on four dates: June 21, August 3, August 21, and October 4, 2002. Two summary tables are put together for flow, loading, and concentration to account for the “complete” and “synchronous” records below gravel. Complete record considers all flow plus valid flow after the water pond has receded. Synchronous record, on the other hand, considers flow below the gravel period while water is still ponded at the surface of the gravel inlet; the record from this flow type is thus shorter than that the complete record. Difference of flow, loading, and concentration between these two records, complete and synchronous, represents altogether edge and sidewall flow values; these two types of flow are introduced in the next paragraph (Table 1). Edge and sidewall flow values could not be split since the former is not measurable at the surface of the gravel; sidewall path is another component of flow going through soil matrix before exiting at the gravel trench. In the remaining text, “synchronous” record is fit for studying filtration process while “complete” record is used to compute total loading and concentrations from below the gravel inlet.
Date |
Total solids (kg ha-1) |
Sol. P (g ha-1) |
Part. P (g ha-1) |
Total P (g ha-1) |
COD (kg ha-1) |
BOD (g ha-1) |
NH4-N (g ha-1) |
NO3-N (kg ha-1) |
21-Jun |
10.7 |
15.5 |
19.9 |
22.5 |
1.91 |
0.27 |
0.13 |
0.14 |
3-Aug |
0.54 |
0.65 |
0.75 |
1.41 |
0.13 |
0.0095 |
0.65 |
0.0046 |
4-Oct |
4.85 |
11.5 |
3.9 |
15.4 |
1.29 |
- |
3.12 |
0.089 |
Total |
16.1 |
27.7 |
24.5 |
39.4 |
3.34 |
0.28 |
3.9 |
0.24 |
Table 1 Contaminants loading difference between complete and synchronous record from below the gravel inlet trench, 2002. This difference is due to “edge” and “sidewall” flow before and after ponding. No difference was found for August 21 event as the record was all synchronous
Superficial velocity is a term chosen for the description of flow rate from filtration theory; it expresses the ratio of flow volume entering the gravel to the area of the gravel inlet per unit time.11 Units are usually m3/m2 per hour (m hr-1). Values of superficial velocity in deep filtration systems usually range between 5 and 20m hr-1 considered safe for effluent quality and economical for filtration operation in water treatment plant. All measured superficial velocities for the 2002 events fall in the 0.0 m hr-1 -10.0 m hr-1 range.
Edge and sidewall flow effects on cumulative flow and loading of contaminants
Due to the field set-up, three flow patterns are believed to be occurring within the rock inlet. At the start of an event, flow will occur at the edge of the rock mound; this kind is called “edge flow”. This flow process was observed in the field where continuous flow reading was obtained from the underground pipe without water ponding above the rock surface. The second type termed as “ponded flow” occurs when water ponding is present at a sufficient height for measurement and flow is occurring vertically through the rock inlet system into the main tile drains. This case is realized when rainfall or snowmelt rate is higher than the intake rate of the rock inlet, then ponding above the rock inlet will occur. This type of flow allows the comparison of pollutant concentrations “above” and “below” the rock inlet. The sampling is synchronous at the “top” and “bottom” locations and, under this case alone, is the evaluation of sediment and particulate deposition possible. The third type of flow refers to the “sidewall flow” or “lateral” flow. As the water ponding is receding, there is the possibility of having flow coming from the sidewalls of the rock inlet trench. This type of flow may stem from water-saturated soil in the vicinity of rock trench. The loading of contaminants to account for edge and sidewall flow was computed using flow below the rock inlet and based on the difference between “synchronous” and “complete” record. From the aspect of pollutant loading and flow, values associated with edge and sidewall represent on average less than 10% of annual amount (Table 2).
Events |
flow depth, cm |
Edge & sidewall flow depth, cm |
Edge & sidewall flow depth, % |
21-Jun |
4.58 |
0.37 |
8.00% |
3-Aug |
1.67 |
0.026 |
1.60% |
21-Aug |
1.89 |
0.078 |
4.10% |
4-Oct |
2.06 |
0.24 |
11.50% |
Annual |
10.2 |
0.71 |
6.90% |
Table 2 Proportion of “edge” and “sidewall” flow from annual flow below the gravel inlet
Rainfall events of 2002 summer
The June 21 rainfall event lasted several days starting after midnight until the morning of June 26 (Figure 3). This duration is based on both water ponding in the basin and flow in the corrugated pipe under the gravel inlet. Total rainfall was 8.97cm with a total runoff of 4.58cm (0.86 in cm/day) (Table 3). There were several bursts with rain intensity reaching 6.4cm hr-1at times. Peak water level reached 70cm in the first 12hours of the event. Water ponding lasted approximately 4days. Some “edge” and “sidewall” flow occurred toward the end of this event. Toward mid-day of June 25, water pond receded; however, a substantial amount of flow was still recorded below the gravel (0.4cm).

Figure 3 Water height and rainfall rate (A), superficial velocity and cumulative flow (B) for June 21, 2002 rainfall event. In the bottom figure, superficial velocity (or flow) responded to smaller rainfall bursts after 6/24/02. Date and time axis are the same for upper and lower figures.
Date start |
Date end |
Rainfall, cm |
Runoff, cm |
6/21/02 1:50 |
6/26/02 9:00 |
8.97 |
4.58 |
8/3/02 18:10 |
8/6/02 7:25 |
7.64 |
1.67 |
8/21/02 1:00 |
8/23/02 12:00 |
8.1 |
1.89 |
10/4/02 1:20 |
10/12/02 5:00 |
7.32 |
2.06 |
Total |
|
|
10.2 |
Table 3 Summary of rainfall and runoff at gravel inlet 3 at LeSueur County Site, Year 2002
The August 3, 2002 event had rainfall of 7.64cm with total runoff of 1.67cm (0.65cm/day) (Table 3). Rainfall came in on two consecutive bursts with intensity reaching 9.5cm hr-1 at the start of the event (Figures 4‒7). Water level was close to 40cm within the first 4hours of the event and ponding lasted for about 2days. Some edge and sidewall flow occurred toward the end of this event. The extended record of pollutant concentration beyond ponding period confirms the occurrence of edge and sidewall flow types.
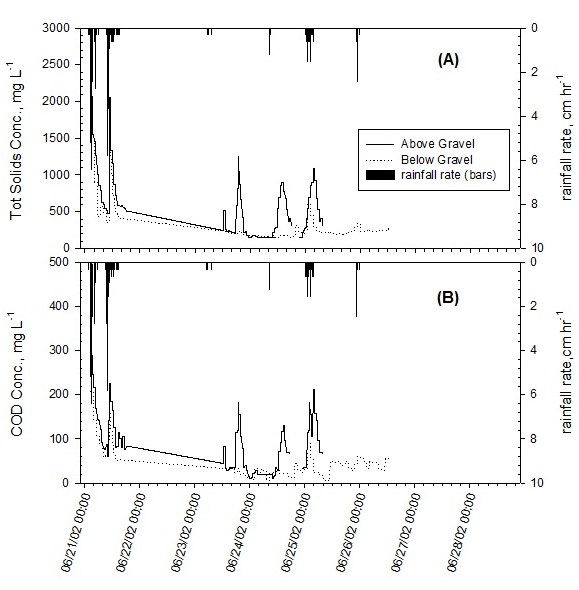
Figure 4 June 21, 2002 rainfall event: Total Solids concentrations (A) and COD (B) from above and below of gravel inlet water samples. Each contaminant has a different concentration scale.
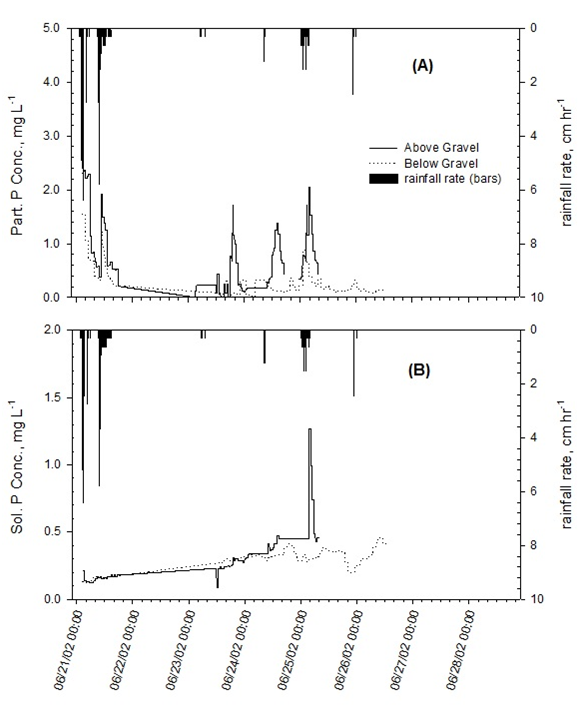
Figure 5 June 21, 2002 rainfall event: Concentrations of above and below gravel inlet samples for Particulate (A) and Soluble Phosphorus (B). Each pollutant has different concentration scale.
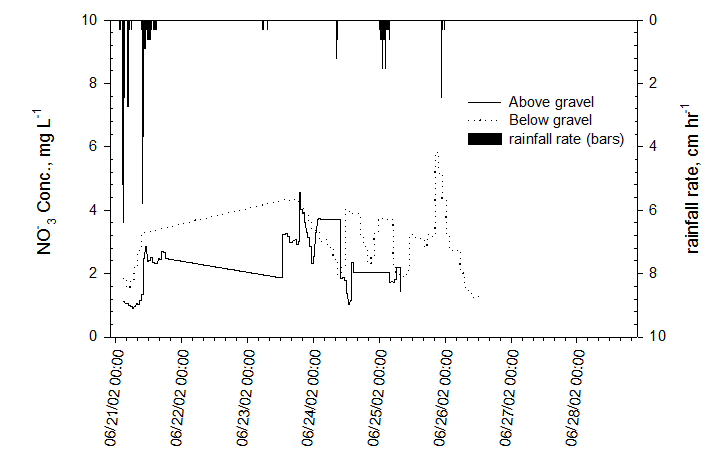
Figure 6 June 21, 2002 rainfall event: Nitrate concentrations of above and below gravel inlet samples.
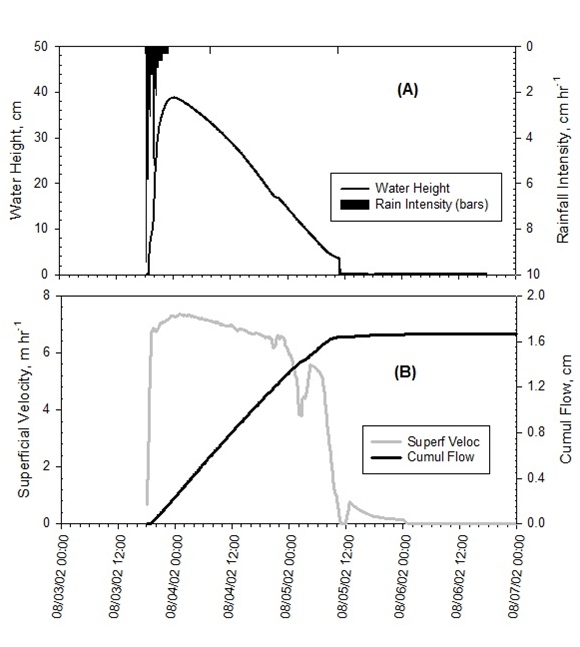
Figure 7 August 3, 2002 rainfall event: Water height and rainfall rate (top figure), superficial velocity and cumulative flow (bottom figure).
The August 21, 2002 event had a rainfall of 8.10cm with a total runoff of 1.89cm (0.77cm/day) (Table 3). The event was triggered by two rainfall bursts that generated two distinct peaks of water height. The first water height peak (12cm) occurred within 2hours from the start of the event while the second peak (37cm) happened about 12hours later (Figures 8‒11). Maximum rainfall intensity reached 5.4cm hr-1. Toward the end of this event, flow continued to occur below the gravel while ponding had already receded. The concentration record, however, was discontinued automatically as the sampler carrousel was full and the samples were picked up at a later date than the end of the event. This is shown in the concentration graphs where sampling stopped on August 22 at around 11:00am. Flow record, however, continued until August 23 at noon.

Figure 8 August 3, 2002 rainfall event: Concentrations of above and below gravel inlet samples for Total Solids (A) and COD (B). Superficial velocity was graphed with concentration of contaminants for this event since rainfall occurred at the beginning only. Each contaminant has a different concentration scale.

Figure 9 August 3, 2002 rainfall event: Concentrations of above and below gravel inlet samples for Particulate (A) and Soluble (B) Phosphorus. Each pollutant has a different concentration scale.

Figure 10 August 3, 2002 rainfall event: above and below gravel inlet samples for nitrate concentration.

Figure 11 August 21, 2002 rainfall event: Water height and rainfall rate (A), superficial velocity and cumulative flow (B).
The October 4, 2002 event had a rainfall of 7.32cm with a total runoff of 2.06cm (0.25cm/day) (Table 3). During the first burst of rainfall, the water did not pond but flowed directly into the gravel inlet. This is shown in the superficial velocity (two distinct peaks) and cumulative runoff curve (Figures 12‒15). Sampling at the surface of the gravel did not start until the second burst of rainfall. The two rainfall bursts were separated by 36 hours. This event showed some evidences of “edge” flow early in the event in contrast to the previous summer events. The first rainfall burst occurred on October 4 around midnight and flow record started and went on for 42hours until the next rainfall burst. Edge flow occurred during the first 22hours following the first rainfall burst. Ponding occurred following the second burst of rainfall and lasted for two days. Flow (as “edge” and “sidewall” types) continued for about 48 hours after the end of water ponding.
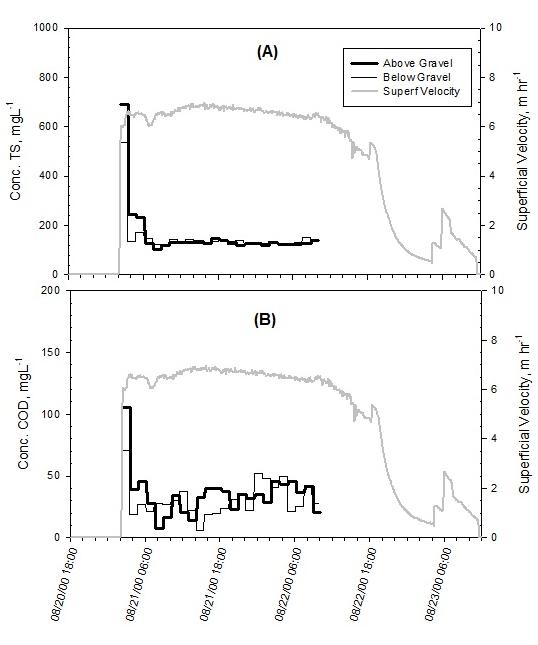
Figure 12 August 21, 2002 rainfall event: Concentrations of above and below gravel inlet samples for Total Solids (A) and COD (B). The concentration axis has different scale for each pollutant.
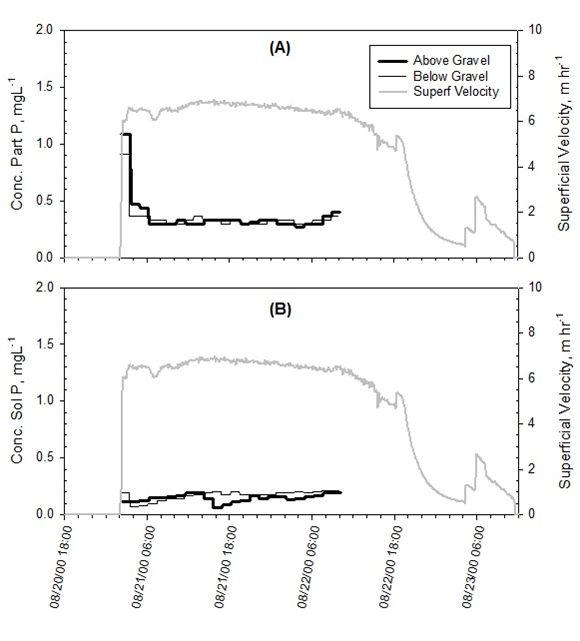
Figure 13 August 21, 2002 rainfall event: Concentrations of above and below gravel inlet samples for Particulate (A) and Soluble (B) phosphorus.
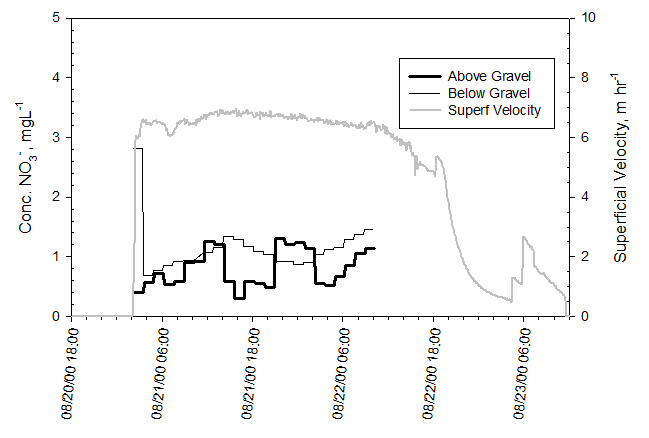
Figure 14 August 21, 2002 rainfall event: Nitrate concentration from above and below gravel inlet samples.

Figure 15 October 4, 2002 rainfall event: Water height and rainfall rate (A), superficial velocity and cumulative flow (B). This particular event showed an early rainfall burst (10/04/02, 0:00) for which ponding did not occur. Flow for this early period is considered either of edge or sidewall type.
Rainfall amount for the summer 2002 was among the highest in the last 30-year record with respect to the site location and normal values at Jordan Station, 8 miles north of Le Sueur Site. The months of June, July, August, and October had an excess rainfall of more than 6.0 cm compared to normal monthly values. The LeSueur County gravel inlet site had an accumulated annual runoff of 10.2 cm for 2002 over four large rainfall events. The proportion of runoff from rainfall for each of these events are 51%, 22%, 23%, and 28% for June 21, August 3, August 21, and October 4, respectively.
Total solids loading and concentration
Annual loading of total solids was 295kg ha-1 “above the gravel” inlet (Table 4) while that of “below the gravel” was 227kg ha-1 based on the complete record (Tables 5&6) and 211kg ha-1 with the synchronous record (Tables 7&8). The first event (June 21) had the most flow and the highest pollutant losses due to the timing when canopy cover was partial (corn height 70cm). Residue cover from the previous soybean crop did not offer much soil protection from rainfall impact. Later in the season, crop canopy was established and reduced to a certain extent the erosive power of raindrop impact for the subsequent events (August 3 and 21). While the rainfall amounts were close for the three events, August 3 and 21 events had approximately a tenth of sediment loss compared to that of June 21 (Table 4). Annual flow-weighted average concentration was 238 mg/L from “above the gravel” against 183mg/L from “below the gravel” (Table 5). The actual concentration of total solids varied between 2,064mg/L and 92mg/L over the four summer events. Concentrations of total solids at both sampling locations (“above and below gravel”) responded to peak rainfall intensity and decrease rather sharply following the peak concentration period. Past the rainfall peak intensity and during the ponding, total solids concentrations would be below 500 mg/L. It appears that high concentrations of total solids were correlated to large rainfall amounts that have enough energy to transport suspended particles to the sampling point in the system.
Date |
Total solids (kg ha-1) |
Sol. P (g ha-1) |
Part. P (g ha-1) |
Total p (g ha-1) |
COD (kg ha-1) |
BOD (g ha-1) |
Nh4-N (g ha-1) |
NO3-N (kg ha-1) |
21-Jun |
208 |
103 |
197 |
287 |
32.6 |
1.71 |
38.4 |
0.94 |
3-Aug |
28.8 |
25.5 |
36.1 |
61.6 |
7.6 |
0.69 |
37.4 |
0.14 |
21-Aug |
22.2 |
20.1 |
29 |
49.1 |
4.86 |
- |
- |
0.11 |
4-Oct |
35.9 |
65.6 |
37.5 |
103 |
9.31 |
1.39 |
7.97 |
0.23 |
Total |
295 |
215 |
299 |
501 |
55.3 |
- |
- * |
1.42 |
Table 4 Loading of contaminants above the gravel inlet, Year 2002
* = The sum of NH4-N annual loading is 83.8 g ha-1 without the August 21 value.
Date |
Total solids (mg l-1) |
Sol. P (mg l-1) |
Part. P (mg l-1) |
Total p (mg l-1) |
COD (mg l-1) |
BOD (mg l-1) |
NH4-N (mg l-1) |
NO3-N (mg l-1) |
21-Jun |
454 |
0.23 |
0.43 |
0.63 |
71.2 |
3.74 |
0.084 |
2.06 |
3-Aug |
173 |
0.15 |
0.22 |
0.37 |
45.6 |
4.14 |
0.22 |
0.82 |
21-Aug |
117 |
0.11 |
0.15 |
0.26 |
31 |
- |
- |
0.59 |
4-Oct |
208 |
0.38 |
0.22 |
0.6 |
53.9 |
8.06 |
0.046 |
1.34 |
Average |
238 |
0.22 |
0.25 |
0.46 |
50.4 |
- |
- |
1.2 |
Table 5 Contaminant flow-weighted concentration average above the gravel inlet, Year 2002
Date |
Total solids (kg ha-1) |
Sol. P (g ha-1) |
Part. P (g ha-1) |
Total p (g ha-1) |
COD (kg ha-1) |
BOD (g ha-1) |
NH4-N (g ha-1) |
NO3-N (kg ha-1) |
21-Jun |
153 |
114 |
102 |
216 |
20.7 |
1.82 |
47 |
1.59 |
3-Aug |
22.1 |
29.1 |
29.8 |
59 |
5.89 |
0.49 |
36.4 |
0.18 |
21-Aug |
20.4 |
23.4 |
23.5 |
46.9 |
7.06 |
- |
10.4 |
0.15 |
4-Oct |
31.9 |
76.3 |
29.9 |
106 |
8.55 |
- |
23.5 |
0.42 |
Total |
227 |
243 |
185 |
428 |
42.2 |
- |
117 |
2.34 |
Table 6 Loading of Contaminants below the gravel inlet, Year 2002 (complete record)
The summation of NH4-N loading is 107 g ha-1 without August 21 value.
Date |
Total solids (mg l-1) |
Sol. P (mg l-1) |
Part. P (mg l-1) |
Total p (mg l-1) |
COD (mg l-1) |
BOD (mg l-1) |
NH4-N (mg l-1) |
NO3-N (mg l-1) |
21-Jun |
334 |
0.25 |
0.22 |
0.47 |
45.3 |
3.98 |
0.1 |
3.47 |
3-Aug |
133 |
0.17 |
0.18 |
0.35 |
35.4 |
2.95 |
0.22 |
1.07 |
21-Aug |
108 |
0.12 |
0.12 |
0.25 |
37.3 |
- |
0.055 |
0.82 |
4-Oct |
155 |
0.37 |
0.15 |
0.52 |
41.5 |
- |
0.11 |
2.02 |
Average |
183 |
0.23 |
0.17 |
0.4 |
39.9 |
- |
0.12 |
1.85 |
Table 7 Flow-weighted concentration of contaminants below the gravel inlet, Year 2002 (complete record)
Date |
Total solids (kg ha-1) |
Sol. P (g ha-1) |
Part. P (g ha-1) |
Total p (g ha-1) |
COD (kg ha-1) |
BOD (g ha-1) |
NH4-H (g ha-11) |
NO3-N (kg ha-1) |
21-Jun |
142 |
98.9 |
82 |
194 |
18.8 |
1.55 |
46.8 |
1.45 |
3-Aug |
21.6 |
28.5 |
29.1 |
57.5 |
5.76 |
0.48 |
35.7 |
0.17 |
21-Aug |
20.5 |
23.4 |
23.6 |
47.1 |
7.06 |
- |
10.4 |
0.15 |
4-Oct |
27 |
64.8 |
26 |
90.8 |
7.25 |
1.15 |
20.4 |
0.33 |
Total |
211 |
216 |
161 |
389 |
39 |
- |
113 |
2.1 |
Table 8 Loading of contaminants below the gravel inlet, Year 2002 (synchronous record)
Date |
Total solids (mg l-1) |
Sol. P (mg l-1) |
Part. P (mg l-1) |
Total p (mg l-1) |
COD (mg l-1) |
BOD (mg l-1) |
NH4-N (mg l-1) |
NO3-N(mg l-1) |
21-Jun |
311 |
0.22 |
0.18 |
0.42 |
41.1 |
3.38 |
0.1 |
3.16 |
3-Aug |
130 |
0.17 |
0.17 |
0.35 |
34.6 |
2.9 |
0.21 |
1.04 |
21-Aug |
108 |
0.12 |
0.13 |
0.25 |
37.3 |
- |
0.055 |
0.82 |
4-Oct |
156 |
0.38 |
0.15 |
0.53 |
42 |
6.64 |
0.12 |
1.89 |
Average |
176 |
0.22 |
0.16 |
0.39 |
38.8 |
4.31 |
0.12 |
1.73 |
Table 9 Concentration of contaminants below the gravel inlet, Year 2002 (synchronous record)
Chemical oxygen demand (COD) loading and concentration
COD represents the oxidizable forms of carbon in the soil. It includes both organic and inorganic forms of carbon and it can be transported in aqueous or sediment phase in runoff.13 Carbon like other pollutants that move with soluble and particulate phase of runoff constitutes a threat to water quality as it may generate biochemical oxygen demand in streams and lakes. Annual loading of COD from the Le Sueur County site was 55.3kg ha-1 and 42.2kg ha-1 from “above and below the gravel”, respectively (Tables 4&7), based on complete record. COD losses followed the distribution of total solids losses through the four rainfall events with 60% coming off the first event in June and the remaining losses almost equally distributed between the other three events. Concentration of COD ranged from a maximum of 289mg/L to a minimum of 4.96mg/L. The average flow-weighted concentration of COD amounts to 50.4mg/L and 39.9mg/L from “above” and “below” the gravel based on the complete record (Tables 5&7). Among all other pollutants measured in the experiment, COD concentrations follow very closely the time pattern of total solids concentrations through all four events with response to peak rainfall intensity and a long tail following the bursts (Figures 4B, 8B, 12B&16B). This trend suggests that this pollutant is attached to sediment and carried in a particulate form. Trapping efficiency of COD had an average of 24% over the four rainfall events with a maximum of 42% for June 21 event and a minimum of 8% for August 21 event (Tables 10&11).
Parameters |
21-Jun |
3-Aug |
21-Aug |
4-Oct |
volume of void **, m3 (porosity=0.37) |
1.8 |
1.5 |
1.5 |
1.5 |
accumulated sediment, kg |
55 |
6.6 |
1.8 |
4 |
volume sediment, m3 |
0.28 |
0.034 |
0.009 |
0.02 |
% of rock void volume filled |
22% |
3.30% |
0.89% |
2.10% |
Table 10 Computation summary for solid particles deposition in the gravel inlet matrix, Total volume filled is 28% by summation of the last row
1) Volume of gravel inlet trench=3.5m3; dimensions: 4mx0.72mx1.2m(length x width x depth) 2) Deposited sediment density: 1.2 (assumed to be close to that of Glencoe and LeSueur Soils) **=volume of void measured in the laboratory.
These previous numbers demonstrate how COD mostly occurs in a particulate form of pollutant; its concentration over the events showed trend similar to that of totals solids. Moreover, it shows a sediment enrichment in COD; enrichment ratio of COD based on soil organic matter (% of soil by weight) and total solids losses (kg ha-1) was 2.98. Annual COD losses (kg ha-1) were divided by the total solids losses to give the proportion of COD in the runoff (188g/kg). The ratio of the latter result to the organic matter content of the soil (63g/kg) provided the enrichment ratio. Schreiber & McGregor13 found carbon enrichment ratio of 2.8 and 2.0 for no-till grain and no-till silage practices and 1.4 and 1.5 for conventional grain and conventional silage practices, respectively.
Concentration and loading of total (TP), particulate (PtP), and soluble phosphorus (SP)
The three forms of phosphorus reported and discussed in this section are mostly TP, PtP, and SP (Figures 5, 9, 13&17). Results for bioavailable phosphorus are not complete for all events and are not commented here. Total phosphorus loadings from “above” and “below” the gravel from all four events are 501g ha-1 and 428g ha for TP, respectively (Tables 4&6). “Below” gravel value is based on complete record. When this site was under a surface inlet system, TP loadings were 264g ha-1 in 1998 with a runoff of 11.2cm. Another study at Lamberton found loadings of TP to be 508g ha-1 and 674g ha-1 from surface runoff of moldboard tillage and ridge-till plot, respectively, both with applied manure and under simulated rainfall immediately after corn planting.14 From “above” the gravel, the dominant form of phosphorus is PtP (57% of TP) with SP at 43% of TP (Table 4). However, “below” the gravel proportions of PtP and SP are completely reversed with 43% and 57%, respectively. This difference is related to loadings from “above” and “below” where incoming PtP was reduced by 35% and SP was augmented by 12%. This increase in SP loading in the below gravel samples contrasts with findings by two blind inlet experiments: 1) Feyereisen et al.15 in Indiana field sites where they found SP loading decrease by 60%; 2) Smith et al,16 found decreased SP load by switching from a riser inlet (17g ha-1) to a blind inlet (2.8g ha-1).
Flow-weighted average concentrations “above” the gravel are 0.46mg/L, 0.25mg/L, and 0.20mg/L, for TP, PtP, and SP, respectively (Table 5). From “below the gravel”, the flow-weighted average concentrations are 0.40mg/L, 0.17mg/L, and 0.23mg/L, for TP, PtP, and SP, respectively, based on the complete record. The flow-weighted average concentrations for PtP and SP were changed by –34% and +5%, respectively. For PtP, concentration decrease is matched by loading decrease (35%). Curves of PtP concentration followed closely those of TP and total solids as they responded to rainfall bursts followed by a quick decline. As for SP, it was observed that its concentration increased over time through the water ponding period pointing to a progressive release from sediment (Figure 5B, 9B, 13B, and 17B). Apart from a SP concentration peak with initial rainfall bursts, SP had a gradual concentration increase from 0.5mg/L to 5.6mg/L at the “below” gravel curve following the second rainfall burst during the October 4 event. Compared to the other previous three rainfall events, the last one in the year (Oct 4) had a significant difference in terms of SP losses, which was augmented by 16% from the “below” gravel compared the “above” gravel sampling location. Ginting et al.12 observed similar SP concentration increases where it went from 0.26mg/L to 0.32mg/L for the first 28-hour period and from 0.14mg/L to 0.68mg/L during the next 48-hour period.
Researchers in lake sediment have discussed the mechanism of phosphorus concentration increase over time, usually termed internal loading. At the Le Sueur site, Bray-P soil test at the bottom of the depression ranges in the high end (45ppm), thus a potential for desorption of this pollutant from the soil. This soil concentration increases the probability of the pollutant to be present in pore waters due to the saturation of binding-P sites in the soil. The most important environmental conditions that influence this release are redox potential, pH, and temperature. Under flooded conditions, oxygen is depleted rapidly, redox potential decreases, and anaerobic conditions develop.6 Release of dissolved phosphate under anaerobic condition into the overlying water can be faster than under aerobic conditions release. The measured values of loading and concentration suggest that around 32% of incoming PtP were retained on average in the gravel inlet matrix due to deposition. It is noticeable that PtP trapping efficiency comes as the highest value in the summary table (Table 11). In comparison, overall trapping efficiency of gravel inlet based on total solids loading lies between 20% and 31% (based on synchronous record). Losses of TP in runoff (0.50kg ha-1) is 0.65 % compared to that applied (77.8kg ha-1 of P) based on 336kg ha-1 of N-P-K at 9-23-20, assuming that losses come only from fertilizer applied. N-P-K fertilizer was applied with the planter and banded below surface.
Concentration. |
Total solids |
Chemical oxygen demand |
Total phosp. |
Particul. Phosp. |
21-Jun-02 |
31.50% |
42.20% |
32.40% |
58.20% |
3-Aug-02 |
24.90% |
24.20% |
6.60% |
19.50% |
21-Aug-02 |
7.70% |
7.90% |
4.20% |
18.60% |
4-Oct-02 |
24.70% |
22.10% |
11.90% |
30.70% |
Average |
22.20% |
24.10% |
13.80% |
31.70% |
Table 11 Trapping efficiency summary over the four events of 2002 and for each contaminant. Only particulate contaminants can be candidate for trapping efficiency estimation. Synchronous records were used in establishing the trapping efficiency value, which is a ratio of influent (incoming) concentrations to that of effluent (outcoming) concentrations
Concentration and loading of ammonium and nitrate nitrogen
Annual ammonium loadings were based only on three events, June 21, August 3, and October 4, with 83.8g ha-1 “above the gravel” and 107g ha-1 “below the gravel” (Tables 4&6). There is an increase of 27% at the “below” gravel sampling location with respect to “above” gravel ammonium loading. This loading difference was mostly found in both June and October events during which ammonium concentrations from “above” were lower compared to that from “below” gravel. Concentration range of ammonium was from 0.046mg L-1 to 0.22mg L-1 from “above” and from 0.10 to 0.22mg L-1 “below” the gravel. The ammonium concentration curve for the October event showed a very large spike toward the end of water ponding that was close to 2.4mg L-1. During the same event, flow through the edge of gravel mound and sidewall went on for 36 hours after the water ponding receded. Losses of ammonium loading reached as high as 2,750g ha-1 in surface runoff for a ridge tillage treatment with urea in a rainfall experiment conducted just after corn planting in Lamberton with concentration close to 30mg L-1.14 This loss was attributed to rapid hydrolysis of urea to ammonium and the lack of incorporation in the tillage treatment.
Annual nitrate losses were 1.42kg ha-1 and 2.34kg ha-1 from “above” and “below” the gravel inlet, respectively (Tables 4&6); corresponding average concentrations were 1.20mg L-1 and 1.85mg L-1 (Tables 5&7). These nitrate losses were higher than those reported by Ginting et al.12 in a surface inlet experiment 0.177kg ha-1 and 0.108kg ha-1 from rainfall events from two separate watersheds. In a similar way, Zhao et al.14 had lower nitrate losses in a combination of tillage and type of fertilizer experiment with 0.26kg ha-1 (ridge till and manure) in surface runoff, which was the highest loading from a simulated rainfall. In a 1986 study at Waseca experimental station, it was shown over a 5-year period that annual losses of nitrate in a drainage system were greatly influenced by rate of application and slightly by timing of application (fall versus spring).17 Relative to the input of nitrogen fertilizer for the Le Sueur County site, nitrate and ammonium losses are comparatively small. Total nitrogen inputs were 176kg ha-1 as anhydrous liquid ammonia and N-P-K fertilizer; losses of ammonium and nitrate were 0.1% and 1.4% of applied quantity, respectively.
The increase of nitrate average concentration and loading from “below gravel” represented 64% and 54% from the “above gravel” values, respectively. This increase was mostly due to flow in the tail portion of the water height curve. While water on the surface receded, flow continued through the edge of the gravel mound or through the sidewall of the trench, thus more interaction between the flow and the soil profile. This latter flow type leached nitrate ions present through the soil profile in the vicinity of the trench. Tail flow lasted 21hours, 12hours, and 36hours following ponded flow for June 21, August 3, and October 4events, respectively (Figures 8, 10, 13, 18). Flow rate during the tail period ranged between 0.17m3 min-1 and 0.021m3 min-1. For all events, nitrate concentrations showed a gradual increase and usually reached their maximum during the tail portion of the flow. Largest nitrate concentrations also occurred during the October event reaching 9.2mg L-1 with two distinct periods. The last episode of nitrate concentration increase suggests that matrix flow had occurred; nitrate in the soil profile was leached by sidewall flow and may explain this steep concentration change.
Despite the concentration increase toward the end of each event, overall losses of nitrate and ammonium were small compared to nitrogen inputs. Under flooded conditions, nitrogen compounds in the runoff water can undergo significant changes and loss due to denitrification process. Denitrification is active under flooded conditions provided that both anaerobic condition and water-soluble or readily decomposable organic matter are present.7
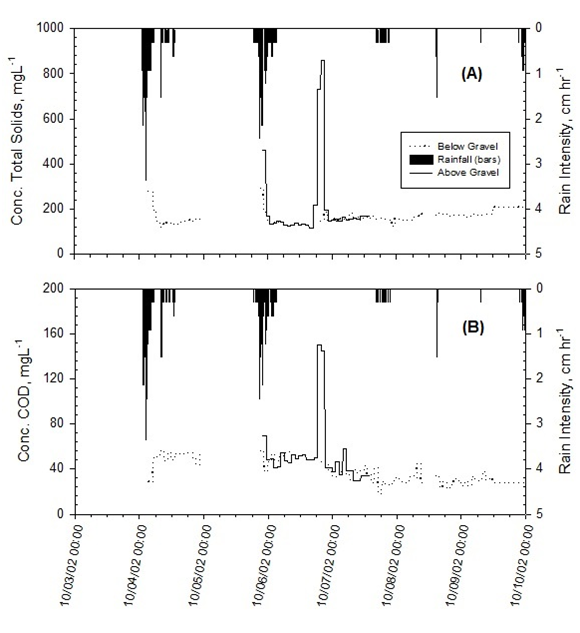
Figure 16October 4, 2002 rainfall event: Concentrations of above and below gravel inlet samples for Total Solids (A) and COD (B). The concentration curves are here shown with rainfall intensity as several rainfall bursts were spread over several days. Concentration scales are different for each pollutant.
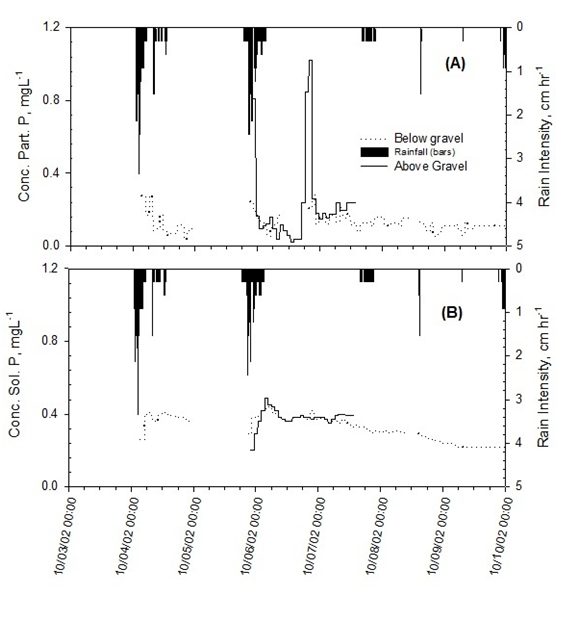
Figure 17October 4, 2002 rainfall event: Particulate (A) and Soluble (B) Phosphorus concentrations of above and below gravel inlet samples.
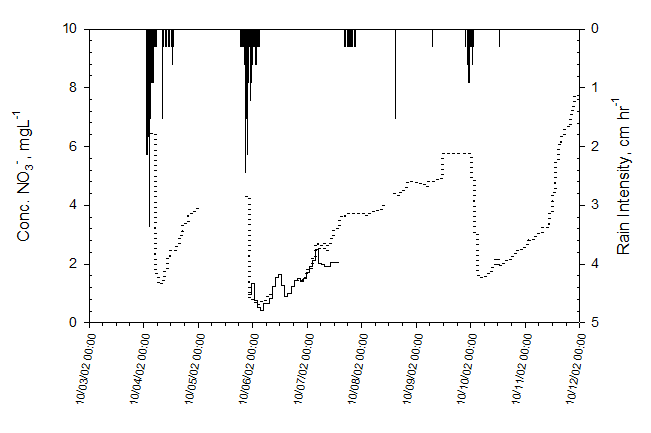
Figure 18October 4, 2002 event: nitrate concentration. This diagram shows the fluctuation of concentrations for this pollutant related to edge and sidewall flow. The time axis was extended until 10/12/02 compared to other contaminants due to some significant increases in concentration over time while water ponding on the surface receded after 10/8/02, 16:00.
The estimated amount of deposited sediment was based on:
A uniform deposition of sediment is assumed within the gravel inlet system. By summing the percentage of gravel voids filled with sediment in 2002, 37% of the volume of voids was filled, assuming a uniform distribution in the gravel depth. This value of 37% is a minimum as only the synchronous record was used to compute the amount of sediment deposited. The filling of the gravel bed occurred under two environmental conditions: climatic and agronomic. The largest amount of sediment deposited occurred in June. Corn was sheen-high and canopy cover was not yet adequate for soil surface protection. In addition, the previous year crop was soybean, which leaves little residue on the ground. There was a real potential for erosion of the soil surface left with little protection.
The 2002 rainfall events were rather unusual with 5events of above 5.0cm in a 24-hour period recorded on site. Annual rainfall recorded on site (LeSueur County, New Prague) was close to 81.5cm, making it a wet year (more than 7.0cm above the normal precipitation). Rainfall for the LeSueur site in 2002 was much higher than the normal precipitation (1971-2000) at Jordan Station for the months of June, July, August, and even October. There is a relatively low probability of having such a wet year replicated several times in the coming years. Taking into account the June 21 event only, its return period was approximately equivalent to a 25-year 12-hour storm, 9.8cm for 13hours, based on the Rainfall Frequency Atlas of the Midwest.18 If we were to investigate the probability of occurrence of such storm three times in a 10-year period, we could use a binomial approach to obtain a probability of 1/173, i.e. 0.58% (Table 12). Ten-year period refers to the time period for which the gravel inlet is still operational to be eligible for cost-share program. Three times occurrence for such storm would almost clog the gravel inlet by a simple interpolation assuming that the storm would fill in about 30% (26% and 37%) of the void volume in the gravel inlet.
P - probability in a given trial |
1 - P |
N - number of trials |
R - number of occurrences |
(n/r) - binomial coefficient * |
P^r |
(1 - p)^n-r |
P(of r) |
1/p |
P % |
0.04 |
0.96 |
10 |
3 |
120 |
0.000064 |
0.751448 |
0.005771 |
173 |
0.58% |
0.04 |
0.96 |
10 |
1 |
10 |
0.04 |
0.692534 |
0.277014 |
4 |
27.70% |
0.1 |
0.9 |
10 |
3 |
120 |
0.001 |
0.478297 |
0.057396 |
17 |
5.74% |
Table 12 Repeated independent trials for finding the probability of having three 12-hour storms of 25-year return period in a 10-year period. from: "Elements of Statistical Inference", David V. Huntsberger, 2nd edition, 1970
More arguments would caution us against the apparently simple deposition computation above:
Filtration through the gravel inlet is very complex and only gross estimates can be provided for the longevity of gravel inlet under several assumptions. Comparison of particle number from above and below is the classical method for assessing effective filtration. The critical aspect of filtration is detachment by which deposited sediment are re-entrained. In this case, a better knowledge of this process will help clarify the actual impact of gravel inlet in water quality.
The ponding of water in a landscape depression constitutes a major factor in the hydrology of the gravel inlet system and its impact on the environment. Several mechanisms were reported in other research experiments and the present one to have occurred such as sedimentation, nitrate reduction, and soluble phosphorus release from bottom sediment. Overall, the flow back-pressure in the drainage system can reduce the flow capacity of the gravel inlet. Three types of flow were identified at the gravel inlet, ponded flow, edge flow, and sidewall flow. A large proportion of water in the depression basin is evacuated as ponded flow while less than 10% exits the system as edge and sidewall flow.
Loading and concentration of contaminants were studied using particulate and soluble constituents entering and exiting the gravel inlet. Loading and concentration of total solids, chemical oxygen demand, phosphorus, and nitrogen compounds were comparable to findings by other research workers from the same region in Minnesota.12,14,22 Average trapping efficiency over the four rainfall events in 2002 was 24%, 14%, and 32% for chemical oxygen demand, total phosphorus, and particulate phosphorus, respectively. Total phosphorus trapping efficiency was relatively low compared to the other contaminants as soluble phosphorus was still accounted for in that figure. In general, curves of concentration respond to precipitation intensities with maximum values synchronous with rainfall bursts followed by fast decline. Other particulate contaminant concentrations followed the trend of total solids in terms of timing and magnitude such a chemical oxygen demand, particulate phosphorus, and total phosphorus to a lesser extent.
Soluble pollutants such nitrate and soluble phosphorus showed different trends within the system. Nitrate concentration increased over time after ponded flow receded showing some matrix flow with leaching effect on nitrate present in the soil profile. Concentration values of nitrate reached 9.0mg L-1 toward the end of some rainfall events. Annual loadings of nitrate were moderate compared to results from similar experiments. In a similar fashion, soluble phosphorus concentration augmented over time during water ponding. A possible mechanism from lake sediment studies was suggested to have prompted this concentration increase based on oxygen depletion in soil and water column, redox potential decrease, and a high soil test for phosphorus. The transport mechanism of nitrate in the soil profile and the partitioning of total phosphorus into particulate and soluble forms are crucial elements for addressing environmental concerns over ponding water generated by gravel or surface inlet system. On an annual basis, the gravel inlet matrix was filled with deposited sediment up to 37% of its volume, assuming a uniform distribution over its depth and a sediment density similar to that of soil (1200kg m-3). A large portion of the deposition occurred during the first largest rainfall event while the other events had comparatively smaller contributions. Climate and other complex filtration mechanisms play determinant roles in the filling up of the matrix and/or detachment of previously deposited sediment. Based on the largest event recorded (June 21, 2002), probability of filling up the gravel inlet in a ten–year period by a 25-year 12-hour storm is relatively low (0.58%) under erosive field conditions (minimum residue cover).
None.
The authors declare that there are no conflicts of interest.
None.

©2019 Ranaivoson, et al. This is an open access article distributed under the terms of the, which permits unrestricted use, distribution, and build upon your work non-commercially.