International Journal of
eISSN: 2576-4454


Research Article Volume 1 Issue 7
1Department of Earth, Ocean and Atmospheric Sciences, Florida State University, USA
2National Hurricane Center, NOAA, USA
3Bharata Mata College, India
Correspondence: Krishnamurti TN, Department of Earth, Ocean and Atmospheric Sciences, Florida State University, USA, Tel +1 850-644-2210
Received: December 20, 2017 | Published: December 29, 2017
Citation: Krishnamurti TN, Sahu DK, Kumar V, et al. Extreme orographic rains from streams of moist marine layer wind systems with a possible geoengineering application. Int J Hydro. 2017;1(7):229-242. DOI: 10.15406/ijh.2017.01.00039
The Waialeale Mountain of the Hawaiian Islands records annual rains of 430 to 460 inches/year during undisturbed days. Here the undisturbed trades carry streams of stratocumulus, fair weather cumulus with some towering cumulus clouds towards the mountain. The special shape of the Waialeale is a major contributor for the ascent of the moist marine air and clouds on the slopes of the mountain. The heavy rains are contributed between the cloud base and the base of the inversion where a triple product (winds normal to the mountain, slope of the mountain and vertical gradient of saturation specific humidity) acquires large negative values. This is a measure of disposition of supersaturation for surface rains from warm shallow clouds. This study includes modelling studies ensuing a cloud resolving model at high resolution to simulate heavy rains on rain free days. Skillful day one forecasts of heavy orographic rains are possible. Indian winter monsoon’s northeasterly flows that carry moisture towards Chennai city, southeast coast of India; this is an environment that is somewhat similar to that of the Pacific trades. In numerical experiments an appropriate windward face of the southeast Indian mountain, the Eastern Ghats, can substantially enhance the rains over south India on rain free days. Conceptual geo-engineering of a near coastal mountain for modeling and practical applications for heavy rains over the southeast coast of India are suggested.
Keywords: heavy orographic rains, stratocumulus cloud streams, trade winds, orographic shape, orographic geoengineering
This study covers four parts. The first part describes the heaviest rains at Waialeale Mountains of the Kauaʻi Island of Hawaii. The second part describes a numerical modelling of the daily heavy rains at Waialeale during undisturbed weather days. A third part of this study explores other parts of the world where certain thresholds, such as a Baines number and a triple product (suggested by a microphysical cloud resolving model) call for the possibility of heavy rains. The fourth part suggests that with a proper shape of the mountain, models predict heavy rains in regions, which satisfy the two numbers, during days of no rains. We show that strong trades and monsoonal winds carry huge amounts of moisture in the marine layer next to the ocean surface that has the capability for yielding, under proper conditions, large amounts of orographic rains. Hawaiian rainfall has been studied by a number of authors; these include studies on rainfall variability, mesoscale modelling, trade wind inversion, humidity profiles, and topographic effects.1−5 These study have provided important background for the orographic rains of Hawaii. Mount Waialeale (or Waialeale) is a volcanic mountain on the island of Kaua’i in the Hawaiian Islands. The name Waialeale means “rippling water” or “overflowing water” in Hawaiian language. The Waialeale mountain formed some 6 million years ago from a volcanic eruption, with a conical shape, whose east face eroded somewhat with time.6−8 This is a small size mountain; its height and width are around 1.5 km and 22 km, respectively. Figure 1 illustrates its plan view and a photograph of the (eastward) windward front face. A rain gauge placed over a region of the Waialeale mountain in 2007, where visual observations showed most frequent rains and measured the world’s highest rains, nearly 400 to 430 inches of rain per year. In later date new places have emerged that are now at the top of the list of highest rains per year and Waialeale mountain has presently moved down to the 8th position in the list (study conducted by “worldatlas” http://www.worldatlas.com/articles/the-ten-wettest-places-in-the-world.html). Waialeale is an isolated heavy rainfall center over a small region, by the mountain, that occupies nearly a two-and-a-half-mile square area. Roughly 70 percent of that rain comes from days of undisturbed weather and passage of streams of stratocumulus and a few towering cumuli that interact with the Waialeale mountains. In this study the term "undisturbed weather" is used to define periods when the trades (or the winter monsoon flows), at the 850 hPa level, carry no storms on the synoptic or mesoscales. These trade winds (or north-east flows) resemble the climatological mean flows for that month. During such periods of undisturbed weather, often surges are present in the trades. Using a very high resolution cloud resolving mesoscale model, these heavy rains are modeled. Other Hawaiian Islands do have taller mountains but the shapes of the mountains are not as favorable as the Waialeale for such annual rainfall totals. When the volcanic eruptions first formed the conical shaped Waialeale mountain, the eastward facing part collapsed leaving an arm chair shape that invited a favorable ascent for the clouds that passed that way. The model was used to carry out a long string of one day forecasts (almost equivalent to now casting). A computer search of other parts of the world with similar meteorological features was carried out. It was noted that the northeast monsoon of the Bay of Bengal is a region where a plethora of stratocumuli stream from northeast to southwest towards the southeast coast of India. The Eastern Ghats is a mountain chain along eastern India where the marine moist layer carries many of the same properties as in the Pacific trades. The combination of moist marine air, the stratocumulus streams capped by inversion and the Eastern Ghats were however, not sufficient to produce any significant rains on undisturbed days. The authors next ask a modeling question: If the windward face of the Waialeale mountain (as defined by the USGS topographic data sets at 200-meter resolution) was made to face the northeast monsoon, then what can be expected in terms of rains during undisturbed days for a carefully selected hill of the Eastern Ghats. One such candidate mountain is the Jawadhu hills where the rainfall is usually very small (reported by India Meteorological Department) during undisturbed days. The effect of such an artificial mountain is studied here from a numerical modeling study. The final part of this study addresses possible applications of such a mountain design (replaced with Waialeale mountain), for this winter monsoon site over southeastern India, which is close to the greater Chennai city that currently faces a water shortage (not covered by its annual rains) of around 250 million liters/day. The northeast trades of the Pacific Ocean impacting Hawai’i bear a strong similarity to the northeast monsoon flows of the Bay of Bengal during the months from October to February. Stratocumulus and towering cumuli abound and pass through several parts of southeast India. The Chennai radar shows an abundance of such cloud features. The Eastern Ghats are not shaped to cause the ascent of moist marine air in the same manner as at Waialeale mountains. Hardly any rainfall is observed along the southern parts of the Eastern Ghats on undisturbed days. We are suggesting a possible modification of the windward face of the Jawadhu (facing the northeast monsoon winds) such that the winds encounter a mountain quite same as the Waialeale mountain of the Hawaiian chain.
The same model that simulates a month long history of daily heavy rains (during mostly undisturbed days) near the Waialeale mountains, if used in south India, in a winter monsoon environment, produces similar heavy rains on days of no rains, if it is provided with the right shape, height and orientation of a mountain with respect to the prevailing northeast winds. This placement is shown, from modeling, to produce heavy rains of the order of 1/2 inch to 1 inch a day during undisturbed weather when no rains were observed on such days. This study includes a modeling validation of the daily heavy rains of the Waialeale region during September 2010 and rains over Jawadhu (India) for selected days during November-December 2011 and January 2012 (winter monsoon season). The Advanced Research WRF (WRF-ARW;)9 is employed to simulate the precipitation and other variables over the study region. The model is not run in the spirit of forecasts but more so to show that a string of day-one forecasts do carry these heavy rains quite reasonably in magnitude compared to observations during undisturbed days of September 2010 and Indian northeast monsoon. The successful simulation is possible because of the inherent very large scale flows during these undisturbed periods, where many irresolvable smaller scales observational features were not present in the initial states. These rains are contributed from large values of a triple product that signifies the disposition of supersaturation from these warm clouds that extend roughly between 500 meter (cloud base) and 900 meter (the base of the inversion). The triple product includes the slope of the mountain, the winds impinging on the mountain and the vertical gradient of saturation specific humidity. These strings of daily observed rains are modeled fairly accurately from a cloud resolving high resolution mesoscale model with warm cloud microphysics. The triple product is enhanced during periods of undisturbed trades when speed surges (of the undisturbed trades) are present.10 This is also reflected in the time series of observed rains discussed in the following section.
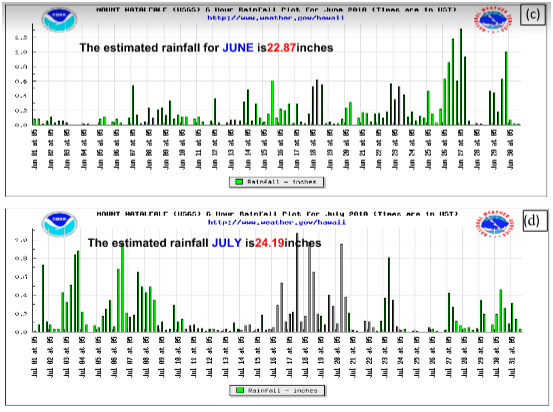
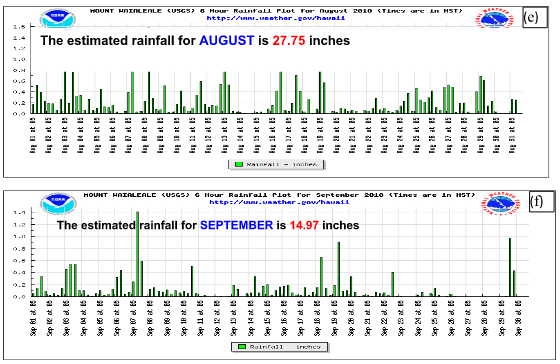
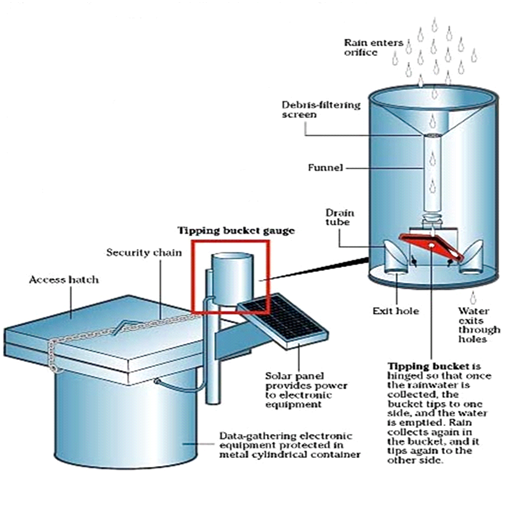
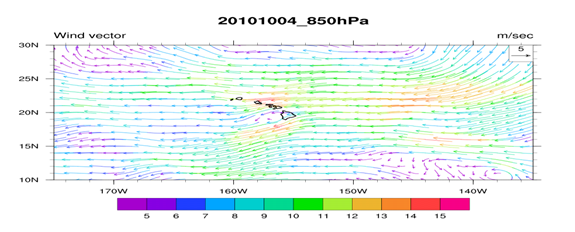
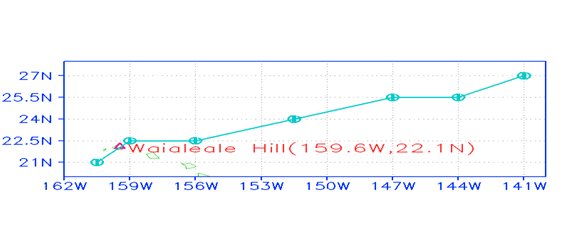
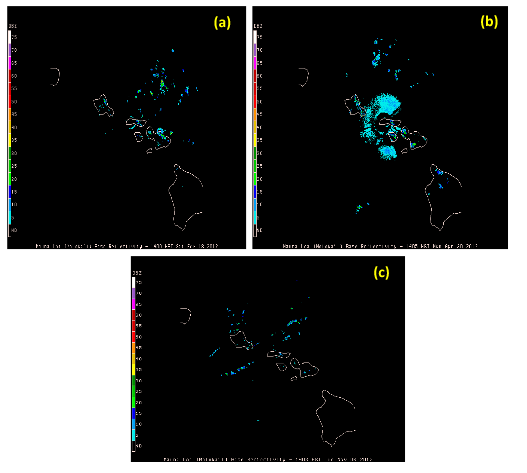
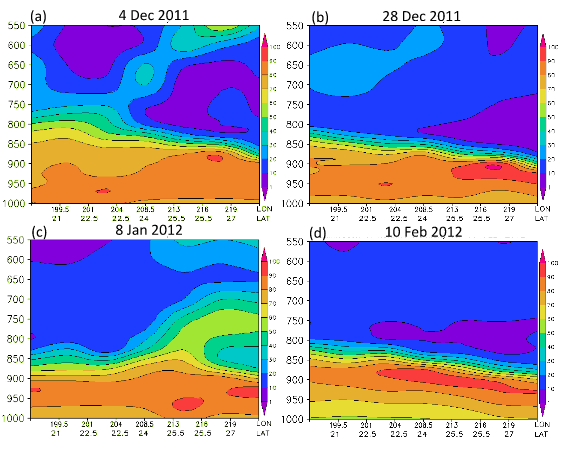
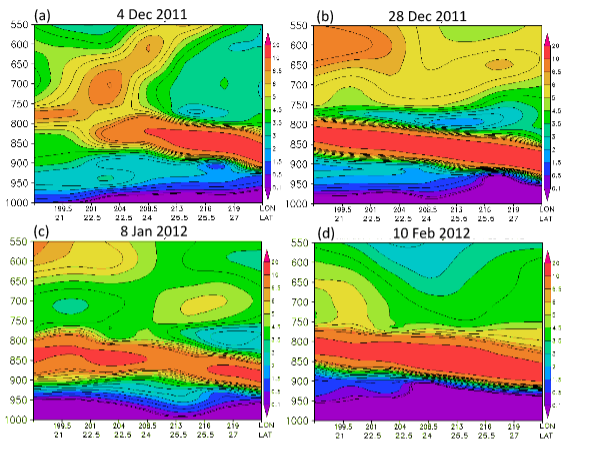
Orographic rains have been studied in a number of previous studies relevant to this work.11−16 The daily heavy rains, during undisturbed days, from the Waialeale rain gauge, are localized over a small geographical area. The daily maximum of rains generally is of the order of an inch to an inch and a half at this rain gauge. The inversion capped stratocumulus and cumulus from the marine layer of the Pacific trades carry enough moisture to provide these steady rains. Of a total of 460 inches of annual rains (climatology) at Waialeale, the rains during undisturbed days were estimated to be around 270 inches. Figure 2 shows the daily observed rainfall for several months at the Waialeale rain-gauge site during the year 2010. During different months the average daily rainfall varies between 20 to 45 inches and the total annual rainfall, for the year 2010, at this site was 450 inches. Most of this heavy rainfall occurred within a two and half square mile area that prompted the National Weather Service to deploy an automatic recording rain gauge within this localized site. A tipping bucket rain gauge (Figure 3), was deployed by the National Weather Service, from a helicopter at the visually observed site of heavy rainfall near the Waialeale mountain. This automatic rain gauge telemetered the daily rainfall totals to the closest weather station at Lihue in Kaua’i. The placement of this rain gauge and the world’s record rainfall at this site clearly shows the much localized nature of the Waialeale rains. A typical example of the lower tropospheric flow field at the 850 hPa level for the undisturbed trades is derived from the ERA Interim reanalysis data sets on 4 September 2010, as shown in Figure 4. This illustration shows the typical configuration of the undisturbed trades as seen around the Hawaiian Islands. Most of these flows are from the east. The strength of the trade winds is generally between 10 and 15 knots at this level. Figure 5 illustrates a typical climatological (1979-2012) back trajectory at 850 hPa level for September month. That is extending to the northeast from Waialeale following the Pacific undisturbed trades. A method for the construction of back trajectories follows Krishnamurti and Bounoua.17 Along such back trajectories a number of features of the trade wind environment such as the relative humidity of the marine air and the dry static stability ( )18 were examined; those structures showed the base and top of the inversion and its day to day variability. The passage of a stream of stratocumulus and fair weather cumulus is best seen from the visible images of a geostationary satellite such as GOES West. A single frame from GOES west is shown in Figure 6; that clearly portrays the robust population of stratocumulus and fair weather cumulus clouds in the region. One can also look upwind from a Doppler Radar, that is located in the northern part of Honolulu, and see the passage of the streams of stratocumulus from the images of radar reflectivity on undisturbed weather days over this region. Figure 7 shows three examples of the stream of stratocumulus on 18 Feb 2012, 30 April 2012 and 06 Nov 2012, those are seen from the Honolulu radar reflectivity. These pictures, when animated, clearly show the westward passage of the clouds that carry sufficient liquid water mixing ratio to be resolved by this ground based radar. This radar also shows the vertical plane view of these same cloud elements; those do confirm that we are seeing the stratocumulus extending to the level of the base of the trade wind inversion. The backgrounds of this region are discussed in.19 In the following paragraph we are showing the vertical profiles of relative humidity and the dry static stability, unfortunately the radar data were not available for the same dates. We are only looking at these two features on undisturbed days where the large scale trades carry similar features. Figure 8 illustrates the vertical cross section of relative humidity following the back trajectory from Waialeale on four selected undisturbed days such as 4 Dec 2011, 28 Dec 2011, 8 Jan 2012, and 10 Feb 2012. The construction of back trajectories is discussed in Krishnamurti and Bounoua.17 In this illustration the abscissa denotes the latitude and longitude locations from the Waialeale along the back trajectory and the ordinate denotes pressure. The lines within the diagrams are the relative humidity for the respective undisturbed days. The moisture structure in the marine layer of the undisturbed trades over the Hawaiian region is characterized by relative humidity in excess of 80 to 85 percent in the marine boundary layer and the dryer air aloft above 750 hPa level generally carries relative humidity less than 30 percent. Along those back trajectories the fields of dry static stability were also prepared for the same undisturbed days as shown in Figure 9. In those vertical cross section, the following features were noted. A stable layer overlies the less stable surface layer below 900 hPa level. The top of the stable layer generally extends to around the 700 to 800 hPa level. The cloud tops of the stratocumulus barely go up to the base of the stable layer which characterizes the start of the trade wind's inversion. On the left end of those illustration is the location of the Waialeale mountain. As we approach the Waialeale the inversion base risen permitting vertical growth of clouds over the sloping mountain. Here the base of the stable layer is pushed up to almost to the 800 hPa level.


Modeling the waialeale rains
Numerous studies have addressed the numerical modeling studies of orographic rains around the globe.20−25 A mesoscale model, the WRF/ARW version 3.49,26 is used for this numerical study with a three-nested domain having horizontal resolutions of 4.5 km, 1.5 km and 0.5 km respectively. The initial and boundary conditions for the high resolution mesoscale model simulations were derived from the 1o latitude by 1o longitude GFS data. The WRF model supports a number of cloud resolving physics and microphysics schemes, with a number of phase change processes. In this mesoscale model the Goddard microphysics27 as modified by Tao et al.28 was used on all three domains including the horizontal resolution of 0.5 km inner mesh, for resolving the stratocumulus clouds, the buoyancy streams and the heavy orographic rains. This microphysical water substance equation within the closed system of the WRF equations includes equations for cloud water, rain water, ice, snow and graupel. These equations include transfer rates among the species such as water vapor to cloud water, water vapor to ice, water vapor to rain water, water vapor to snow and water vapor to graupel etc. The conversion processes include auto-conversion, accretion, evaporation and sublimation. For these warm orographic clouds, capped by the trade wind inversion Figure 10, much of Lin et al.27 microphysics were not invoked during the 24-hr predictions, since ice, snow and graupel were not encountered in the warm rain processes. The salient aspects of the warm cloud microphysics include water vapor, condensation, evaporation, cloud droplets, collision/coalescence, accretion, and rain droplets including evaporation and precipitation.20,29−32 Other aspects of the WRF model included the following options. The outer most domains (4.5 km) carries the Kain-Fritsch cumulus parameterization scheme,33 however the inner two domains (1.5 km and 0.5 km) allow cloud resolving high resolution grids with no cumulus parameterization scheme. The planetary boundary layer processes in the mesoscale model are governed by the YSU PBL scheme,34 the short wave and long wave radiation processes are followed by the RRTM scheme35 and Dudhia scheme36 respectively. The land surface processes in the model are described by the Noah LSM scheme.37 Modeling of the Waialeale rains was carried out using a selected string of one day forecasts (24-hr) from 1st to 30th September 2010. This was a relatively simple exercise, since the basic flows for these selected days were on the large scale, i.e. the undisturbed trades (Figure 4), and during these days there were no squalls, fronts or intense weather systems such as tropical storms.
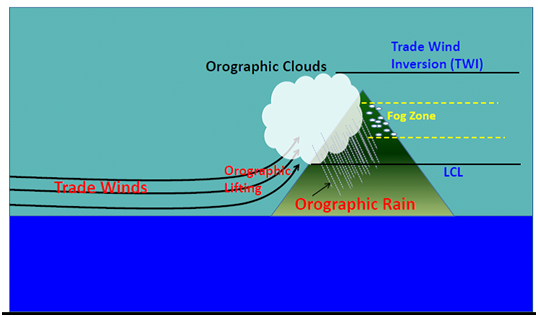
Two indices for air flow and heavy rains on mountain slopes: The Baines number,38 is a product of the Brunt Vaisala frequency (B), the height of the mountain (H) and the inverse of the flow intensity (U) impinging on the mountain. This was used by Baines,38 in fluid dynamics experiments where he used a dye to tag the flow and noted that for Baines number less than one the flow goes over the mountain and for Baines number greater than one it prefers a flow around the mountain. Figure 11 illustrates a schematic sketch of the flow over and around the mountain following this work. The other important parameter is a triple product; this is the product of the vertical derivative of the saturation specific humidity, the windward slope of the mountain and the wind impinging on the mountain. A large negative value of the triple product favors heavy rains. For the flows over the Waialeale mountains if we use an approximate value for the Brunt Vaisala frequency of 1/2 minutes, a height of the mountain H of 1 km, and a zonal wind of the order of 10 m s-1 this corresponds to a Baines number less than one. Given that possibility for flow over the mountain if the triple product carries a large negative value between the cloud base (Lifting Condensation Level) and the base of the inversion, then large rains from the disposition of supersaturation are possible. The triple product is a measure of the local disposition of supersaturation rain at any location. The vertical integral of the triple product is a measure of the total surface rain. Thus the role of the triple product is more for the heavy rain possibility whereas the Baines number (less than one) assures the flow over the mountain. A word of caution is needed here; these two indices may not be totally in agreement ‘for heavy rains where is large (Baines calling for flow over the mountain) and is small (triple product very small)’, i.e., the value of h may satisfy the Baines criterion for flow over the mountain but the triple product may not carry a sufficiently large negative value and vice versa. In a cloud resolving model the microphysics of the transformation of water vapor to liquid water is largely the disposition of supersaturation and is a major contributor to the local orographic rains. The surface rain, R, can be expressed by,
(1)
Where denotes the saturation specific humidity and w is the vertical velocity. Over the orographic slopes the vertical velocity is largely given by where is the upslope wind normal to the orography of slope. Thus a triple product measures the local disposition of the supersaturation, i.e. at any vertical level. The vertical distributions of this triple product (negative values) over a sloping terrain identify the vertical levels where the largest contribution to the orographic rain is possible, and the total rain is given by,
(2)
(2) is expressed in the units of mm/day of rain.
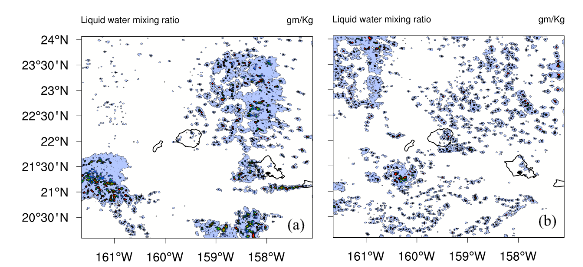
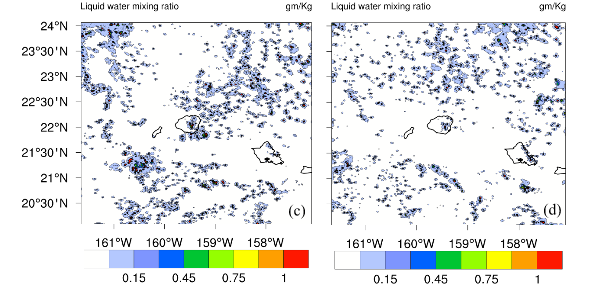
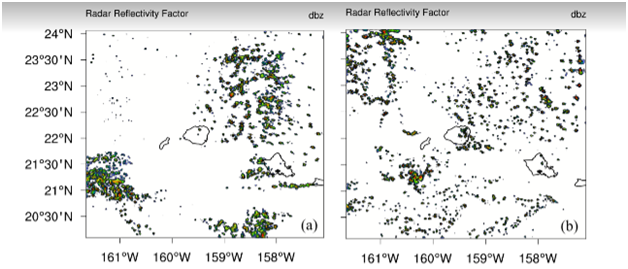
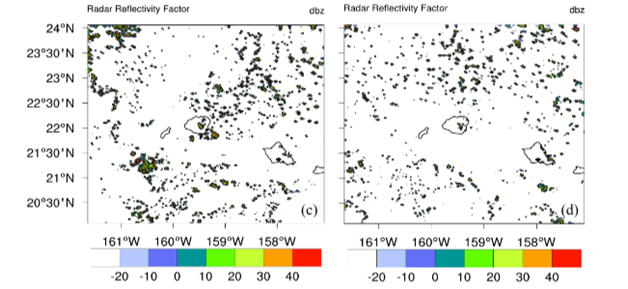
A comparison of observed and predicted rains, respectively, (for one day forecasts) is presented in Figure 12 for each day of September 2010 for the Waialeale region. Most of this month carried undisturbed weather conditions. Figure 12(A) shows the daily rains (inches/day) from the Waialeale rain gauge and Figure 12(B) shows the results from the WRF model, using the Goddard microphysics, for a grid point close to the rain gauge site for the same day’s total. The agreement of this string of 30 one day forecasts is excellent. Figure 13 shows a time series of this triple product (as a function of height) over the Waialeale slopes. The vertical gradient of the saturation specific humidity, below the lifting condensation level, can be non-zero but that region does not contribute to rain; that should be kept in mind while interpreting Figure 13. In this illustration the dark blue coloring shows regions where the triple product, based on observations, is the largest and this implies a large disposition of supersaturation. The model internally carries this triple product, as a prime mechanism for heavy orographic warm rains. Consistent heavy rains from a string of one day model forecasts confirm the importance of the triple product. The liquid water mixing ratio at the 850 hPa level, for a sample of days, from the high resolution WRF model runs, at the 0.5 km resolution, are shown in Figure 14. These illustrations show that the model does resolve the liquid water mixing ratio based signatures of stratocumulus streams covering a large belt of the domain shown here. These are distributions during undisturbed days. It should be noted that the stratocumulus resolved by the geostationary satellite, by the Hawai’i ground based radar and those resolved by the model, are at slightly different horizontal resolutions. What is unique about this stream of stratocumulus from the WRF model is that as the moist air with clouds risen above the model mountain (Waialeale), the day one forecasts of rainfall from the model are indeed very close to the observed rain gauge estimates (Figure 12). This implies that even though the resolution of the stratocumulus is model dependent, they seem to carry somewhat the right amount of moisture from the marine layer of the trades that are deposited as heavy rains upon orographic ascent. Several illustrations of radar reflectivity (dBZ) are also analyzed from the model forecasts and presented in Figure 15. The figures illustrate that, the model does resolve the hydrometeors in terms of radar reflectivity, which represents the signature of stratocumulus stream covering the domain including the Hawaiian Island. The model resolution of 0.5 km uses Goddard microphysics in the cloud resolving model; it is possible to simulate a reasonable passage of the stratocumulus streams. Animations, based on Honolulu radar (not shown here), also show somewhat similar streams of clouds during the passage of stratocumulus streams. A field of the model based buoyancy can be calculated following, Krishnamurti’s derivation39 ‘Buoyancy is defined by the relation:
(3)
Where is the acceleration of gravity, is virtual temperature inside a cloud, is virtual temperature of the cloud environment, is liquid water mixing ratio in the cloud (usually > 0.1 g/kg). Prime represents a deviation measured from a mean value at a pressure level. This is calculated from the output of the WRF cloud resolving model. The presence of clouds is tagged from liquid water mixing ratio greater than 0.01 gm/kg.40 Liquid water mixing ratio is a dependent variable of the cloud resolving model and its value is available at all grid points. The cloud environment is the nearest cloud free grid point, for which the environmental virtual temperature is extracted. Buoyancy is a cloud property and so is the liquid water mixing ratio. The two fields: liquid water mixing ratio and buoyancy, look similar since their non-zero values only prevail where clouds are present; the two fields are not simply proportional to each other since buoyancy carries a negative sign for the downward directed weight of water. This follows from the second term in the definition of buoyancy in equation (3). The first term carries the larger magnitude generally. The first term makes it necessary to have the model provide an estimate of buoyancy since that cannot be seen from a radar. Vertical cross sections of buoyancy following the back trajectory from Waialeale are shown in Figure 16. These are very illustrative on the vertical stretching of buoyancy, as these elements arrive over the sloping mountain as shown in Figure 16. Active clusters of buoyancy elements, as they arrive over the slopes of the mountain, amplify to a higher value of 0.05 to 0.06 m/sec2 and are a contributor to the heavy rains. A message that emerges from an examination of animations of buoyancy streams over the Pacific trades is that the marine layer of these wind systems of the tropics and subtropics carry a very large volume of liquid water and buoyancy, this very large volume of water is never realized if the streams do not encounter the right windward shapes of orography. Figure 17 shows the vertical distribution of liquid water content (g/m3) passage over the Waialeale mountain site. It illustrates the vertical stretching of liquid water with a high value of 0.9 g/m3 when it arrives and passes over the sloping mountain (Figure 17).
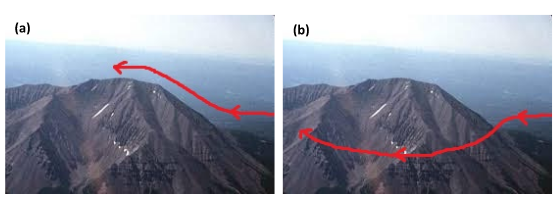
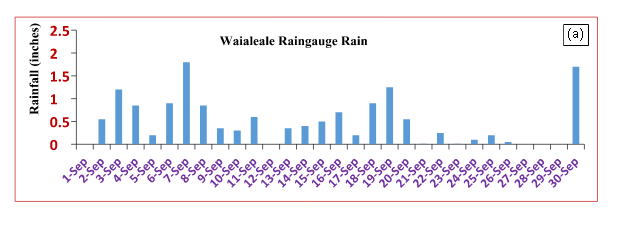
Figure a: A summary of the observed daily rains.
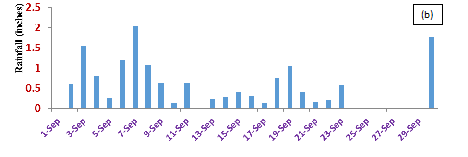
Figure b: The daily WRF model forecasts for 10 undisturbed days for the Hawaiian region during September 2010.

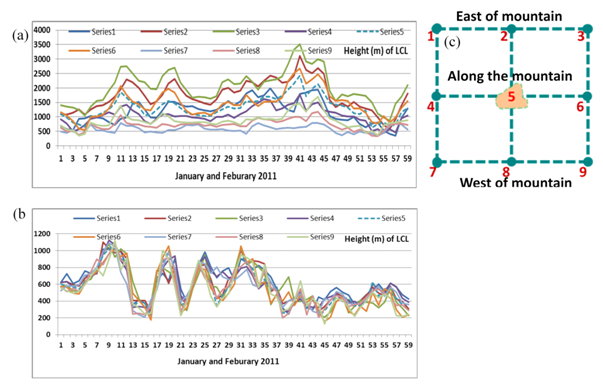
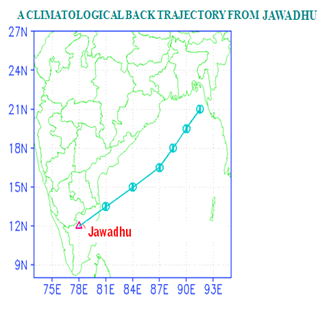
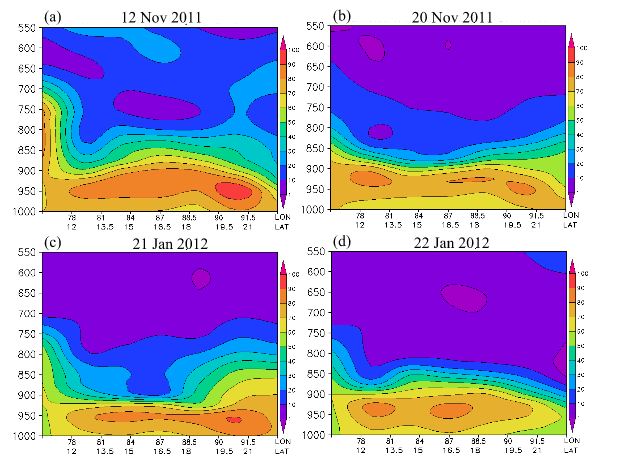
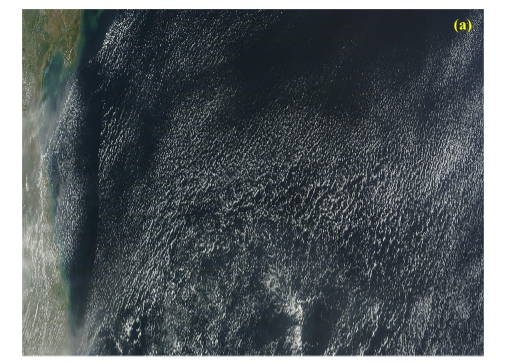
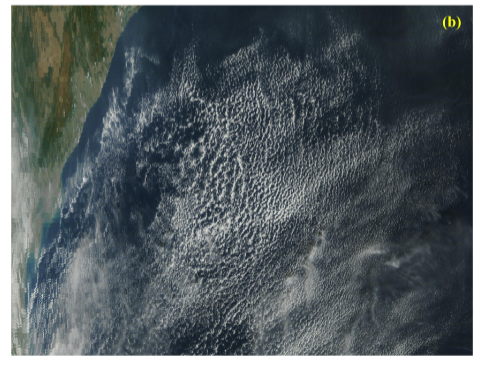
Similar wind systems, marine moist boundary layer, low inversion layer and near coastal mountains prevail over many parts of the tropics and the subtropics. From a computer search for such locations, over the tropics and subtropics, it was noted that such features can be found over northeastern Australia, southeastern Africa, southwestern China, east and west coasts of India, Central America and northeast coastal areas of South America. These carry most of the above ingredients except for the right shape and orientation of the windward face of the mountains (to satisfy the Baines number and a robust triple product) and as a consequence not much rainfall is noted over these regions during undisturbed days. In this section we ask the question: ‘What if a right shape of mountains was made to face the Bay of Bengal’s northeasterly winds, would the rainfall enhance drastically on undisturbed days when almost no rainfalls? The northeast monsoon of the Bay of Bengal prevails for nearly four and a half months (middle of November to the end of March) over the southeast coast of India. These winds bring in moist streams of air towards the Eastern Ghats. Those are a chain of mountains along the east coast of India. The Lifting Condensation Level (LCL), a reasonable measure of the cloud base for both the Pacific trades and the Bay of Bengal winter monsoon flows are close to 500 meters as shown in Figure 18A. The LCL meanders between 200 meters above sea level to as high as 800 meters as shown in Figure 18A. The offshore marine layers in both cases carry a low inversion base near 1km. The LCL near the Jawadhu hills was computed on a daily basis for the months January and February 2011 (Figure 18B). There were very little meanders in the height of the LCL from one day to the next for the northeast monsoon over the Chennai region and its mean value is around 500 meters. In comparison the Hawaiian site of Lihue shows a somewhat stronger variability for the height of the LCL (Figure 18B), although both carry a mean height near 500 meters above the mean sea level. Figure 18C illustrates the locations of the grid points, over which the height of LCL are shown in Figure 18A & Figure 18B. These are nine grid points surrounded the mountain peak. Three are east of the mountain, three are west of the mountain and there are at the same longitude as the mountain. The intensity of the winter monsoon winds over the coastal region is around 7 to 10 ms-1. Figure 19 shows the climatology (1979-2012) of January winds for this region. This illustration shows the streamlines and isotachs at the 850 hPa level. The flow field is from the northeast at an angle (30 degrees) with respect to latitude circle that is somewhat larger than those of the northeast trades (15 degrees) with respect to the eastward direction. The flow field in the Bay of Bengal, for individual undisturbed days is close to that of the climatological winter seasonal mean. The intensity of the winds of the northeast monsoon are between 5 and 10 m/s, for most of the undisturbed days (are quite close to the intensity of the northeast trades) shown in Figure 19. The topography of the southern India mountains is also included in Figure 19. A candidate hill that seems to encounter these winds is the Jawadhu hills of south India where the current seasonal rains are of the order of 5 inches per month. We shall be addressing these hills. A typical back trajectory, drawn eastward, from the Jawadhu hills towards the Bay of Bengal following the northeast monsoonal climatological flow for January (1979-2012) is shown in Figure 20. Using this climatological back trajectories, constructed from the mountains backward towards the Bay of Bengal, as a frame of reference, vertical cross section of relative humidity (Figure 21) and static stability (Figure 22) were constructed for days of undisturbed weather. Figure 21 illustrates the vertical cross-section of relative humidity (%) on four different undisturbed days (12 Nov, 2011, 20 Nov, 2011, 21 Jan, 2012 and 22 Jan, 2012). This illustration has latitude/longitude locations from the Jawadhu hill along the abscissa and pressure as the ordinate. What stands out is the marine moist layer with relative humidity in excess of 80 percent below the 900 hPa level in the marine layer and dry air aloft with relative humidity below 30 percent above the 750 hPa level generally. It is this marine air that gets saturated during an orographic ascent if the flows and the shape and orientation of orography calls for a large disposition of supersaturation. Similar cross sections of static stability for the above selected days, following the climatological back trajectories of the Bay of Bengal, are shown in Figure 22. Below the 800 hPa level these cross sections are quite similar to the Pacific trades that were shown in Figure 9. That implies that upstream from the Jawadhu and the Waialeale, the base of the inversion and the stable layer are quite similar for the northeast monsoons and the Pacific trades. This region where the streams of stratocumulus for the two Oceans are noted lie below the 850 hPa level, which the region of interest for this study. The upper tropospheric structure of the static stability over the Bay of Bengal shows more variability from case to case as compared to the Pacific trades near Hawai’i. That difference could be attributed to the lower latitude of the sub-tropical jet stream near Hawai’i (near 15N) as compared to the location of the subtropical jet stream over India (near 22N).41 Near the subtropical jet the upper tropospheric stability is less variable as compared to regions away from the jet. Two satellite images, from the polar orbiting NASA satellite TERRA/MODIS (Figure 23) illustrate the stratocumulus clouds over the Bay of Bengal, during undisturbed days of the northeast monsoon. These are typical images of the streams of stratocumulus that impact southern India.


The key elements in the modeling are in the handling of the orographic ascent of the moist marine boundary layer air and in the simulation of a reasonable population of stratocumulus/fair weather and towering cumulus clouds from a cloud resolving high resolution model. In this study, three types of numerical experiments with the WRF/ARW were carried out:
The above experiments utilized the USGS tabulations of topography that were available at the resolution of 200 meters. Waialeale and the Jawadhu are somewhat similar; the maximum heights of Waialeale and Jawadhu are around 1.5 and 1.2 km respectively. The major difference, however, is in the current wind facing shape and slopes of the two mountains.
The rotation of a mountain follows two steps
The solid body rotation of the front face of the Waialeale is accomplished by the following:
If q is the initial angle and f is the angle of rotation, then
(4)
(5)
(6)
(7)
Hence:
(8)
(9)
After such a solid body rotation those values are read off on the original grid using a univariate objective analysis.42
This entails the following steps:
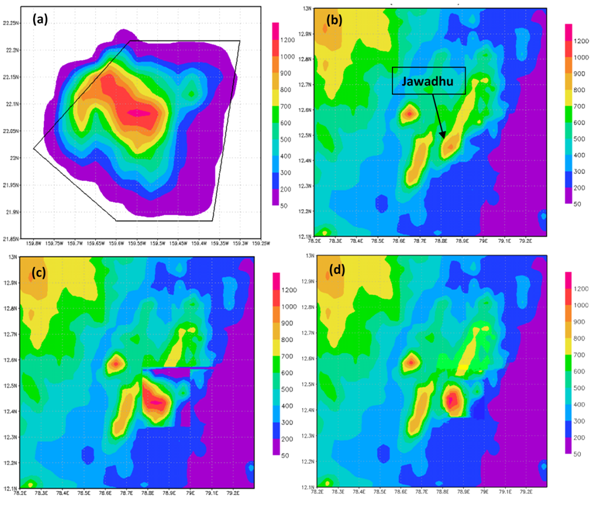
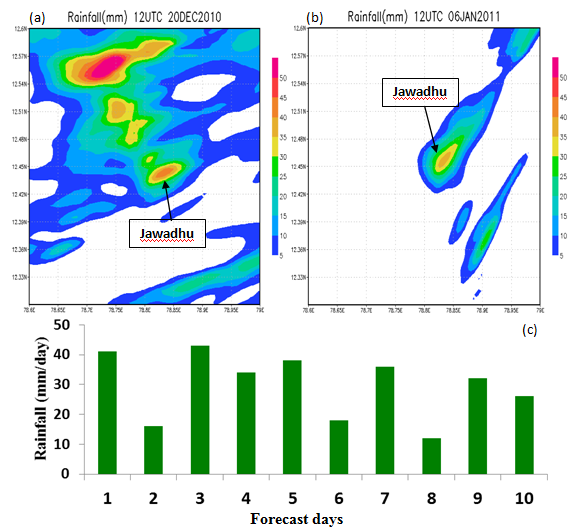
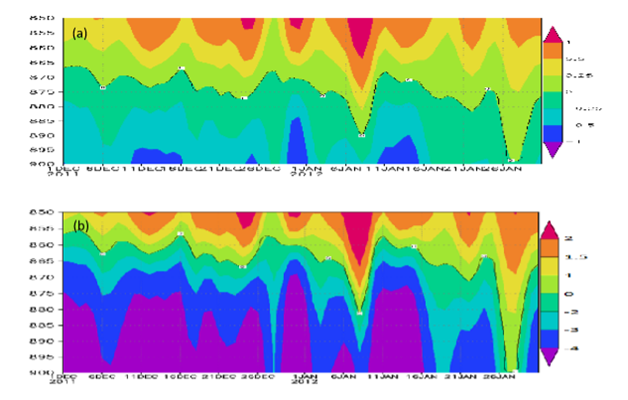
This essentially interpolates the rotated elevation back on the original grid. In this study we discuss the results from placing the full Waialeale and a rotated windward face of the Waialeale for the windward face of the Jawadhu. Figure 24D shows the topography of the replaced Jawadhu hill after rotation of the windward face of the Waialeale, the numerical windward face looks like a smoothed version of Figure 1B this was carried at a horizontal and vertical resolutions of around 500 meters. The first experiment where the original Jawadhu was used did not provide any rains for selected undisturbed days, and these forecasts were in agreement with no observed rains. The second experiment where the entire Waialeale replaced the Jawadhu, without any effort at orientation to winds, produced some rains up to 0.5 to 1 inch for the same selected undisturbed days with no rains (not shown here). The results were similar for a series of experiments where the windward face of Waialeale was placed in front of Jawadhu with no effort to orient it perpendicular to the seasonal trade winds. Next we shall illustrate results when the windward face of the Waialeale was ported to provide a rotated windward face for the Jawadhu hills. Here the windward face is perpendicular to the Bay of Bengal’s climatological winter monsoon flows. Some examples of day one predicted rains (utilizing this rotated front face of the Jawadhu hill) for undisturbed days when no observed rains were noted on those days, are illustrated in Figure 25. In both these examples, the model predicted rainfall amounts between 30 to 50 mm/day (inch to an inch and a half of rain per day). These large rains from these forecasts were located in roughly the same geographical location with respect to the rotated windward face of the Jawadhu hills. These results are attributed to the presence of very moist marine layer of the Bay of Bengal (with relative humidity often in excess of 85 percent) and a low inversion base near 500 meters, carrying a plethora of stratocumulus streams (that were resolved by the model at the 500 meter horizontal and vertical resolutions) towards the Jawadhu hills. Figure 25C illustrates the results of day 1 forecasts of rainfall at the Jawadhu hill site (at one grid point) for selected 10 undisturbed days during November-January 2010-2011. These show rainfalls of the order of 30 to 50 mm/day (one to two inches per day) on days when there were no observed rains. The time history of the triple product for the Waialeale and the winter monsoon region before and after the deployment of the windward face was a critical element in going from zero rains to heavy rains. The triple product’s evolution with the two versions of the Jawadhu hills is quite revealing for the production of heavy rains. Examining this vertical distribution for the Waialeale slopes it was noted that the largest contribution to the disposition of supersaturation is found between the LCL and the base of the inversion for orographic rains for the inversion capped marine clouds. Figure 26A & Figure 26A shows time sections of the vertical distribution of the triple product over the original Jawadhu hills and the modified Jawadhu hills where the windward face of the rotated Waialeale Mountain was inserted respectively. Figure 26A shows that the vertical distribution of the triple product carries rather low values, implying hardly any rains from the disposition of supersaturation over the original Jawadhu hills. When the Jawadhu hills carries the rotated windward face of Waialeale (Figure 26B) then a robust heavy rain possibility is noted. These differences arise primarily from the differences in the slopes, at different locations of the new windward face, of these mountains between the lifting condensation level and the base of the inversion. The other two factors for the triple product, i.e. the vertical gradient of saturation specific humidity and the winter monsoon winds were identical for these two representations initially at time zero of the start of integrations. Since the vertical integral of the triple product above the lifting condensation level, denotes the total rain, it is clear that very moist air of this region, with a low lifting condensation level, near 0.5 km, can in principle, produce very heavy rains at the Jawadhu hills. This was the finding from the porting and placing of the rotated front face. This also points out that a very huge amount of near saturated water vapor resides in the marine layer of these oceans with stratocumulus streams that can be tapped. These experiments strongly suggest that having a right shape of the windward side of the mountain in an environment with relative humidity of the order of 85 percent or larger and a low LCL like 500 meters can generate heavy rains.
Over the region of the Jawadhu hills a possible geo-engineering exercise could provide some practical utility for helping the water shortage problem for the city of Chennai in south India. The greater Chennai city has a population of around 15 million people. They currently use roughly 1200 million liters of water a day, and have a water shortage of nearly 215 million liters/day.43 Figure 27A illustrates a map of the Chennai’s four major water reservoirs, (Red hills, Cholavaram, Chembarambakkam, and Poondi Lake). These convey water to this city. Three of these reservoirs are all interconnected and convey water to the city through the Red hills reservoir. It is suggested that a water holding reservoir, open walled area, at an elevation of around 500 to 600 meters near the Jawadhu hills could be useful for rain harvesting. This holding area (not shown here) would occupy roughly a four square mile area, where the model showed persistent rains. This holding area is being proposed to connect via a pipeline (Figure 27B) to the Poondi Lake Reservoir; Poondi Lake is at an elevation of only 60 meters (Figure 27C) above sea level. The pipe line, would in principle, gravitationally convey the water from the Jawadhu water holding tank (at 600 meters above sea level) to the Poondi Lake (at 60 meters above sea level). Our computations for an entire winter monsoon season (November 15 through March 30) suggest that it would be possible to harvest as much as 400 million liters per day of rain on undisturbed days. It was noted that nearly 80 percent of days, during the 4 month period, carry undisturbed weather. This type of practical utility of rains from an artificially built windward face of a mountain in such marine environments deserves further studies.
The important finding here is that the moist marine layers of the trades and the monsoon carry a huge amount of water vapor that can be deposited as heavy rains if flows encounter the right type of a mountain. This was noted in the Hawaiian chain of islands where the windward face of Waialeale provided record annual rains. The other island of the Hawaiian chain saw an order of magnitude less annual rain. From a total of around 450 inches/year rainfall at Waialeale nearly 50 percent of this rainfall is contributed on undisturbed days. The special shape of the Waialeale mountain contributes to the heavy rains from the ascent of trade winds that carry a stream of stratocumulus and cumulus clouds. The base of the inversion that translates roughly to the level of the tops of these clouds is located near 900 meters above sea level and the cloud base is roughly located between 400 and 600 meters above sea level. The relative humidity of the air is generally between 80 and 90 percent in the marine layer of the undisturbed Pacific trades near the Hawaiian Islands. A value of the Baines number (i.e., (B*H)/U) less than one suggests the possibility for air flow over the Waialeale mountain. Another more important parameter is the vertical distribution of a triple product (upwind mountain slope times the wind normal to the windward face of the mountain times the vertical gradient of saturation specific humidity). That triple product carries a large value between the lifting condensation level (the approximate cloud base) and the base of the inversion (approximate location of the cloud top). Large values of this triple product denotes large disposition of supersaturation as rain. For the warm cloud microphysics that product denotes a direct transformation from the vapor to the liquid phase. Numerical modeling with a cloud resolving model, that utilizes a horizontal resolution of 0.5 km mesh size, was used to address a string of one day forecasts for undisturbed days for the Waialeale region. It was possible to replicate the observed heavy rains in that region for an entire month on a daily basis. One day forecasts, centered on the day of measurements, are easy to carry out since only very large scale undisturbed trades are in the picture and one is not dealing with typhoons or mesoscale weather systems. Looking around the trade and monsoon world several other regions showed a plethora of streams of stratocumulus and very moist marine layers. These regions did not carry a proper orientation of winds to the local mountains and also lacked a proper slope for the mountain, thus no rains were noted on undisturbed periods. One such candidate mountain, that was selected, was the Jawadhu hill west of Chennai city in India. The northeast monsoon winds of the winter monsoon of India bring in moist stratocumulus streams to these mountains but almost no rains are noted on undisturbed days. For nearly four and a half months the northeast monsoons carry northeasterly flows with roughly 79 percent of days with undisturbed weather and almost no rains.
The cloud base and the cloud top for this region are quite similar to those of the Waialeale region and the marine layer nearly always carries moist monsoonal flows with relative humidity in excess of 80 percent. With the current configuration of the Eastern Ghat mountains of southeastern India no observed rains are noted on most undisturbed days. The region around the Jawadhu hills is no exception in this regard. This study concludes with a possibility for geo-engineering exercise for redesigning the windward facing slope of the Jawadhu hills. Here we successfully used a windward facing rotated front face of the Jawadhu hills to mimic the Waialeale mountains, that resulted in an enhancement of the model rains from zero (from the original Jawadhu hills) to almost an inch to an inch and half per day (from the engineered Jawadhu hills). This placement of a windward face of a mountain is possible for numerical modeling because of the availability of the USGS global topographic data at very high resolution (200 meters). The modeled rains occur on most undisturbed days over a small geographical region. This suggested the possible construction of a holding reservoir around the rain area which could be used for rain harvesting. The holding tank is proposed for connection to an existing water reservoir of the City of Chennai. That reservoir, called Poondi hill, currently supplies water to the Chennai city. The water shortage problem, at Chennai, was a motivation for studying this possibility. The back of the envelope costs for this enterprise could be as high as 170 million dollars for the construction of the front face of the Jawadhu hills, the holding tank and the laying of a pipe line. Considering the current population of around 15 million people in Chennai city and its suburbs, this does not appear to be an impossible proposition.
This work was supported by a Ministry of Earth Sciences Government of India Grant (No. MM/SERP/FSUUSA/2013/INT-8-00) and NASA/PMM grant No. NNX16AD83G.
None.
Authors declare there is no conflict of interest in publishing the article.

©2017 Krishnamurti, et al. This is an open access article distributed under the terms of the, which permits unrestricted use, distribution, and build upon your work non-commercially.