International Journal of
eISSN: 2576-4454


Research Article Volume 4 Issue 5
1Formerly with Bioproducts & Biosystems Engineering, University of Minnesota, now at Ecosystem Connections Institute, USA
2Bioproducts & Biosystems Engineering, University of Minnesota, USA
3Ecosystems Connections Institute, USA
Correspondence: Joe Magner, Bioproducts & Biosystems Engineering, University of Minnesota, St. Paul, Minnesota, USA
Received: October 11, 2020 | Published: October 1, 2020
Citation: Manifold H, Magner J, Sweeten J. Estimating nitrogen inputs, storage, and exports for a small watershed in the upper Mississippi river basin, USA. Int J Hydro. 2020;4(5):229-237. DOI: 10.15406/ijh.2020.04.00249
Nitrogen contributions to the Gulf of Mexico hypoxic zone from agriculture watersheds are well documented. Beargrass creek watershed a 5,985hectare agriculturally dominated watershed in northern Indiana was instrumented to collect water quality data. A nitrogen budget was developed to account for net input and export of nitrogen from the watershed. Inputs consisted of fertilizer application, soil mineralization, and atmospheric deposition. Exports consisted of nitrogen removal in grain and stream exportation. Water quality testing at two gage stations, fourteen access tubes, and nine drainage tiles determined where excess nitrogen was stored. Nitrogen inputs was estimated at 1,004,213kg/year or 168 kg/ha/year in 2015. Total nitrogen exports accounted for 860,250kg/ha or 144kg/ha/year: with 30% of the applied nitrogen removed by Beargrass Creek through baseflow, tile flows, and storm event runoff.
Keywords: nitrate-nitrogen, agriculture, budget, water quality
Anthropogenic changes in ecosystems to support growth in human populations have occurred since the arrival of European settlers in North America1-4 These changes include drainage of wetlands, conversion of prairies, and deforestation of old growth forest for use in row crop agriculture.5 Currently, agriculture production requires large nutrient inputs (nitrogen and phosphorus) in the form of fertilization to increased crop yields. These artificial levels of fertilizer practices have resulted in an increase of nitrogen and phosphorus exports from agricultural landscapes which have created widespread effects on water quality in coastal and freshwater ecosystems.6 Agriculture runoff from the Mississippi River basin has tripled the amount of nitrogen transported to the Gulf of Mexico since 1970.7-9 As a result, an increase in primary productivity in coastal waters has occurred and additional algal biomass has been produced driving bacterial decomposition and subsequent depression of dissolved oxygen levels.10 Combination of summer stratification and decomposition of organic matter has led to large expanses of the Gulf of Mexico sea floor to be void of life with dissolved oxygen concentration,<2 milligrams per liter (mg/L) (hypoxia).11-14 With an average size of 14,500 square kilometers from 2004 through 2013, the Gulf of Mexico has the second largest hypoxic zone in the world.15 Consequently, concerns about costal hypoxia has increased interest in defining strategies to reduce or retain nutrients in headwaters of contributing watersheds.9,16
Throughout agriculture regions of the Midwest United States, nitrogen pollution in surface and groundwater is a perennial concern.17,18 Prior to the utilization of large-scale commercial fertilizer applications, nitrogen was introduced into ecosystems through nitrogen fixation at a sustainable rate. Research conducted in native grasslands have documented that annual nitrogen exports average,<1kilogram per hectare (kg/ha/year).3,19 with nitrate concentrations from 0.01 to 0.39 mg/L (Dodds et al. 2000). With low concentrations and low annual exportation of nitrogen, these undisturbed grasslands exhibit tight nutrient spiraling and characterize how nutrients were utilized within native prairies ecosystems.3 Research conducted in intensively farmed regions of the United States have documented an annual export of nitrogen, >15kg/ha/year, with some values that exceed 40kg/ha/year.20 This increase in exports has doubled the amount of biologically active nitrogen in the natural ecosystem,2 with 75% of this increase for agriculture fertilization.21
To maintain intensive agriculture production, particularly corn, annual nitrogen applications rangebetween100 to 200kg/ha/year18 are required. Under ideal growth conditions approximately 50% of applied nitrogen is absorbed and stored within the harvestable grain.22,23 The remaining nitrogen pool is stored in the soil or residual biomass with some transported to surface waters.24,25 In order to better understand the dynamics of environmental nitrogen, budgets that measure inputs/exports within a landscape have been developed to quantify nitrogen interactions within a watershed.26-29 David and others18 documented a net storage of nitrogen within an agriculture watershed ranging between 50 to 111kg/ha/year where fertilization was the primary source of nitrogen; plant uptake within harvestable grain was the primary export. Stream transport of nitrogen was measured between 20 and 40kg/ha/year.18 Other research conducted on smaller agricultural watersheds have documented similar patterns with annual exports of nitrate though a stream channel between 21 and 50 kg/ha/year.23 Both studies concluded that subsurface tile drainage loads accounted for most nitrate inputs within agricultural streams.18,23
Subsurface drainage tile systems are necessary in many locations to manage water table depth for profitable agriculture production.5 By 1987 over 20 million hectares in the USA Midwest were artificially drained by subsurface tile drainage.30-32 High nitrogen concentrations in tile drainage have been documented since the late 1960’s, and currently subsurface drains are considered the primary source of nitrogen loading within the Midwestern Corn Belt.18 Jaynes and others33 documented annual nitrate nitrogen losses from subsurface tile drains to range between 4 and 66 kilograms per hectare (kg/ha)in an agricultural watershed. Other studies show similar results with nitrate-nitrogen concentrations in tile drainage that exceed 21mg/L and 30kg/ha/year.34 Jaynes and others35 found similar result in an Iowa watershed with nitrate concentrations that ranged from 5 to 45mg/L. Likewise, on a 40hectare field in central Illinois,nitrate-nitrogen concentration in tile drainage water ranged from <10mg/L to 49mg/L.36 These studies clearly documented an increase in exportation of nitrogen from tile drainage systems.34-37
While effects of tile drainage are well documented as they relate to nitrogen budgets in agricultural watersheds. The use of nitrogen budgets has not been adequately utilized to develop relevant management tools for reduction of nitrogen loads. The studies did not fully examine the efficacy of conservation practices and the precision of spatial location for greatest nitrogen reduction potential. The objectives for this study including estimating a nitrogen budget for Beargrass Creek watershed and to analyze budget data along with other nitrogen datasets from within the watershed to estimate the spatial distribution nitrogen.
Study Site. Beargrass Creek Watershed is a 12-digit hydrologic unit code (HUC) watershed located in Northern Indiana (Figure 1). Beargrass Creek drains 5,985 hectares into the Eel River which ultimately leads to the Gulf of Mexico. Like other Midwest watersheds, Beargrass Creek is predominately row crop agriculture (85%). In 2015, corn and soybean rotations dominated the land scape with 38% and 39% of total area in each crop, respectively. The remaining 15% of land use is small homesteads, roads, woodlots, and pastures. There are 13concentrated animal feed operations that include chickens, swine, and veal within the watershed boundary. Much of the manure from these operations is used as fertilizer within the watershed. Bear grass Creek is a well-studied 12-digit HUC with two water quality gage stations located within the watershed (Figure 2). One station is located near the confluence of the Eel River and collects data from the entire watershed (5,985ha) (40.942705°, -85.888076°). The upstream gage station ispart of a paired watershed study with a watershed area of1, 031 hectares (40.833714°, -85.778252°). Bear grass Creek Watershed is representative of many watersheds throughout Northern Indiana in slopes, soils, and surface/subsurface drainage systems. As part of the EDF CIG project we used ACPF to generate a map that was then used to talk with landowners about BMPs that could reduce excess nitrogen leaving farm fields.
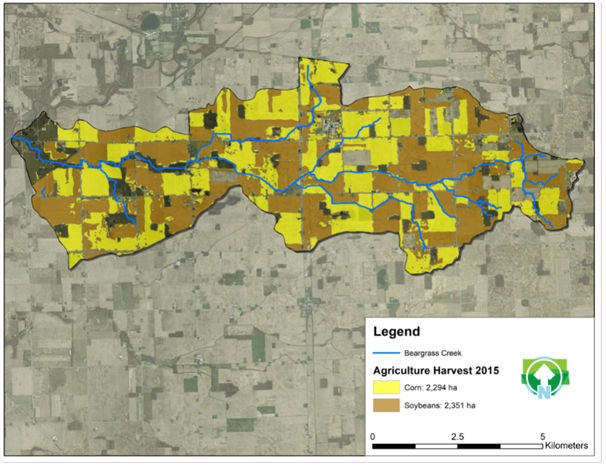
Figure 1 Extent of corn and soybean rotation within Beargrass Creek watershed. Corn represented by cross-hatched fields and comprised of 2,294 hectares. Soybeans represented by dotted fields and comprise of 2,351 ha.
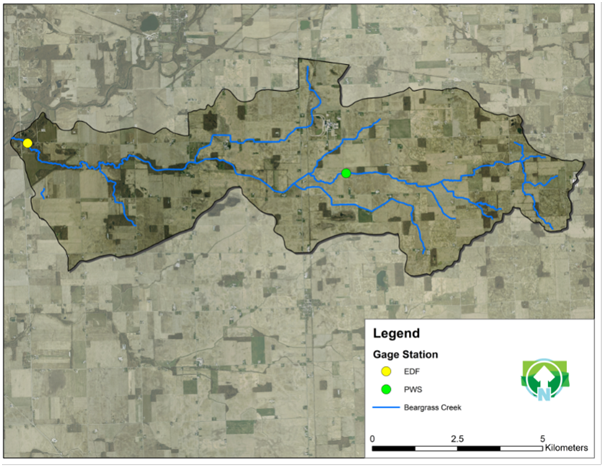
Figure 2 Spatial location of EDF (40.942705°, -85.888076°) and PWS (40.833714°, -85.778252°) stream gaging stations on Beargrass Creek. “G” represents EDF gage station and “^” represents PWS gage station.
Flow Calculations and Nitrogen Analysis. Stream flow was calculated from two separate gages stations within the watershed. The EDF is the most downstream gage and located near the confluence with the Eel River. The Paired-watershed gage (PWS) located 10kilometers upstream on the main stem of Beargrass Creek (Figure 2). Each gage station was equipped with sensors to monitor water level, precipitation, and air temperature on 15-minute intervals. Instantaneous stream discharge data was collected at various water level depths to construct a stage to discharge rating curve. All instantaneous stream discharge measurements were collected with an acoustical Doppler current profiler or a wading rod stream flow meter. Regardless of the discharge measurement method, United States Geological Survey protocols were used to insure accurate data collection. Discharge data was analyzed within Water Information Systems KISTERS (WISKI) program. Stage to discharge rating curve at both gage locations were calculated and analyzed within WISKI. Each rating curve was applied to the extent of water level measurements to obtain discharge data on a 15-minute interval.
Water quality data availability for the EDF gage was from June 2014 through July 2016 and from March 2013 through July 2016 for the PWS gage. During May and June agricultural activity increases, more intensive water quantity and quality sampling was conducted, along with in-stream biological communities sampling. Two automatic water samplers were installed at each gage station and collected water samples on a 4-hourinterval during May and June. During July through April, water samplers were programmed to capture the full extent of the first significant rainfall event (rise in water level). Grab samples were collected weekly during non-rain event periods from July through April of each year. In addition to gage station collections, samples from nine subsurface tile drains and fourteen water-table access tubes from across the watershed were collected on a monthly basis (July 2015 – June 2016) (Figure 3). Flow measurements were determined at each tile using a stopwatch and bucket. Where flow rate was equal to volume of bucket divided by time elapsed to fill the bucket. Access tubes were comprised of schedule 40 PVC pipe perforated at the bottom 0.5 meter with wrapped fabric to filter fine sediment; they were vertically installed in the ground between 1.5 to 2.5 meters in depth. The tubes provided access to water that infiltrated below the root zone and subsurface tile drains (Figure 4). 1.5-meter soil profiles were examined at each access tube location to estimate soil structure and water pathway characteristics.
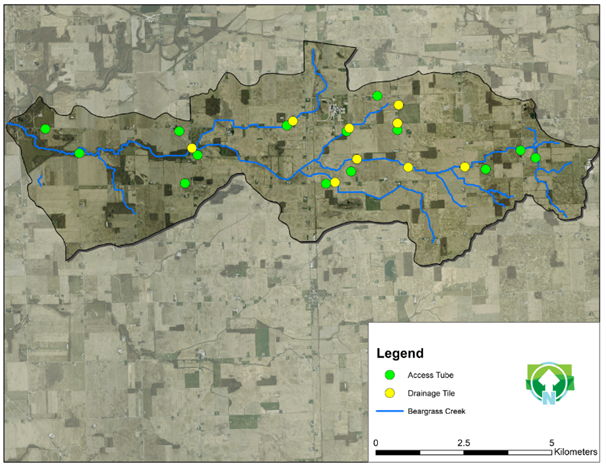
Figure 3 Spatial representation of sampled nine drainage tiles and fourteen access tubes throughout Beargrass Creek watershed.

Figure 4 Example of access tubes (stripped line) for shallow water table access below plant root zone and subsurface tile drain (dotted) shown in Figure 3.
Manchester University water quality laboratory was used for analysis of water samples. Each sample was analyzed within 24-hours as part of the Quality Assurance Project Plan. Nitrogen concentrations were determined using a Hach Simplified TKN TNT-800 colorimetric test, with a range of 0-16 milligrams per liter (mg/L). Dilution with distilled water was required to accurately measure high concentration samples. Each sample was analyzed for total nitrogen (TN), nitrate-nitrogen (NO3-N), and total Kjeldahl nitrogen (TKN) with an estimated standard error (SE).
Nitrogen Inputs, Storage& Exports. Nitrogen budgets help determine net gain or loss of nitrogen within the watershed. Sources of nitrogen within a watershed consist of fertilizer application (manure and commercial), atmospheric deposition, and soil mineralization. Producer surveys were conducted to determine rate of nitrogen application from both commercial and manure fertilization for crop year2015. Application rates were verified with local Natural Resources Conservation Service district conservationists. Only corn fields received nitrogen fertilization. Anhydrous ammonia was applied at a rate of 246 kg/ha and nitrogen application rates for manure was 207 kg/ha. Atmospheric deposition of nitrogen occurs across the watershed regardless of land use type. Atmospheric deposition data was obtained from the National Atmospheric Deposition Program (NADP) site located at Roush Reservoir approximately 30km southeast of the watershed.38 Data was not available for 2015, thus the sum of a 10-year average of ammonium (NH4) and NO3-N deposition was used to estimate a rate of 15.6 kg/ha/year nitrogen deposition. Soil mineralization rates were not directly measured within the watershed; while soil mineralization rates are difficult to determine and can vary from site to site, these input rates are crucial for an accurate nitrogen budget and were estimated from literature review. David and others18 found soil mineralization rates of 88kg/ha/year under soybeans and 133kg/ha/year under corn in an intensively managed agriculture watershed in central Illinois. An additional 45kg/ha/year was added under corn due to breakdown of the previous year soybean root structure and stubble. Keeney and De Luca26 estimated that soil mineralization rates ranged between 40 and 120kg/ha/year. With no measured data to suggest soil mineralization rates within the watershed, a conservative estimate of 40 kg/ha/year under soybeans and 120 kg/ha/year corn was used to calculate soil mineralization inputs for this study. Further we did not measure nitrogen fixation from legume inputs in this budget. Nitrogen input from fixation was assumed to be stored in plant biomass. Soil mineralization accounts for the breakdown of soybean biomass in subsequent years. The largest weakness of this study was understanding what was being stored at any given time.
Nitrogen exports from the watershed occurred in grain harvest, stream transport, and denitrification. Removal of nitrogen in harvested corn and soybean grain was calculated using nitrogen concentration per yield data. David and others18 documented that 1.6% of the corn yield and 6.4% of the soybean yield was nitrogen. Gentry and others23 found similar results; annual uptake of nitrogen was 1.44% in the corn yield and 6.4% in the soybean yield. Estimates of 1.6% and 6.4% for exportation of nitrogen though corn and soybean grain respectively were used in Beargrass Creek watershed. Yield data for corn and soybeans was obtained from United States Department of Agriculture quick stats as bushels per acre and converted to kg/ha for Wabash county Indiana.39 With a homogenous landscape throughout much of Wabash County, yield data was determined to be representative of the watershed. Communication with local producers within the watershed verified average yields for each crop. Yield data was combined with percent nitrogen within the grain to determine total export of nitrogen though the harvested grain. Total nitrogen accumulation within the soybean grain was a combination of two sources, soil uptake and nitrogen gas (N2) fixation. While N2 fixation by legumes was not directly measured within the watershed, an estimation of the nitrogen contribution to soybean grain from N2 fixation can be determined from previous research. Studies in Midwest states have documented that 50% of the nitrogen in soybean biomass can be contributed to N2 fixation, and the remaining 50% can be contributed to soil uptake.40 Thus, total nitrogen export from soybean grain was reduced by half to account for only nitrogen uptake from soil.
Data from Beargrass Creek EDF gage station was used to calculate total export of nitrogen from the watershed though the stream channel. Daily nitrogen load calculations were completed by multiplying the flow-weighted mean concentrations by daily mean flow for 2015. Annual exportation of nitrogen from Beargrass Creek was the sum of all daily exports. Denitrification rates were not measured in this watershed and are not considered within the budget. Denitrification rates in agriculture landscapes have been documented to range between 3 to 32kg/ha/year.41 Soil pH, percent organic carbon, fertilizer type, application rate, and soil drainage all affect denitrification rates; rates are difficult to estimate for an entire watershed. Beargrass Creek watershed is extensively drained and managed which allows minimal opportunity for natural denitrification to occur. Rates of denitrification do not affect the purpose of this research other than BMPs will be required to enhance watershed wide denitrification.
Stream flow and precipitation
Stream discharge varied seasonally at both gage stations with the lowest flows being documented during late summer and the highest flows in late spring (May and June). Mean stream dischargeatthe EDF gage station was 0.66 cubic meters per second (m3/sec) (SE 0.05) from June 2014 through July 2016. The maximum daily discharge was 15.5m3/sec and a minimum discharge of 0.003 m3/sec (Figure 5). Mean discharge varied slightly in 2015 with a mean of 0.85m3/sec (SE 0.10) (Table 3). Beargrass Creek PWS gage station had similar hydrographs when compared with the EDF gage. Mean stream discharge at the PWS gage was 0.08m3/sec (SE 0.008) from April 2013 through July 2016. With a maximum of 3.8m3/sec and no discharge record periodically though the study (Figure 6). Stream discharge at the PWS station for 2015 had a mean discharge of 0.10m3/sec (SE 0.01) (Table 3). Both EDF and PWS gage stations responded quickly to precipitation events with a spike in the hydrograph and return to base flow quickly (Figures 5&6). Precipitation was steady throughout 2015.Seasonal precipitation trends and stream trends typically tracked together, with the highest precipitation events documented in late spring (Figures 5&6). A maximum rainfall event of 53millimetres (mm) was documented on June 27, 2015 at the EDF gage station and 66 mm on June 16, 2015 for the PWS station. Tile-drain flow varied throughout the watershed with values ranging from 0.2 L/sec up to 2.94L/sec (Figure 7). Tile-drain 100E-2T consistently had the highest flows with an average of 1.85L/sec (SE 0.25) (Figure 7).
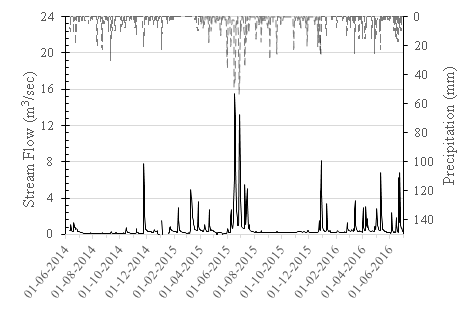
Figure 5 Beargrass Creek EDF gage station stream flow (solid line) primary Y axis. Daily precipitation at EDF gage (dashed line) secondary Y axis.

Figure 6 Beargrass Creek PWS gage station stream flow (solid line) primary Y axis. Daily precipitation at PWS gage (dashed line) secondary Y axis.

Figure 7 Discharge calculated for each subsurface Tile-drain (L/sec) at time of grab sample collection. Flow was calculated using a stopwatch and bucket method.
Stream Nitrogen analysis and load calculations
Total Nitrogen concentrations within Beargrass creek varied seasonally with high concentration peaks documented in the spring (Figure 8). Mean daily TN concentrations range from 1.15 to 39.7mg/L at the EDF gage (Figure 8). Typically, concentrations ranged between 8 and 12mg/L (Figure 9). To estimate nitrogen load, flow weighted TN means were calculated; from 2014 to 2016 the TN flow weighted mean at the EDF station was 11.58mg/L (SE 0.03), while in 2015 flow weighted mean was calculated to be 11.35mg/L (SE 0.06) (Table 2). The upstream PWS gage station showed similar concentrations with values that ranged from 0.85 to 46.8mg/L (Figure 8). However, concentrations were generally higher than the EDF gage and ranged from 10 to 17mg/L (Figure 9). Flow weighted TN means were calculated to be 10.6mg/L (SE 0.41) for 2015 and 11.24mg/L (SE 0.17) for 2013 thru 2016 at the PWS gage (Table 2). Tile-drains were sampled to estimate subsurface nitrogen exportation from the watershed; TN concentrations ranged from 3.9 to 38.7mg/L in nine sampled tile-drains. The highest mean concentration of 28mg/L (SE 4.05) was at the 100E-2T site, while the lowest mean concentration of 6.4mg/ L (SE 0.56) was at the 800N-1T location. Tile-drains were consistently greater than the EDF TN flow weighted mean (Figure 10). Access tubes provided some insight into the interaction of nitrogen and the soil below the root zone.42 Soil profiles suggested poor drainage in the upper one-meter of the soil column at each location. Soil structure at 11 of the 14 access tube sites showed secondary flow paths based on soil structure at one-meter depth with clear redox features, suggesting the potential for denitrification. Access tubes consistently contained water with only 6% of wells dry on the date of sample collection. Total nitrogen in access tubes averaged 5 mg/L (SE 4.8), with a range of 0.3 to 63.6mg/L across all sites. Individual access tube total nitrogen means ranged between 1.77 (SE 0.46) to 12.18 (SE 4.66)mg/L. The majority (93%) of the samples collected from the access tubes were less than the flow weighted mean threshold of 11.35mg/L of nitrogen.
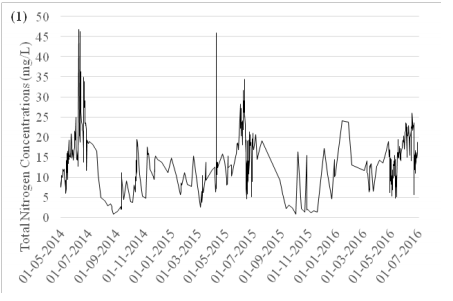
Figure 8 Daily total nitrogen concentrations (mg/L) for Beargrass PWS (1) and Beargrass EDF (2) stream gage stations, from May 2014 – July 2016.
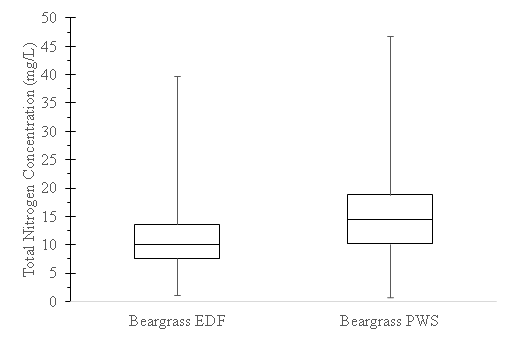
Figure 9 Box-Whisker plots of total nitrogen concentrations (mg/L) at the EDF (n=717) and PWS (n=771) stream gage stations.
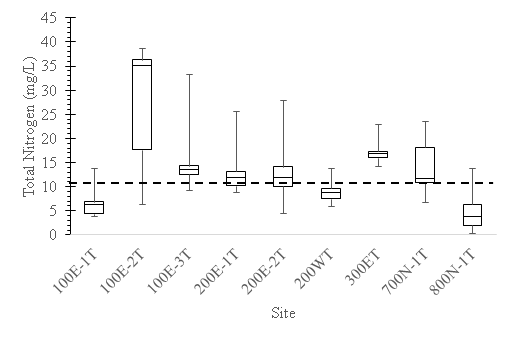
Figure 10 Box-Whisker plots of total nitrogen concentration in tile-drains, where the dashed line represents the EDF gage station total nitrogen flow weighted mean (mg/L) for 2015.
|
Total Nitrogen kg/ha/year |
Source |
|
|
Manure |
207 |
Producer Survey |
|
Commercial |
246 |
Producer Survey |
|
Atmospheric |
15.6 |
NADP |
|
Soil Mineralization |
Corn: 120 |
Keeney and DeLuca (1993) |
|
Soybeans: 40 |
Keeney and DeLuca (1993) |
Table 1 Nitrogen inputs into Beargrass Creek Watershed with source identification
|
|
EDF |
PWS |
||
|
TN 2015 (mg/L) |
TN 14-16 (mg/L) |
TN 2015 (mg/L) |
TN 13-16 (mg/L) |
|
|
Flow Weighted Mean |
11.35 |
11.58 |
10.6 |
11.24 |
|
Standard Error |
0.06 |
0.03 |
0.41 |
0.17 |
|
N |
250 |
717 |
221 |
771 |
Table 2 Flow weighted total nitrogen concentration for the EDF and PWS stream gage stations in 2015 and for entire dataset per each gage station
Water transported loads
Nitrogen loads from Beargrass creek vary based on concentration and flow. Load calculations were only completed on the 2015 data for development of a nitrogen budget for one calendar year. The EDF gage showed the highest nitrogen loading within the watershed with an average of 832kg/day (SE 101). Total nitrogen loads per day ranged from 0kg/day during base flow conditions up to 15,189kg/day during flood events (Figures 11& 12). Annual total nitrogen exportation was calculated at 303,680kg and when distributed evenly across the watershed was estimatedat50.74kg/ha/year exported by the creek to the Eel River (Table 4).The PWS gage saw similar nitrogen exports with an average daily export of 94kg/day (SE 17.17). TN exportation rates ranged from 2.59kg/day up to 3,042kg/day (Figure 13). Total nitrogen export from the PWS gage was calculated to be 30,463kg/year, or 33kg/ha/year. There appears to be an order of magnitude change when scaling up from the PWS gage to the EDF gage. Precipitation with sufficient magnitude likely drove increased stream discharge which exported the majority of the annual nitrogen load; where72 days exported 75% of the total annual nitrogen at the EDF gage and 25days at the PWS gage, respectively (Table 3).Tile-drainage has an important cumulative impact on nitrogen loading to the stream. TN loading rates varied amongst sites and ranged from 0 kg/day to 9.8kg/day. During multiple precipitation events, tile 100E-2T produced up to 1/5 of the total nitrogen load at the PWS gage site.
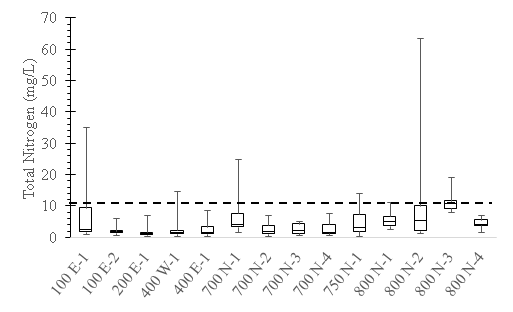
Figure 11 Box-Whisker plots of total nitrogen concentrations (mg/L) in access tubes, where the dashed line represents the EDF gage station total nitrogen flow weighted mean (mg/L) for 2015.
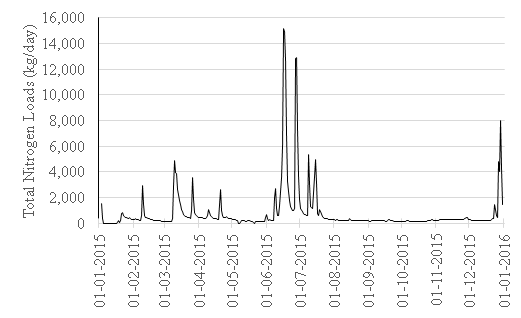
Figure 12 Daily total nitrogen loads (kg/day) exported from Beargrass Creek EDFstream gage station for calendar year 2015.

Figure 13 Daily total nitrogen loads (kg/day) exported from Beargrass Creek PWS stream gage station for calendar year 2015.
|
|
EDF Gage |
PWS Gage |
|
Mean Flow (m3/sec) |
0.84 |
0.10 |
|
TN Load (kg/year) |
303,680 |
30,463 |
|
Days to 75% of TN export |
72 |
25 |
Table 3 Flow weighted means (mg/L), total nitrogen loads (kg/year), and number of days to export 75% of the total nitrogen load at the Beargrass Creek EDF stream gage and PWS stream gage
|
Total Nitrogen kg/ha/year |
Total Nitrogen kg/year |
|
|
Manure |
207 |
125,649 |
|
Commercial |
246 |
415,846 |
|
Atmospheric |
15.6 |
93,366 |
|
Soil Mineralization |
Corn: 120 |
275,580 |
|
Soybeans: 40 |
94,072 |
|
|
Total Input |
168 |
1,004,213 |
|
Grain Removal |
92 |
556,570 |
|
Beargrass Creek |
51 |
303,680 |
|
Total Export |
144 |
860,250 |
|
Nitrogen Budget |
24.05 |
143,962.5 |
Table 4 Annual total nitrogen budget calculated for Beargrass Creek watershed(40.942705°, -85.888076°) in Northern Indiana in kilograms per hectare per year and total kilograms per year
Budget considerations
Over 32million liters of liquid manure was used as fertilizer within Beargrass Creek watershed in 2015. Total nitrogen was 0.39% manure by volume and was applied at a rate of 207kg/ha across 607 hectares. Corn received all commercially applied nitrogen within the watershed at a rate 246kg/ha. Fertilization was the primary nitrogen input with 125,649kg/year applied in manure, and 415,856 applied though use of commercial fertilizer such as anhydrous ammonia (Table 4). A 10-year average of NH4 and NO3-N atmospheric deposition of 15.6kg/ha/year (SE 0.85) was used to calculate load input from the atmosphere. Atmospheric deposition is deposited during precipitation events across the watershed. In 2015 atmospheric deposition accounted from 93,366kg of nitrogen applied within the watershed (Table 4). Soil mineralization under corn and soybean proved to be an important nitrogen input. Rates of soil mineralization were estimated from the literature review to be 120kg/ha under corn fields and 40kg/ha under soybeans fields. Land use was comprised of 2,294 of corn and 2,351hectares of soybean in the watershed. Annual soil mineralization in 2015 was calculated under corn to be 275,580kg and 94,072kg under soybeans (Table 4). Soil mineralization was equal to 68% of the applied commercial and manure fertilizer; this is clearly a large nitrogen storage component of the budget. An annual total nitrogen input for 2015 was calculated at 1,004,213kg, which equates to 168kg/ha (Table 4).
Net nitrogen removal was assumed to be the sum of nitrogen removal in grain and exportation by Beargrass Creek. Corn and soybean yields were 8,493kg/ha and 3,254kg/ha, respectively. Average nitrogen content per yield for corn was 1.6% and 6.4% for soybeans. The annual removal of nitrogen in the corn grain in 2015 was 136kg/ha and 208kg/ha for soybean. Soybean removal rates were reduced by half to account for 50% of the biomass being attributed by N2 fixation and the other 50% being attributed by plant uptake. N2 fixation in grain accounted for a nitrogen removal rate in soybean yields of 104kg/ha. Nitrogen removal in corn grain was calculated at 311,984kg, with a soybean removal rate of 224,586kg. Together we estimated corn and soybean effectively removed 556,570kg of nitrogen from the watershed and was the leading export pathway (Table 4). We estimated, based on data presented in the results, stream removal of nitrogen at the EDF gage was 303,680kg/year (Table 4). Thus, total estimated annual exportation of nitrogen from the watershed was calculated to be 860,250 kg or 144kg/ha/year (Table 4). A positive net gain of nitrogen was observed in the Beargrass Creek watershed in 2015. With annual inputs of 1,004,213 kg and exports of 860,250 kg the net storage of nitrogen within the watershed was 143,962 kg or 24kg/ha/year (Table 4). The net nitrogengain was estimated to come from plant biomass, soil storage, and any possible denitrification. Nitrogen exports from the watershed account for ~85% of total nitrogen inputs, with stream exportation accounting for ~30% of all nitrogen inputs.
Nitrogen budget
The Beargrass Creek watershed nitrogen budget is comparable with other studies conducted in agriculture watersheds throughout Midwestern states. With corn and soybeans as the most prevalent agricultural crops, annual total nitrogen inputs were 168kg/ha/year, and exportation rates were 144kg/ha/year. Gentry and others26 found similar results with an annual input of 158kg/ha/year and annual exportation of 152kg/ha/year. Likewise, David et al.18 found that annual fertilization application rates along with wet deposition and soil mineralization led to nitrogen inputs up to 200kg/ha/year, and annual exportation rates up to 146kg/ha/year. Soil mineralization was a key contributor to nitrogen within the watershed and likely accounted for up to 369,352kg/year of nitrogen. Both David et al.18 and this study show soil mineralization loads were 66-68% of applied fertilizers loads. Fertilization practices have increased rates over the past decades; both David el al.18 and Gentry et al.26 found fertilizer application rates up to 197kg/ha/year and 184kg/ha/year, respectively. Whereas this study documented fertilizer rates of 246kg/ha/year. Even though an increase of 60kg/ha/year in nitrogen application occurred, net nitrogen did not appear to show a response in nitrogen export via the stream.
Increased efficiency of grain uptake combined with greater in stream nitrogen processing may account for theme assured results even though fertilizer application was relatively high. Previous research has documented grain uptake of nitrogen can range between 43% to 61% of applied fertilizers, with most studies documenting nitrogen uptake into grain less than 50% of applied nitrogen.18,22,26 Annual uptake of nitrogen in the harvestable grain in Beargrass Creek watershed exceeded these values and sequestered 556,570kg of nitrogen which represented 55% of total nitrogen inputs. With over half of the nitrogen input being exported by the harvestable grain. Storage in the watershed and exportation though the stream combines to account for the remaining 45% of the total nitrogen applied.
Beargrass creek exported about 30% of the total applied nitrogen from the watershed in creek flow. Flow weighted mean total nitrogen in Beargrass Creek of 11.35mg/L at EDF gage and 11.24mg/L at PWS gage were consistent with previous research that documented flow weighted means in an agriculture watershed to range between 10.2 and 14.8 mg/L.23 In the same study, nitrogen export per hectare ranged from 21 to 50kg.23 These values are consistent with this study which yielded 50kg/ha of nitrogen per year. We believe much of the nitrogen load being transported in the stream originated in subsurface tile drainage systems. TN mean concentrations in Beargrass creek tile-drains ranged between 6.39mg/L and 27.97mg/L. Data since the 1970’s have suggested large nitrogen losses in tile drainage with mean concentrations of 21mg/L and total exportation of 30kg/ha.27 David and others18 documented similar concentrations from tiles-drains that ranged from 5 to 49 mg/L. Likewise, Gentry et al.23 found that flow weighted mean nitrogen concentration ranged between 11.7 and 19.2mg/L in tile-drain flow. Their study concluded that stream nitrogen concentrations were related to tile-drain concentration and flow. Another study in Illinois, documented that high tile-drain flows were responsible for most watershed nitrogen losses, with high flows accounting for over 75% of the total nitrogen lost.38 During one precipitation event, tile-drain 100E-2T produced 1/5 of the total nitrogen observed at the PWS gage. This data suggest that tile-drain flows are likely the primary pathway for nitrogen transport to the stream. Other studies have documented similar concentration and loads exported form tile-drains.43,35
Stream exportation and drainage tile “leakage” of nitrogen have long been documented throughout Midwestern states. However, few studies have examined nitrogen concentration at1 and 3meters of soil depth. Research conducted on various crop rotations found a range of 1 to 16mg/L of NO3-Nat 1.2meters in depth.44 Access tubes in Beargrass creek showed similar results with a range of 0.3 to 63mg/L, with only three values that exceeded 20mg/L. Studies conducted within alfalfa fields show similar results to those conducted on corn/soybean rotation, with NO3-N concentration that range between 5 and 15mg/L.45 Access tube concentrations were consistently less (93%) than concentrations in the stream channel and tile flows suggesting denitrification processes were likely active at depths 1 to 2meters below the surface. Soil profiles for 7 of the access tubes contained redox features in the upper 2meters, suggesting saturation with a long enough residence/contact time with soil minerals to change soil color. Extended residence time of nitrogen rich water has been documented to be a significant variable in denitrification process.46 With water being held below theroot zone and/or tile-drain depth, conditions were ideal for increased rates of denitrification and would explain the lower concentrations of nitrogen found in the study access tubes.
The development of a nitrogen budget within Beargrass Creek watershed during the 2015 calendar year helped clarify the fate of nitrogen storage and loss. Nitrogen imports of manure application, commercial fertilizer application, soil mineralization, and atmospheric deposition were estimated and within other values reported in the literature. Nitrogen content of the harvestable grain and stream loading were the primary export of nitrogen from Beargrass Creek watershed. The study documented that >50% of the nitrogen applied through all forms were utilized by the cash crop and later removed from the system through harvest. Thirty percent of the total applied nitrogen was estimated to be leached through the soil profile into tile-drains and the stream channel. Nitrogen removed by the stream was calculated to be 50.74kg/ha. Strategies for targeted implementation of BMPs are needed to improve nitrogen reduction to the Gulf of Mexico. Ideally fertilization rates could be reduced to decrease the primary nitrogen input. However, ideal growing conditions were not present in 2015 and corn yields were less than a 10-year average. Below average grain yields lead to less than predicted nitrogen uptake into harvestable grain. Agriculture producers apply nitrogen based on predicted nitrogen needs of the crop and do not want fertilization to be the limiting factor of plant growth. While there are some opportunities to avoid leached nitrogen through nutrient management, other practices appear to be more suitable for Beargrass Creek. With improved soil health nitrogen can be stored in the soil and used by subsequent harvestable crops. This storage reduces the amount of nitrogen being leached into tile drain systems. With 30% of the cropland implementing winter cover in 2015, landowners were moving in the right direction.47
This project was funded by the Environmental Defense Fund, Indiana Corn Marketing Council, and Indiana Soybean Alliance. We would like to thank the following individuals and groups including Z. Lucas, J. Long, C. Huffine, J. Alexander and J. Tierney for their assistant with data collection and analysis, Manchester University Environmental Studies Program and the use of the water quality laboratory, and S. Stephan and the Soil and Water Conservation District of Wabash County for help with data collection. Most importantly we would like to express special gratitude to all the agricultural producers in Beargrass Creek Watershed for providing fertilizer application records and allowing installation of monitoring equipment on their properties.
Authors declare no conflict of interest exists.
None.

©2020 Manifold, et al. This is an open access article distributed under the terms of the, which permits unrestricted use, distribution, and build upon your work non-commercially.