International Journal of
eISSN: 2576-4454


Review Article Volume 3 Issue 3
1National Institute of Electricity and Clean Energies, Mexico
2Institute for applied Geophysics and Geothermal Energy, RWTH Aachen University, Germany
Correspondence: Alfonso Aragón-Aguilar, National Institute of Electricity and Clean Energies, Reforma 113, Col. Palmira, Cuernavaca, Morelos, CP 62490, Mexico
Received: April 23, 2019 | Published: May 2, 2019
Citation: Aragón-Aguilar A, Deb P, Georgina IM. Conceptual analysis of geothermal neighboring zones characterization with contrasting behavior: applied to a Mexican geothermal field. Int J Hydro. 2019;3(3):175-183. DOI: 10.15406/ijh.2019.03.00178
In Mexico, there are many geothermal fields, which are characterized by high temperature but low permeability. In this work one of these fields is studied, which is a producer with high enthalpy but low mass flow production. The scope of this work is to analyze two neighboring areas of Los Humeros geothermal field (LHGF); whose performance is contrasting. According to productivity behavior, it was found that low permeability of rock formation is related with unfavorable balance between exploitation and water entrance as recharge. Analysis of static temperature profiles of some wells of the field provides temperature range between 300 and 360°C at the bottom. During drilling, low fluid circulation loss (no more than 20m3/hr) is observed in wells of this study zone. However, there is a marked difference, in productive characteristics in wells, located in neighboring zone. In this study, the behavior of producer wells located at the western side of the unproductive zone is compared with the unproductive wells. The main conclusion resulting from this study is that the presence of geological structures influences the productive or unproductive behavior of the wells. As a practical application of this study evaluation of stored heat in area of non-producer wells, and its recovery through the use of non- conventional techniques, is proposed. One of these, are related to the methodology of Enhanced Geothermal Systems (EGS).
Keywords: los humeros geothermal field, reservoir performance, saturation state, enthalpy, permeability, mass flow rate, enhanced geothermal system, static characterization
At early reservoir stage, its static conditions can be evaluated using parameters such as temperature, pressure, formation mineralogy, permeability, and lithology. The reservoir characterization is a useful tool for planning its exploitation designs and programming new areas of expansion.1 Different methods such as thermodynamic analysis, physicochemical, geological, geophysical, transient pressure tests, etc., are used in reservoir characterization. Reliable characterization results in reserves determination, knowledge of initial conditions, parameters distribution and overall reservoir scenario. This information is necessary for designing exploitation scenarios, estimation of life-cycle of a reservoir and project planning. Reservoir characterization models are used to simulate the behavior of the fluids within the reservoir under different sets of circumstances and to find the optimal production techniques that will maximize the production.2,3 used the knowledge of the rock formation properties and the physicochemical parameters as basic techniques for reservoir characterization.
Across Mexican Republic there are more than 4000 thermal manifestations, majority of these are located along Neovolcanic belt. Originally Comisión Federal de Electricidad (CFE), have carried out geochemical sampling in most of these thermal manifestations. Through interrelation of results of successful geoscientific studies in these zones of thermal manifestations CFE started exploitation of four geothermal fields: Cerro Prieto, BC, Los Azufres, Mich., Los Humeros, Pue., Tres Vírgenes, BCS. Meanwhile in Cerritos Colorados about 15 deep wells (between years 1980 and 1988) have been drilled. In 2015 “Grupo Dragón” obtained the concession for exploitation of “Domo de San Pedro” geothermal field in Nayarit, from “Secretaría de Energía” (SENER).4 Details of geothermal fields operating to date in Mexico, electric generation installed capacity, mass flow extracted and their corresponding operator are shown in Table 1.5‒7 Las Tres Vírgenes, Los Azufres and LHGF are located in formations of volcanic rocks. These type of fields have different behavior as compared to those, in sandy formations. Additionally, in LHGF, there exists a high variation in different formation characteristics and their parameters. Based on its thermodynamic characteristics, LHGF is classified as a "super-hot" geothermal system.
However, in spite of high temperatures measured, the permeability in some zones of the field is low which resulted in several wells with noncommercial geothermal production. This behavior is observed in one of the zones of LHGF, which provided the motivation for this research. The studied zone of this work is located at the central-eastern side of the LHGF, México. The wells drilled in this area are unproductive, although those located in the neighboring zones at its northern and western side, show productive characteristics. Therefore, the analysis presented in this paper is focused on searching explanations about the abnormal behavior of this area, in order to find alternatives for its development LHGF is located at the border between the states of Puebla and Veracruz at central-eastern México (Figure 1) at about 220 km to east of México City. The field is inside the Los Humeros volcanic caldera, which lies at the eastern end of the Mexican Volcanic Belt.8 LHGF is located near the limit with the Sierra Madre Occidental province, according to.9–11 This field is typified as a reservoir of high enthalpy in its production, but low permeability and low mass flow production. However, a drastic change in productive characteristics is observed between the north and central zone with respect to south zone of the same field. The hydrological model, the subsurface geology and the main lithological units have been described by.9,10 The mean topographical level of the field is about 2800 masl and the average temperature at the surface12 varies between 15°C (in spring) and -2°C (in winter).
|
State |
Location |
Project |
Developer |
Startup year |
Installed capacity (MWe) |
Mass flow production (t/h) |
|
Baja California |
Mexicali |
Cerro Prieto |
CFE |
1973 |
570 |
8500 |
|
Michoacán |
Cd. Hidalgo |
Los Azufres |
CFE |
1982 |
247 |
3600 |
|
Puebla |
Chignautla |
Los Humeros |
CFE |
1995 |
95 |
1200 |
|
Baja California Sur |
Mulege |
Las Tres Vírgenes |
CFE |
2001 |
10 |
420 |
|
Nayarit |
San Pedro Lagunillas |
Domo de San Pedro |
Geotérmica para el Desarrollo |
2015 |
35 |
580 |
Table 1 List of existing geothermal fields to date, in Mexican Republic, describing their location, project name, startup year, electricity generation capacity and mass flow extracted5‒7
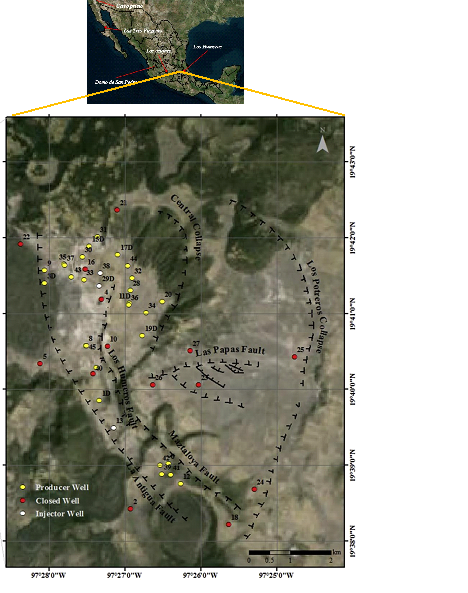
Figure 1 Location map of the studied area in LHGF, México, showing the analyzed wells at central zone.
It is important to mention that the exploration and exploitation of this field is coordinated by the Geothermal Project Management of the CFE. This enterprise started drilling operation in LHGF in 1981 and the successful results of the wells located at northern area were the base for drilling exploration all over the field. During exploration stage, wells H23, H24, H25, H26 and H27 were drilled in the studied zone, in order to know the expansion of the field. These wells are located at the central-south zone of the field as can be seen in Figure 1. However, none of these wells showed favorable characteristics for production. Due to lack of appropriate production conditions, no more wells were programmed for drilling in this section of the field. To date, there is no new drilling planned in this zone. In this work all the parameters available, obtained mainly during drilling stage of these wells are analyzed. In accordance with the latest ideas, the scope of this study is focused to achieve an understanding about different conditions influencing the lack of production in this zone. Available thermodynamic data and formation properties, of producer and non-producer wells are used Wells H1, H6, H12, H18 and H39 are producers and are located in neighboring area at the west side of the aforementioned zone of non-producer wells. Figure 2 shows the locations and the proximity of the wells. In spite of being very close to each other, the wells have different productive characteristics. It seems that the only one difference between these wells might be the presence of the different geological structures existing in the subsurface. While the producer wells are located on one side of the geological structure, the non- producer wells are grouped in another side. Both type of wells are in the same area but separated by geologic faults. As can be seen from the map of Figure 1, “Las papas” fault exists in direction E-W in the study area, and “Los Humeros” and “Mastaloya” faults in direction NW-SE. All the analyzed wells of the study area are located within this geological structures system and seem to influence their characteristics.
From geophysical and geological studies in LHGF, it has been proposed that there exists a caldera,13,14 named as the "Central" collapse, which is located inside "Los Potreros” collapse. Majority of the producer wells in LHGF, are located inside the area of “Central” collapse. The location of this zone coincides with the upflow zone of the geothermal system and probably with the magmatic chamber at depth.15 According to the rocks intersected by geothermal wells and from a detailed study of drill cuttings from most of them,16,17 suggest that the subsurface lithology can be grouped into four units. These lithological units are shown in Table 2. The basement is mainly composed of limestones and subordinated shales with flint lenses, which were folded. This geologic unit also includes intrusive and metamorphic rocks, and eventually some more recent diabasic to andesitic dikes. The main feeding zones identified based on the temperature and pressure records and fluid geochemistry profiles from different wells are proposed to be within the andesites of Tertiary age. The produced fluids of LHGF are classified as bicarbonate, sulphides and sodium-chloride type, oversaturated in silica and calcite.18,19 The fluids produced by the wells of this field are a two-phase mixture of low salinity.10
|
Unit |
Description |
Age |
Thickness |
Characteristics |
|
1 |
Post-caldera volcanism. Andesites, basalts, rhyolites, dacites, tuffs, ashes, pumicies. |
Quaternary (<100,000 years) |
Minimum: 90 m |
It forms shallow hot and cold aquifers. Medium to high permeability. |
|
Maximum: 1010 m |
||||
|
2 |
Caldera volcanism. Ignimbrites Xaltipan and Zaragoza, with andesites, pumicies, rhyolites, tuffs. |
Quaternary (510,000 -100000 years) |
Minimum: 185 m |
It forms aquitard and acts as a seal- cap. Low permeability. |
|
Maximum: 880 m |
||||
|
3 |
Pre-caldera volcanism. Hornblende andesites and augite andesites (Teziutlán) with tuffs, basalts, dacites, rhyolites. |
Tertiary (Miocene- Pliocene) (10 - 1.9 Ma) |
Minimum: 90 m |
It contains the geothermal fluids. Medium to low permeability. |
|
Maximum: 2600 m |
||||
|
4 |
Basement. Limestones and subordinated shales (Pimienta and Tamaulipas superior formations), marble, skarn, hornfels, granitic rocks and minor diabasic and andesites dikes. |
Mesozoic- Tertiary (Jurassic- Oligocene) (140 - 31 Ma) |
Minimum: 13 m |
Low permeability, high temperature. Several wells did not cut the top. |
|
|
|
|
Maximum: Unknown |
|
Table 2 Main lithologic units and characteristics of the subsurface of Los Humeros area, described in24
Unit 1 is related to subsuperficial deposits, Unit 2 is the seal cap, Unit 3 is the reservoir and Unit 4 is the reservoir base.
The mean depth of producer wells is about 2000 m (800masl). Till date, the field has an installed capacity of 93 MWe with eight back-pressure units of 5 MWe each one and two 25 MWe power plants. The LHGF operates with an average of twenty production wells whose total mass produced is around 1200 tons per hour.5 Besides there are three injection wells in operation, and 15 closed wells due to lack of production.20 According to studies carried out,21 one special feature in the Los Humeros geothermal reservoir is the occurrence of fluids of low pH in sampled fluids, particularly in those wells which are drilled more than 1800m deep (1000masl). The studied area in this work is located at central south zone of the field, surrounded by the boundary structures of “Los Potreros” Collapse, “Las Papas” fault, “Maztaloya” and “Los Humeros” faults (Figure 1). Previous works carried out by22,23 on this area, found no evidence of explored rocks, which are deeply affected by acid fluids. Therefore, the hypothesis of existence of an acid reservoir is discarded. Due to prevailing operative conditions in the field, sometimes the appropriate information is not available. So despite the limitations in data quality, static temperature profiles and circulation loss during drilling are used in this study.24 These parameters are amongst others, useful for identifying conditions in a geothermal system. In this case, the fluid circulation losses during drilling are used as a qualitative reference of wells permeability. The knowledge of initial reservoir conditions is highly useful because it can be used as a reference level for comparing the reservoir conditions along different stages of its operative life.25
In general, the field is characterized by high ratio of steam in total mass produced and very low permeability, which influences the productivity of wells. Records of fluid circulation losses during drilling indicates that maximum losses occur in the shallow zones which, leads to assuming low permeability conditions at bottom depth. This observation is correlated with characteristics of lithological units shown in Table 2. The wells in this field, mainly produce steam with high enthalpy (greater 2000kJ/kg) except well H1 whose production is liquid dominant and its enthalpy varies between 1100 and 1300kJ/kg.5,26 Figure 2 is a graph of enthalpy versus pressure indicating the saturation state of the produced fluid and shows the thermodynamic behavior of well H1 during its production stage. From a thermodynamic viewpoint, the ratio between steam mass (ms) and total mass (mt) is defined as the quality of mixture (X), where mt = ms + mf, (with mf as liquid mass). Thermodynamic properties of a system are used to describe its state.27 The measured values of pressure, temperature, enthalpy and their location on the pressure-enthalpy graph can be used to interpret the humidity characteristics of produced fluid of well H1 (Figure 3). The quality of the produced fluid by well H1 as indicated by Figure 2 is close to 0.3. Therefore, it can be inferred that the value of the water/steam ratio is greater than 1. This fluid quality value differs from values of other wells of this field, whose produced fluid is with quality values greater than 0.6. This behavior indicates the tendency of the wells to produce only steam, and not a two phase mixture.
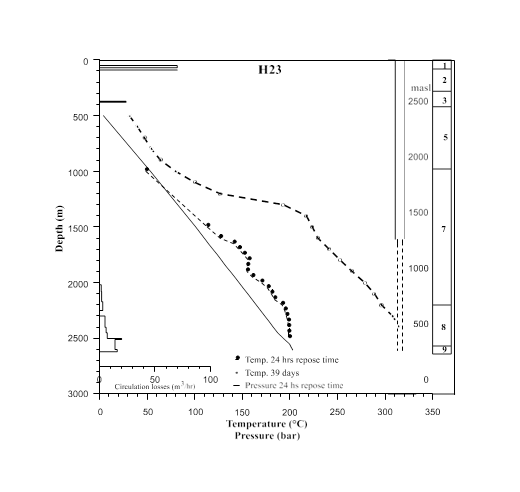
Figure 3 Graph showing measured temperature and pressure profile, fluid circulation losses during drilling, lithology and mechanical completion of well H23 of LHGF.
Original H1 well was vertical, however after ten years of exploitation its production declined. The reservoir pressure decreased by about 45bar and enthalpy increased in the rank of 300Kj/kg. The fluid quality showed variation from 0.05 to 0.35. In order to restore production of original well H1, it was decided to side-track the well with kick off point (K.O.P) at 918 m (measured depth). The deviated well H1D was 250 m deeper than the original well. Nevertheless, even though the initial pressure was greater than that of well H1, within the same time period of ten years, the pressure decreased by about 90bar. The behavior of both wells (H1 and H1D) is similar, as can be seen in Figure 2. A feature of this study is related to behavior analysis of a clearly unproductive zone (central eastern) in LHGF. A close up of the study area involving existing faults and wells in two sectors (H1, H6, H12, H13, H18 and H39 by one side) and (H23, H25, H26 and H27 on the other side) is shown in Figure 1. The data used in this work were obtained during drilling and completion stages.
The productivity behavior of well H1 indicates that it is located in another block of reservoir formation. In Figure 1, it can be seen that this well is located at the western side of “Los Humeros” fault, into the band formed by the faults “Los Humeros” and “Antigua”. It is important to emphasize that in this same sector wells H6, H12, H13, H18 and H39 are located but, only H6, H12 and H39 show productive characteristics. However, the wells (H23, H25, H26 and H27) located at eastern side of “Mastaloya” fault and bordered at north by the “Las papas” fault and to eastern and south by the “Los Potreros” Collapse are unproductive wells. Nevertheless, are characterized by temperatures around 300°C. According to observed results, the control variables prevailing in producing wells of the field are; high temperature and thickness production with low permeability. The poor permeability of wells was assumed through the scarce circulation losses during drilling and the low values of production parameters (mass flow, pressure, enthalpy, etc.). However, in the unproductive wells, only high temperatures were found. Neither geothermal flow characteristics, nor permeability were detected at depth. In the non-producer wells (H23, H25, H26 and H27), volumes of fluid at the inlet and outlet of the well, during drilling, were measured. Difference, between inlet and outlet, after volumes quantification, indicated circulation loss into formation. During drilling, circulation losses occurred mostly at shallow depths and along small thicknesses which are not related to reservoir.
The producing wells in LHGF, show high temperatures usually up to 300°C at bottom depth. This is why in the southern zone of the field, all the wells, with an exception of well H1, were drilled at depths greater than 2000 m. The decision of CFE to drill deeper could be due to the low temperatures encountered at shallow depths and low circulation losses, related to low permeability conditions in the reservoir formation. Although high temperatures were found, unfortunately permeability was scarce. Fluid circulation losses recorded during drilling and temperature and pressure data collected after drilling for wells H23, H25 and H26 are shown in Figures 3–Figure 5 respectively. The vertical axes show the depth and its correspondence with elevation above sea level (masl). The mechanical completion of the well is shown in the right side of the figure with the open hole section or slotted liner represented by the dots. The temperatures in these wells are of the order of 300°C and higher, but only were logged at depths greater than 2500m (about 400masl).
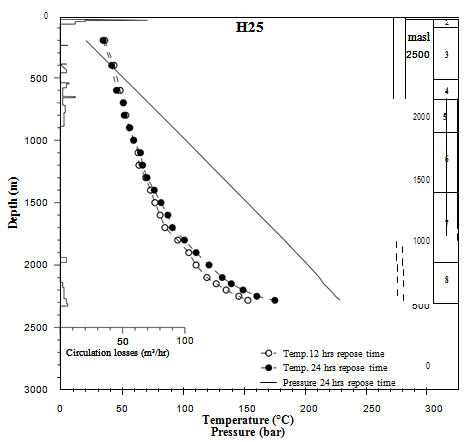
Figure 4 Graph showing temperature and pressure profile, fluid circulation losses during drilling, lithology and mechanical completion of well H25 of LHGF.
Representative fluid circulation losses (more or less 50m3/h) were found only at shallow depths, as can be seen in Figures 3 - Figure 5. The static temperatures were calculated from the measurements of temperature logs, using the28 methodology for transient pressure tests. The static temperature values for each depth were calculated from the measurements done at different times of steady state conditions in these wells.29,30 From the data analysis, it was found that two of the LHGF zones show dissimilar behaviors. Such zones are: a) The zone of unproductive wells located at eastern side of “Mastaloya” fault and, b) The zone of productive wells, located in the area between “Mastaloya” and “Las Antigua” faults (Figure 2). Table 3 shows the analyzed parameters which were used as comparison criteria for the wells of both zones. Due to topographical differences between wells, all depths are related to sea level, in order to take the same reference level in the analysis of parameters distribution.

Figure 5 Graph showing temperature and pressure profile, fluid circulation losses during drilling, lithology and mechanical completion of well H26 of LHGF.
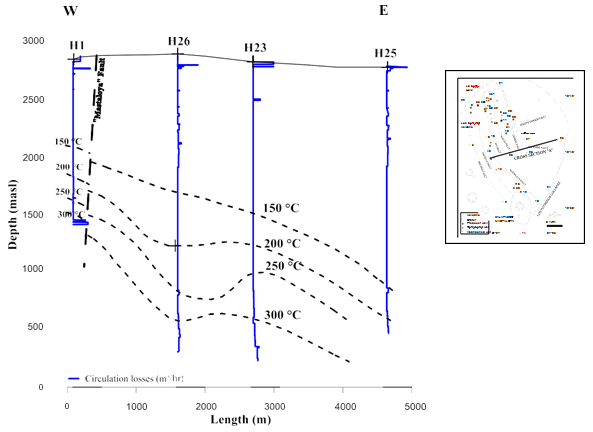
Figure 6 Cross section “A” (in direction E-W) of wells in the central zone of LHGF, showing the profiles of circulation loss during drilling of wells H1, H23, H25 and H26 and isotherms distribution. It can be seen that losses of fluid circulation (about 50 m3/h) during drilling, were found only at shallow depths in all studied wells of this cross section.

Figure 7 Prevailing conditions at completion stage of well H1, considered as its initial conditions.
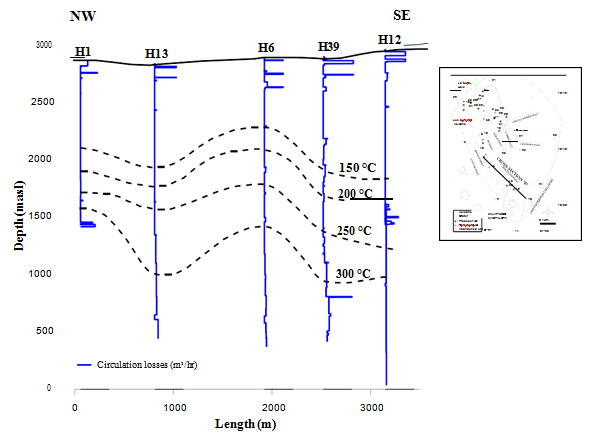
Figure 8 Cross section “B” (in direction NW-SE) prepared with wells located inside the band of “Mastaloya” and “Antigua” faults in LHGF, Mexico, showing isotherms distribution. It can be seen that fluid circulation loss (about 50 m3/h) during drilling, only in well H39 were found.
All wells were completed at similar levels (above 400 masl), with exception of well H1, which is shallower compared to the other wells considered in this work. An interesting feature to take into account is that, in non-producing wells the, fluid circulation losses are greater than in the producers except for well H1. The volumes of fluid circulation losses in these wells vary between 6 and 20(m3/hr). However, taking into account the depths as reference, the static temperatures differ between producer and non-producer wells. In the unproductive wells, excluding well H25 (174°C), considered as located at reservoir border, measured temperatures vary between 254 and 344°C and the static temperatures were calculated between 345 and 397°C. While in producer wells, measured temperatures vary between 263 and 362°C and the static temperatures were calculated between 267 and 383°C. Table 3 shows a summary of the levels (masl) at which the analyzed wells were completed, the mean values of circulation losses, maximum measured temperatures at bottom with their corresponding repose times and the calculated static temperatures. For calculation of static temperatures was used the method of spherical radial formation (SRF) and in Table 3 comparison of calculated static temperatures by29,30 and those in this work are shown.
As can be seen from Table 3, the unproductive wells have only slight difference in temperature as compared to producer wells. Therefore, it can be assumed that temperature is not a parameter for differentiating between producer wells and non-producers. Hence, the only reason for the lack of production could be related to the geological structures in the zone (Figure 1). With this reasoning it can be assumed that these structures operate as influence factor forming different formation blocks, resulting in a compartmented behavior of the system. So, the behavior of each block formation follows a particular trend. Thus, it is assumed that the structures located in the neighboring area of the non-producer wells play a definitive role. These structures obstruct water inlet for reservoir recharge causing the wells of this zone to be non-producers. From Figure 1, it is possible to identify that the non-producer wells are grouped in a specific area. To the western side of these wells, H1 is located. The producer wells, involved in this analysis, are located towards the southern part of LHGF. Cross section “A” (E-W direction) was constructed (Figure 6) passing through wells H1, H23, H25 and H26. In this cross section, the fluid circulation losses and the isotherms, determined from static temperatures of the wells are correlated.
|
Well |
Completion levels |
Fluid circulation loss |
Measured temperature |
Repose time |
Measurement depth |
Reference common level |
Static Temperature |
Reference common level |
||
|
(masl) |
(m3/h) |
(°C) |
|
(m) |
(masl) |
(°C)1 |
(°C)2 |
(masl)1 |
(masl)2 |
|
|
Productive wells |
||||||||||
|
H1 |
1430 |
50 |
263 |
100 days |
1450 |
1430 |
267 |
266 |
1410 |
1013 |
|
H6 |
400 |
7 |
320 |
40 days |
2250 |
522 |
349 |
339 |
344 |
354 |
|
H12 |
350 |
4 |
362 |
14 hours |
3000 |
-24 |
383 |
-24 |
||
|
H13 |
435 |
12 |
335 |
120 days |
2200 |
649 |
330 |
326 |
434 |
434 |
|
H18 |
300 |
5 |
338 |
60 days |
2900 |
108 |
332 |
332 |
100 |
117 |
|
H39 |
390 |
50 |
338 |
120 days |
2450 |
459 |
340 |
286 |
400 |
395 |
|
Unproductive wells |
||||||||||
|
H23 |
300 |
20 |
315 |
39 days |
2400 |
472 |
345 |
375 |
||
|
H25 |
540 |
6 |
174 |
24 hours |
2290 |
522 |
220 |
223 |
540 |
517 |
|
H26 |
470 |
8 |
344 |
24 hours |
2540 |
336 |
397 |
416 |
375 |
343 |
|
H27 |
340 |
15 |
254 |
24 hours |
2550 |
320 |
350 |
283 |
315 |
284 |
The difference in completion depths between the non-producers wells and well H1 (which is producer) is indicated in the figure. It can be observed that there is a significant difference in the temperature of well H1 and the others non-producer. Isotherm of 300°C is encountered much deeper, towards the eastern side where the non-producer wells are located. As mentioned before, in this figure, it can be seen that losses of fluid circulation (about 50m3/h) during drilling, were found only at shallow depths in all studied wells of this cross section. From the large offset in the isotherm depths, it can be interpreted that this fault, divides the reservoir into two blocks, separating well H1 from the non-producer wells (at eastern side). Taking into account the rock formation properties, it is emphasized that in all the reservoirs, the recharge water inlet is a main parameter for having productive wells. Recharge of a reservoir is only possible through porous and permeable formations or deep non-sealing faults and fractured rock. The low permeability detected in these wells, influences the absence of recharge to the reservoir rocks and also the lack of appropriate conditions for existence of productive characteristics. It is important to emphasize that, low values of circulation losses (sign of low permeability) during drilling at deeper is common not only in the analyzed wells in this study but in all the wells of LHGF. However, it can be seen that all wells included in this analyzed section, show temperature increase, as depth function.
The productivity performance of well H1 is different in respect to the behavior of other producer wells of this field. The main differences of this well, in relation with wells of the field are the magnitude of circulation loss during drilling, the depth of the productive zones and the steam-water ratio of its produced fluid. In well H1 circulation loss during drilling was about 50m3/h at bottom and the produced fluid quality was evaluated between 0.5 and 0.35 (Figure 2). It can be assumed that "Mastaloya" fault separates the well H1, from the other wells of cross section “A” (Figure 6). Therefore, it can be inferred that the presence of “Mastaloya” fault, is an influence parameter for unproductive characteristics presence in the wells located along its eastern side. Figure 7 shows profiles of circulation loss during drilling and static temperature along the well H1.
In order to carry out a comparative analysis between wells of productive and unproductive zones, the cross section “B” in direction NW-SE at the south of the field was drawn, considering the wells between "Mastaloya" and "Antigua" faults (Figure 1). The group of producer wells analyzed in this work is at western side of “Mastaloya” fault and bounded by “Antigua” fault. The location of wells H1, H6, H12, H13 and H39 allows an alignment to conform the cross section in direction NW-SE. These wells are producers, except H13, operating to date and incorporated in the power generation system of the field. Figure 8 is a cross section “B” (in NW-SE direction) showing profiles of fluid circulation loss during drilling, and the isotherms obtained from static temperatures of these wells.
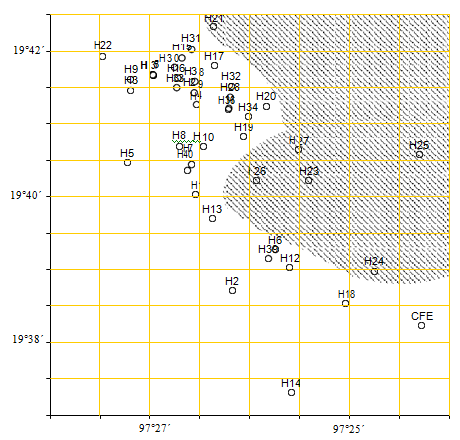
Figure 11 Map of wells distribution of LHGF, showing the closeness between them, and unproductive zone (shaded), but with heat storage.
It can be seen that wells involved in this cross section, have their completions close to 500masl, with exception of H1, which was completed at 1430 masl. Wells H1, H6, H12 and H39 are all producers, which had a circulation loss close to 12m3/hr, except well H39 which had a loss of 60m3/hr, indicating lack of permeability in the rock formation. All the wells, show circulation losses of around 50m3/hr at shallow depths. It is appropriate to emphasize that circulation losses during drilling are only a qualitative sign of permeability. In this work, this information was used due to unavailability of any other information and lack of more data. Nevertheless, it would have been appropriate to use transient pressure tests analysis for reinforcing the low permeability assumption. Table 3 shows a summary of the depth levels at which the producer wells were completed, also values of circulation losses, measured temperatures and calculated statics, at these same levels are shown. The cross section “B” includes well H13, a non-producer well, located between the producer well H1 and those located to southeast. Measured temperature in this well, after 120 days of repose time was 335°C at 435 masl, however the volume of circulation loss only was, 12m3/hr.
Using measurements logged of pressure-temperature profiles at the end of drilling stage, the saturation state of wells in this cross section was determined. Through the use of the well measured data in saturation curve (temperature-pressure) the saturation conditions of the fluid along the profile of the wells were identified. Analyzing the saturation state of the fluid at depth, it can be assured that productive conditions exist in wells of this cross section. The data of measurements (pressure, temperature) logged in wells were compared with thermodynamic diagrams. Figures 9 & 10 are an example of this analysis using data of well H39. The comparison of the measurements of temperature and pressure with the saturation curve is carried out in this well, as shown in Figure 11. As it can be seen, the well conditions (pressure, temperature) along its profile correspond to the saturation state. On the other hand, Figure 10 shows the enthalpy-pressure behavior of the produced fluid in well H39 during its initial production test. The thermodynamic behavior of the produced fluid by the wells of this analyzed zone, shows that, from the enthalpy-pressure diagram, its quality is in the mean rank of 0.7. The data plotted in Figure 12, were obtained during production test in the well with diameter orifices of 2, 2.5 and 3 inches. Through the enthalpy-pressure diagram it can be define that fluid quality value is between 0.65 and 0.75 at initial conditions of the well. Comparing Figures 2 & 10, the differences in fluid quality of wells H1 and H39 can be observed.
The main features associated to a geothermal reservoir are: a basement, a seal cap, high temperature, high permeability and water recharge, among others.31 Unfortunately, in the analyzed wells (H23, H25, H26 and H27) only high temperature is a common fact. Permeability is not a feature of Los Humeros geothermal field. The lack of permeability in the reservoir affects its behavior in two ways: a) None or poor inlet of recharge water to the geothermal reservoir and, b) low values of production parameters. This could be the reason why in spite of temperatures as high as 300°C or even higher, there are no production conditions in wells of the cross section “A”. Under these conditions it can be proposed32 that the stored heat underground, can be extracted using secondary recovery technologies, such as reservoir stimulation, formation fracturing and other non-conventional methods. Therefore, according to the conditions prevailing in this geothermal field and the stored heat in the reservoir, it would be appropriate to apply non-conventional heat exploitation techniques like enhanced geothermal system (EGS).
Another important observation is that the fluid circulation losses were found slightly greater in wells at the eastern side of “Mastaloya” fault (non-producers) than of those wells located at western side of “Mastaloya” fault (producers). However, as it was mentioned, those circulation losses were observed only at shallow depths and not at bottom, so the obtained low circulation losses at deeper, indicate that the permeability is low. In the zone of unproductive wells, at bottom were logged temperatures in the rank of 300°C (Table 3). High temperature indicates existence of heat in the reservoir, however due to lack of permeable conditions and water entrance, there is no evidence that fluid can act as transport vehicle for the heat. From this behavior, it could be assumed that the influence of geological structures, play an important role and is associated with the lack of geothermal production. Figure 11 shows a plane with wells locations in the field. The apparent closeness between the producer wells and the non-producer wells can be seen. From the analysis of the obtained results, appears an area marked with shading, taking as its borders the drainage radii of analyzed wells. Idealistically, it could be supposed that, in absence of the geological structures especially the fault system in this caldera complex, the field would be a homogeneous system and all the wells would have a similar behavior. However, from the analysis carried out, it could be assumed that LHGF behaves as compartmented system.
Even though, wells at eastern zone of Figure 11, are non-producers, studies show evidence that this area stores heat, which could be extracted and used. It is feasible obtain the thickness which stores heat, with rock formation temperature upper 200°C through the determined isotherms in wells (Figures 3 & 4). Combining area, thickness and rock properties can be obtained the stored heat which means thermal energy and its corresponding conversion to electric. In the zone of producer wells, besides productive characteristics (mass flow, enthalpy, pressure, etc.) temperatures greater than 320°C were found, although with poor permeability of the rock formation. As it has been mentioned, the low permeability of this zone, makes the water recharge very scarce and therefore, the production decline starts since early exploitation stage. An example of this decline is the well H1, such as it is shown in the graph of Figure 2. Additionally, well H13 which, even though measured high temperature (335°C, Table 3) did not result in production. The quantity of hydrothermal fluid that the rock formation contains naturally is likely to be very limited particularly due to low permeability in this field. So, it would be appropriate to make emphasis for quantifying the stored heat in this studied zone, which cannot be extracted by natural ways. From different analyses33 shows that pressure recovery is much faster than temperature re-establishment. Under this concept it is necessary selecting and designing the best methodology for the enhanced recovery of geothermal resource. It is important to emphasize that it is not only enough to select the appropriate method to apply in the recovery of geothermal resource,34,35 but the behavior of the field must be monitored during its practical application.
According to the analyses carried out through the development of this work, the conclusions are:
This work was developed under Task 6.4 of GEMex project CONACYT-European Union Number 268074; “GEMex: Mexico-Europe cooperation for the investigation of improved geothermal systems and superhot geothermal systems”. The authors wish thank to CFE authorities by support provided for this study.
The authors declare that there is no conflict of interest.

©2019 Aragón-Aguilar, et al. This is an open access article distributed under the terms of the, which permits unrestricted use, distribution, and build upon your work non-commercially.