International Journal of
eISSN: 2576-4454


Review Article Volume 6 Issue 3
1Tianjin Key Laboratory for Oceanic Meteorology, Tianjin 300074, China
2Tianjin Institute of Meteorological Sciences, Tianjin 300074, China
3Meteorology Administration of Jinnan District, Tianjin 300350, China
Correspondence: Zhao Yue, Meteorology Administration of Jinnan District, Tianjin 300350, China, Tel 086-022-28540607
Received: May 25, 2022 | Published: June 8, 2022
Citation: Wei W, Yue Z, Zhi-jie L, et al. Application of visibility new algorithms on fog event. Int J Hydro. 2022;6(3):127-129. DOI: 10.15406/ijh.2022.06.00312
To improve the visibility calculation accuracy of numerical weather predict model, the paper tries to explore two new visibility calculation methods. Firstly, a multi-element visibility algorithm is established based on air temperature, dew point temperature and relative humidity. Then a visibility fusion method is developed. Verifications show that the calculation accuracy of multi-element visibility algorithm gains an advantage over a single relative humidity method, and the visibility fusion algorithm can describe the regional distribution of fog event. visibility fusion algorithm can overcome the limitation of single visibility algorithm and improves the prediction accuracy of fog.
Keyword: visibility, algorithm, fusion, fog
Fog is a common disaster weather which has a great threat to transportation safety. Accurate forecast of fog can reduce losses caused by fog event,1 particular it occur on the sea. Previous research works mainly focus on fog forecasting from following three methods: characteristic analysis, statistics analysis and numerical simulation, among which the numerical simulation method has widely been used.2–6 The mesoscale numerical model discriminate the fog event using inversion stratification, wind speed, liquid water content and other elements as forecasting indicators.7 Because the visibility is referred as a grading standard of fog, other variables are difficult to be substitute for fog quantification. Therefore, the visibility calculation is introduced to analyze or forecast fog event in model post-processing. The relative humidity and liquid water content algorithms are often used in visibility forecasting of fog,8–9 and some researchers also consider the aerosol particle effect in visibility estimation. Previous studies showed that visibility estimation is poor if single liquid water content or relative humidity algorithm is alone used.10 Thus, a new visibility algorithm need be established for fog forecasting and grading classification.
The paper attempts to propose a visibility new fusion method with multiple algorithms integrated by multi-element visibility algorithm combining with others, which can predict both thick fog and light fog in numerical predict models and improve the fog early-warning ability for the services of highway, airport, port, etc.
Construction and verification of the visibility algorithm with multi-elements variable
Construction of the multi-elements visibility algorithm: The data for establishing and verifying visibility algorithms is from 40 coastal meteorological stations in China, and its observation period is every 3h daily from 2011 to 2018. The elements of 23 observation stations include temperature, dew point temperature and relative humidity for visibility new algorithm establishment, the new algorithm is referred to as multi-element visibility algorithm:
Vr1=10.84e−(RH+30)30(T−Td+1.0) (1)
In above formula, T-Td is the difference of temperature and dew point temperature in ℃; RH is the relative humidity in %.
In order to verify the applicability of multi-element visibility algorithm, a single relative humidity algorithm is introduced as the comparative algorithm.11
Vr2=21e−2.5(RH−15)80 (2)
Verification of the visibility algorithm: The verification data is from 17 observation stations except the stations of the algorithm establishment, and the total samples are 104084 set of meteorological elements, i.e., temperature, dew point temperature, relative humidity and visibility.
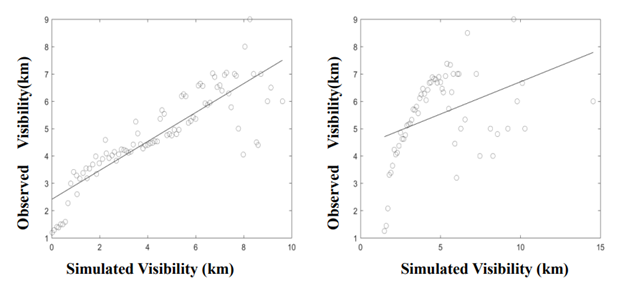
Figure 1 illustrates the scatters of observed visibility and simulated visibility calculated by observed meteorology element. The discrete degree of multi-element visibility algorithm is less than that of single relative humidity algorithm. The fit equation of multi-element visibility algorithm has better fitness than the single relative humidity algorithm. In fit equation, y represents the observed visibility value and x does the simulated visibility value.

Figure 1 Scatter of observed and simulated visibility from the multi-element algorithm (a) and single relative humidity algorithm (b).
Statistics results in Table 1 reveal that the multi-element visibility algorithm is superior to single relative humidity algorithm in two aspects, (1) the root mean square error (RMSE) of multi-element visibility algorithm (1.484) is less than the RMSE of single relative humidity visibility algorithm (2.427); (2) mean error (ME) is the sum of the difference that simulated visibility minus the observed visibility. The absolute value of ME (-0.328) of the multi-element visibility is less than ME (-0.565) of single relative humidity algorithm, which implies that the multi-element visibility algorithm has less error, compared with observed visibility, than single relative humidity visibility algorithm.
Visibility algorithm |
Root mean square error |
Mean error |
Fit equation |
Single relative humidity |
2.427 |
-0.565 |
y=0.236x+4.352 |
Multi-element |
1.484 |
-0.328 |
y=0.529x+2.414 |
Table 1 Statistics analysis of single relative humidity algorithm and multi-element algorithm
Construction and testing of fusion algorithm of various visibility methods
Visibility fusion algorithm research: Based on Koschmieder's law, statistical equations and empirical formulas, a fusion visibility method is established combining with formula (1) and formula (2). The additional formulas of visibility fusion algorithm is written as following:
VL=0.027LWC−0.88 (3)
Vr1>10km,VIS=max(Vr1,Vr2) (4)
Vr1<=10km,VIS=Vr1×Vr2Vr1+Vr2 (5)
In above formulas, Vr1 and Vr2 are simulated visibility calculated by multi-element visibility algorithm and single relative humidity visibility algorithm, respectively. VL is the visibility calculated by liquid water content, all variable units are km. RH is relative humidity at height of 2 meter above surface, its unit is %. LWC is the liquid water content, unit is g.m-3.
Test of visibility spatial distribution in fog event: To test the availability of visibility new algorithm in fog simulation, the satellite image of fog area (Figure 2a) and the surface observed visibility (Figure 2b) are used as the real information at 00:00 on February 20,2020. Box A in Figure 2b and box B in Figure 2b illustrate fog area in North and East China, respectively, at 00:00 on the 20th. The fog area on the satellite image in Figure 2a covers the region of surface observed visibility less than 1km, which is obviously larger than the area of surface observed visibility.

Figure 2 Distribution of fog area from satellite image and observed visibility at 00:00 on February 20,2020.(a) Satellite image of fog area (b)Surface observed visibility in 1h ,in km.
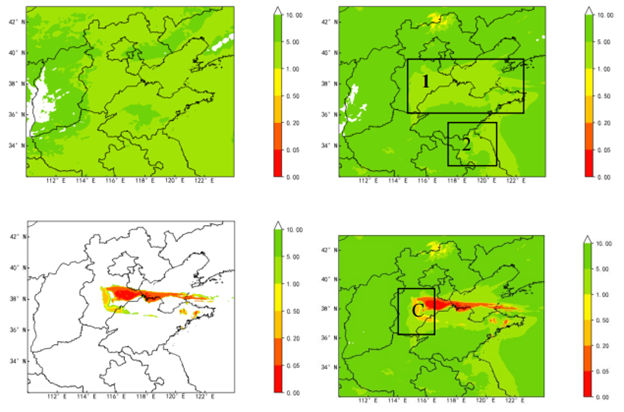
Figure 3 shows the visibility distribution of four algorithms, i.e., single relative humidity algorithm, multi-element algorithm, liquid water content algorithm and fusion algorithm. Comparing the visibility in Figure 3a with that in Figure 2, both the single relative humidity algorithm and multi-element algorithm describe the visibility distribution above 1km. Particular, the visibility shape in box 1 of Figure 3b is basically the same as that in box 1 of Figure 2a, and visibility in Figure 3b is referred to forecasting fog distribution. Liquid water content algorithm mainly simulates the areas of visibility below 1km (Figure 3c), because simulates area is limited by the calculation accuracy of the liquid water mixing ratio. The distribution of simulated visibility has a position difference with observed visibility due to the error of liquid water mixing ratio caused by WRF model simulation. Although visibility distribution of liquid water content algorithm is inconsistent with the observed fog distribution in some places near the box A in Figure 2b, the position of low visibility is still near the observed fog area so it is used as the virtual simulated fog distribution.

Figure 3 Visibility distribution of four algorithms at 00:00 on February 20,2020, unit is km. (a) Single relative humidity algorithm (b) Multi-element algorithm (c) Liquid water content algorithm (d) Visibility fusion algorithm.
Figure 3d shows the visibility distribution of visibility fusion algorithm which is better than that of single visibility algorithms. If position error of liquid water content is ignored in non-fog area, the fog area in box C in Figure 3d is similar with the area in box A in Figure 2b.
The test of the visibility spatial distribution present that simulated fog area of visibility fusion algorithm is significantly better than other single visibility algorithms. But the calculation accuracy of visibility fusion algorithm depend on the accuracy of relative humidity and liquid water mixing ratio simulated by WRF model. The paper only discusses the availability of fusion algorithm and ignores the error caused by WRF model.
A multi-element visibility algorithm was established based on air temperature, dew point temperature and relative humidity, meanwhile a visibility new fusion algorithm is integrated by several visibility methods. The visibility fusion algorithm makes up for the deficiencies of single relative humidity algorithm or single liquid water content algorithm, After the verification, the following conclusions are induced:
Although fusion algorithm can overcome deficiencies of the single variable algorithm and improve the fog prediction accuracy, the larger forecast deviations of relative humidity and liquid water content in numerical weather predict model will result in the accuracy decrease of fusion visibility algorithm.
None.
The work is supported by the funds of Collaborative Innovation of Meteorological Science and Technique in Huang-Bohai Region (QYXM201801), and National Science Foundation for Young Scientists of China (42105009).

©2022 Wei, et al. This is an open access article distributed under the terms of the, which permits unrestricted use, distribution, and build upon your work non-commercially.