International Journal of
eISSN: 2576-4454


Research Article Volume 5 Issue 4
Faculdade de Engenharia Civil, Universidade Federal de Uberlândia, Brazil
Correspondence: Carlos Eugenio Pereira, Faculdade de Engenharia Civil, Universidade Federal de Uberlândia, Brazil, Tel +5534991505624, Fax +553432394170
Received: May 14, 2021 | Published: July 13, 2021
Citation: Pereira CE, Peixoto RAO, Salla MR, Filho JEA, et al. Application of measurement methods for solid discharge in the Ribeirão Jordão stream and tributaries in UPGRH PN-1. Int J Hydro. 2021;5(4):170-180. DOI: 10.15406/ijh.2021.05.00278
The Brazilian fluviometric potential guarantees the presence of hydroelectric plants in several locations. The dam construction generates changes in the transportation and sediment deposition processes, which can lead to different types of operational along with environmental impacts. The present study aims at measuring the liquid flow, analyzing the sediments and quantifying the solid discharge of the Jordão stream, located in the vicinity of the city of Araguari-MG, in order to enable the minimization and remediation of these impacts. For the measurement of the liquid flow, the equipment ADCP (Acoustic Doppler Current Profiler) and the fluviometric windlass were used. For the collection of suspended sediment samples, a North American series integrator U.S – DH 48 was used, and a Model Petersen collector for bed sediments, while in the laboratory, granulometric analyzes were carried out to prepare the granulometric curves. The data obtained in field work were used in the determination of solid flows through 7 methods found in the literature with the following results per section, being in the results from Station Pissarão 1 ranged from 5.42 to 258.36 T / day, while at Station Pissarão 2 from 0.01 to 81.83 T / day, at Station Bom Jardim between 9.55 to 770.86 T / day, from Station Jordão 1 between 0.02 to 35.96 T / day and from Station Jordão Foz 5.48 to 37.08 T / day. The same data were applied in the HEC-RAS program in order to determine, in the temporal scale, the behavior of the mass eroded or deposited in the stations in the period from September 1, 2018 to May 31, 2019, whose seasonality is from the flood period and considering at the end of the period, it was found that in the Pissarão stream there was a removal of sediment at the source in 29,455 T and a deposit with Station 01 with a positive balance of 8,225 T, and removal of sediment at the Pissarão 02 and Foz Stations, respectively, of 34,774 and 18,555 T. In the Bom Jardim stream, approximately 39,544 T were removed at the source and 43,050 and 9,984 T, respectively, in the Bom Jardim and Bom Jardim Foz Stations, while after the confluence between these streams in the Jordão stream, approximately 34,013 was respectively removed; 152,246 and 74,011 T at the point of the eastern Jordão stream, and at the Jordão 01 and Jordão Foz Stations.
Keywords: jordão river, solid discharge, HEC-RAS
Small Hydroelectric Power Plants (PCH’s) were one of the first hydroelectric investments made in Brazil and are still widely used today. The extensive implementation of the PCH is explained by the fact that these possess efficiency and speed in the production of energy (decentralized production and with few losses in the transmission systems), presenting low initial investment, reduced environmental impact and spend less time obtaining licenses, as well as during construction.1 In Brazil, about 95% of the electric energy is generated using hydroelectric plants, emphasizing the importance of sedimentological studies in order to guarantee the mitigation of the silting effects from reservoirs.2 The sediment load in rivers is an indicator of the erosive processes that are taking place in the Hydrographic Basin.4 In addition to factors such as precipitation, Mohammad et al.4 and Silva et al.5 show that the sediment load in rivers is influenced by the type of soil, vegetation cover, land use and topography of the hydrographic basin. In the river, due to the great energy of the current flow, the sediments are transported, but when this current reaches a certain reservoir, the flow decreases and the sediment is deposited. In sedimentological studies, direct methods are more complex and expensive, therefore, the use of indirect methodologies is more frequent, with the best known methods being Einstein (1950), Engelund and Hansen (1967), Toffaleti (1969), Ackers and White (1973) and Yang (1973). These indirect methods were used in the work of Sobrinho (2013), Brune (2014) and Peixoto et al (2021).
Regarding the calculation of total solid discharge from river measurements, according to Carvalho12 and Paiva13 Colby's method is advantageous due to its direct application and the use of lower quantities of data. This method uses simple information from the measurements of liquid discharge, the concentration of suspended sediments, the average depth and speed of the flow and the width of the cross section. The Colby method consists of a methodology based on the modified Einstein approach, in which it estimates the unmeasured discharge using three abacuses. According to Carvalho14 to verify the reliability of the results, these can be compared to those obtained by the modified Einstein method.
There currently exist several models and methodologies that determine the transport of sediments in rivers, however, several of these do not present precise or concise results neither do they adapt to reality. Due to the aforementioned, the importance is highlighted for continuous studies that improve understanding, in order that new models and more efficient equations are developed. For example, Paiva13 from 22 measurements on the Mogi Guaçu River and 353 series of experimental data from Pakistan's channels evaluated 16 available estimation methods. The author concluded that among the methods of indirect estimation of the total discharge of bed material evaluated, the best results were presented by the Yang Method9, followed by the methods of Toffaleti (1969), Bishop15 Ackers8 and Van Rijn16 which showed similar performances.
According to Martin18 the solid discharge methods developed by Ackers and Write8 and Van Rijn17 are used to evaluate the discharge of drag material in rivers of sandy beds, however, in practice, it is not always possible to apply these efficiently, since the concentrations do not always fit the range established by the transport equations. In that regard, Hubbell19 claims that the measurements require considerable practical effort, as these are not always objective due to the temporal and spatial variability. These variations are associated with the movement of the solid drag discharge, that is, it is possible to say that these equations available in the literature are still limited to estimating only the solid bottom discharge (GOMES, 1989).20
Through studies and methodologies, it is possible not only to know about sedimentology and transport, but to present measures that can mitigate or correct the impacts caused by sedimentological imbalance, such as preventive measures, the transport of sediments in water courses, and also to avoid the formation of sediment deposits at the bottom of the reservoir. Corrective measures, on the other hand, are used with the intention of repairing the damage generated by the deposition of sediment in the reservoir. To prevent impacts, the first factor one needs to observe is encountered at the beginning of the dam project plan, where a choice of suitable location must be made, as well as the calculation of the volume that must be reserved in the reservoir for the accumulation of sediment. In addition to soil conservation plans, within the basin, that will contribute to minimizing sediment production.
A software widely used in moving bed sediment transport simulations in stretches of artificial or natural rivers, and that considers erosion and sediment deposition over time is HEC-RAS. Some applications can be cited, including Mohammad et al.4 Berghout21, Lopes22 and Haghiabi and Zaredehdasht23 and others. There are also structures that can and are indicated for installation that prevent sediment from reaching the reservoirs. Worthy of mention here is a small dam upstream, with a decantation basin outside the river channel, as well as conduits or bypass channels.24 In this context, the Jordão stream located in a large part of the city of Araguari-MG has great potential for the production of electric energy, constituting, therefore of a place of relevance to carry out studies of solid discharges, both to guarantee the operational life of reservoirs and to prevent the aforementioned problems from occurring and / or worsening.
To achieve the results proposed in this work, it was divided into three parts: The first was the work of data collection in the field, such as the flow, and water and bottom sediment samples, the second was the laboratory analysis and determination through seven methods, the discharge of sediments, and finally, the calculation of the transport of sediments using the Hydrologic Engineering Center- River Analysis System (HEC-RAS) program.
Study location
The Jordão river basin is located in the mesoregion of Triângulo Mineiro and Alto Paranaíba, in the Water Resources Planning and Management Unit - Alto Rio Paranaíba 1 (UPGRH-PN1), between the geographic coordinates 18 ° 25'41 ”and 18 ° 50'51 ”south latitude and 47 ° 49'47” and 48 ° 12'51 ”west longitude. The basin area is approximately 926 km2 and the main watercourse extends approximately 90 km from the source in Ribeirão Pissarão to its confluence with the Paranaíba River. The collection points were defined based on planning and a study of the river course and the hydrographic basin. Along the entire stretch of the stream, five points for collecting water samples and bottom sediments were established, two of which are located on the affluent Pissarão stream, one on the Bom Jardim stream and the other two on the Jordão stream, as shown in Figure 1. At each station, a gauge board was installed to obtain the key curve of the liquid flows and solid discharge.
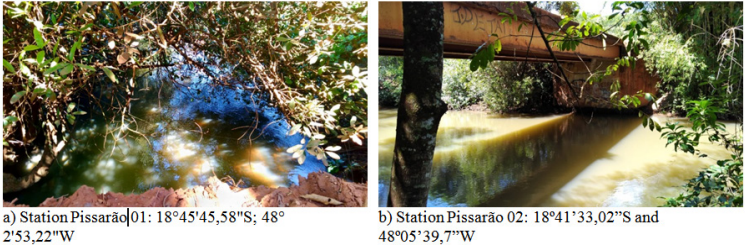
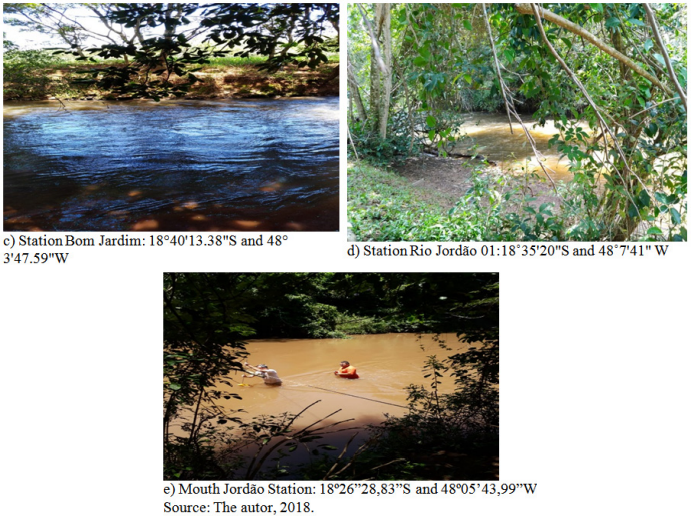
Figure 1 Photographs of the collection stations: a) and b) Stations on the Pissarão stream (tributary of the Jordão stream); c) Stations on the Bom Jardim stream (tributary of the Jordão stream) d) and e) Points along the Jordão stream.
The development of the location map of the fluviosedimentometric stations and determination of the main characteristics of the basin was carried out using the Quantum GIS - QGIS 2.18.4. (Figure 2). The mapping was carried out using current images from the LANDSAT-8 satellite, on the website of the Instituto Nacional de Pesquisas Espaciais - INPE (2018). These images did not possess QGIS, since the images from the different downloaded bands were georeferenced from the SIRGAS 2000 reference system and cut using the shape of the hydrographic basin as a mask layer. The research for the development of this study was divided into two stages; the first being related to the flow measurement and collection of samples in the field, these samples were subsequently analyzed in the laboratory to obtain results such as concentration of suspended sediments and granulometry of samples collected from the bottom of the streams. The second part was the use of the HEC-RAS program for calculating the mass of sediment transported between two cross sections and the variation in the sediment mass of the studied cross section.
Hydrosedimentological monitoring
The net flow was measured using the ADCP (Acoustic Doppler Current Profiler) M9-Sontek equipment developed for direct liquid flow measurement, and is based on the principle of the Doppler Effect. In the field, the ADCP is connected to the River Surveyore program, using a portable computer. With the crossing of the equipment, the bottom profile is obtained, speed directions and the flow calculation are performed by the program.
The collection of suspended sediment and bed samples, at the points chosen for monitoring, followed the procedures found in the literature, as described by Carvalho et al.2 and in the Agência Nacional de Energia Elétrica (ANEEL) sedimentometric practices guide (2003). Initially, the sampling of suspended sediments was based on the indirect method of sampling by an equal increase in width - IIL. The water collection is performed with the aid of the North American series integrating sampler (U.S–DH 48) with a 1/8 collection nozzle diameter. For the collection, the river cross section is divided into segments of equal width with the aid of a graduated rope, in which 10 to 20 verticals are selected, with the time and maximum speed of descent and ascent of the equipment in the verticals observing the minimum travel time based on thalweg and other verticals, while observing proportionality. The collecting of the samples was carried out with the same speed of transit in the verticals, obtaining a series of sub-samples with different volumes and the samples were placed in glass bottles properly labeled and packed in a thermal box to be transported to the Sanitation Laboratory (LABSAN) of the Faculty of Civil Engineering, for further analysis of the concentration of suspended sediments, using filtration and evaporation methods.
While the bed material samples were obtained using the Petersen model equipment and packed in a plastic bag. The sample collecting was carried out running from margin to margin along the cross section of the river; the samples were subsequently labeled and taken to the Geotechnical Laboratory (LABGEO) of the Faculty of Civil Engineering at UFU.
From these results, it was then possible to calculate the solid discharge using equation 1.
Qss = 0,0864.Q.Css (1)
where:
Qss : Suspended solid discharge (T/day);
Q : Total section flow (m³/s);
Css : Concentration of suspended sediments (mg/L).
At LABGEO, ABNT NBR 6457: 1986 was used to prepare the samples and ABNT NBR 7181: 2016 to analyze the particle size in the particle size tests for the sediments collected from the riverbed. The apparatus and materials used in this test were mechanical shaker of circular metal sieves with the following diameters, #50, #38, #25, #19, #9.5, #4.8, #2.0, #1. 2, # 0.6, # 0.42, # 0.25, #0.15 and #0.075mm, scale, capsules and greenhouse. The tests were conducted in triplicate with samples of 2.0 kg of sample each.
Hydraulic and geometrical characterization of the Bom Jardim, Pissarão and Jordão streams
In order to estimate sediment discharge in the streams of the Jordão stream basin, it was necessary to obtain hydraulic and geometric parameters of the analyzed sections. The flow (Q), mean velocity (U), mean depth (d), width (L) and the bathymetric top profile of the section were determined in the field. The slope of the water line, roughness coefficient, perimeter, area and hydraulic radius were determined from the River Surveyor program and by calculations with equations known in the literature. The determination of the slope of the water line (S) was performed by the Manning Equation (2). Manning's formula is the most widely used for determining the slope in rivers and canals due to proven results concerning its validity and the large amount of data derived from the applications.
The roughness coefficient (n) was obtained from the mean of the Strickler formula (1923) changed to D50 and D90 (Equation 3 and 4). To determine the wetted perimeter (Pm), the sections were analyzed from the profiles obtained in the River Surveyor program. The wet area (Am) was obtained by the continuity equation. The hydraulic radius was determined by the ratio of the wet area to the wetted perimeter.
HEC-RAS program
The HEC-RAS - River Analysis System program, currently in version 5.0.7, from March 2019, was developed by the Hydrologic Engineering Center for the U. S. Army Corps of Engineers. In this study, HEC-RAS was used to simulate the transport of solid particles in two main tributaries, the Pissarão stream and the Bom Jardim stream and after the confluence of the two in the Jordão stream to its mouth. Thus, it was possible to analyze over the studied time, which was from September 2018 to May 2019, the places where erosion and sediment deposits occur. During the simulations, the HEC-RAS program, in its integrated system, allowed for the manipulation and visualization of the input data, the flow simulation, in a so-called almost permanent regime (sedimentary transport on a moving bottom) and analysis of the results on tables and graphs, in addition to the reporting. The calculation and graphic presentation were conducted in a so-called almost permanent regime, in a network of channels with a natural section.
For the simulation in the HEC-RAS model, it was necessary to introduce basic information of different types, from the field surveys obtained during the collections carried out, which are: a) Geometric and hydraulic data obtained during the flow measurements with the ADCP equipment. These data along the simulation stretch, in five sections were added manually. The other sections were obtained using the ArcGIS tool. The sections were added every 5000 meters and in the sequence, interpolated sections were created between those already existing, using the existing interpolator function in HEC-RAS. After interpolation, the maximum distance between two sections went from 5000 to 500 meters. The Manning coefficient was determined for the stations from the granulometry data by equations 3 and 4 and indicated in the results.
The computational procedure is based on the solution of the one-dimensional energy conservation equation. Pressure losses are taken into account through friction (Manning's equation) and through contraction / expansion (product of the contraction / expansion coefficient due to the variation in kinetic height). The equation of conservation of the amount of movement is used in situations where the backwater curve varies very quickly. These situations occur when there is a change in the flow regime (for example in the hydraulic ledge), when crossing bridges and at the confluences of river stretches. After the geometry was created, the flow data obtained in the collections were inserted as boundary conditions for the quasi-permanent flow. To enter the data, the nascent stations were firstly considered, respectively in the Bom Jardim stream and in the Pissarão stream as the upstream limit. The downstream boundary condition, next to the mouth of the Jordão stream, was considered as the slope of the water line in the last stretch. In the flow series editor, flow data, flow duration and computational increment were entered. The flow rates were those obtained in each campaign, the flow duration consists of the difference in hours from one collection to another and the computational increment was considered to be 24 hours.
Before inserting the data of bottom and suspended sediments and the watershed, tests were carried out with simulations of the hydraulic model, since the sediment results are very sensitive to hydraulic parameters. To enter sediment data into the program, the granulometric distribution of the bed of the five stations was first inserted from the analysis and granulometric curves created in the campaigns that were carried out in the field, along with the predominant soil type in the basin and the concentration of suspended sediments according to the flow measured in the field. The granulometric distribution in each section of the program was considered to be that of the closest station to where bed sediments were collected and analyzed, the same was performed for suspended sediments. In all sections, the definition was made that the maximum change in the vertical dynamics of the bed would be 0.5 m.
The simulations in the program were defined between the months of September and May, using the Engelund-Hansen methods for the sediment transport (transport function), for the classification method in order to calculate the thickness of the active layer in the “Sorting Method”, where there are two options defined: Exner 5 and Active Layer. The first limits bed erosion and the second is indicated for gravel layers, being used only when the Wilcock equation is chosen, finally, the Toffaleti method was defined for the sedimentation speed. The results obtained were divided into two types of graphs, the first being the record of the total change in the bed mass accumulated over time and in space (a). The time was defined as that within the sampled period from September 1, 2018 to May 31, 2019, and the space is between the beginning of the cross section until just before the upstream section of the first section. The second graph shows the transport with drag or deposition of sediments in the cross section over time (b). The decision was made to generate sections next to the source and mouth of each studied tributary, as well as on the Jordan River, which is the junction of the Pissarão and Bom Jardim streams.
The results of sediment discharge by different methods were obtained with data from tests carried out in the laboratory and those from the application of the WinTsr program created by Paiva, Beling and Rosa (2002) and show in Figure 3. The selected methods took into account an analysis of the field data and the applicability conditions of each equation. The equations used were Meyer-Peter & Muller25 along with Einsten and Brown (1950) for drag discharge; Colby26 and Karim27 for total solid discharge; Ackers and White8 Engelund and Hansen7 and finally Cheng28 for discharge bed material. Figure 3a shows that the drag discharge, through the Meyer25 method, varies from 5.42 in September to 258.36 tonnes/day in November. The results of Einstein and Brown across most months show better results than those presented by the Meyer method. For the total discharge method of Karim27 the values obtained vary between 0.45 in September to 115.59 tonnes/day in November. For bed discharge by the Ackers and White8 method, the values vary between 0 in September and 317.63 tonnes/day in November. At point A the Cheng method, in general, presented the highest values in relation to the other bed discharge methods.
In Figure 3b, the drag discharge values using Meyer25 vary from 0.01 in September to 81.83 tonnes/day in February. The Meyer method stood out at point B, showing enhanced results over than those generated, for example, by the Einsten and Brown method. For total discharge using Colby26 variations were shown from 0.08 in September to 63.67 tonnes/day in February. At this point, the results obtained by the Colby and Karim27 methods presented more discrepant values between themselves, when compared to the previous section. For bed discharge, the values found using Ackers and White8 were from 0 to 46.18 tonnes/day in February. In general, the highest values obtained are in the months of February and December, and the lowest in the month of September.
In Figure 3c, using the Meyer dragging method, the values vary from 9.55 in September to 770.86 tonnes/day in February. For total discharge by Karim27, the values ranged from 1.74 in September to 789.79 tonnes/day in March. However, in general, the Colby method showed higher values than those obtained by the Karim method. For bed discharge using the Engellund and Hansen method, the results were between 4.95 in September and 519.91 tonnes/day in March. Figure 3d for drag discharge using the Meyer method, the values vary from 0.02 in September to 35.96 tonnes/day in March. For total discharge using the Colby method, the values ranged from 0 to 93.41 T / day in the month of December. For bed discharge, the results for the Ackers and White8 method were between 0 to 17.13 tonnes/day in March.
Figure 3e for drag discharge using the Meyer method, the values ranged from 5.48 in September to 37.08 T / day in December. For total discharge using the Colby method, the values vary from 11.92 in September to 170.85 tonnes/day in December. For bed discharge, the results using Engellund and Hansen ranged from 3.85 in September to 24.41 tonnes/day in December. In greater part, the sampled period refers to the beginning of the rains over the studied region, that is, between the months of October and March, and as noted at all fluviosedimentometric stations, the lowest results occur in the months of September, April and May, characterized by low rainfall. Although it is still difficult to relate rain to sediment transport, it was found that there is a relationship between sediment and rainfall regime for the Jordão River, since the stream starts to transport a larger volume of water. In addition, it is believed that the sparse vegetation, replaced by pastures and agricultural use, in tomato, corn and soy plantations are reasons for the increase in sediment transport across the river.
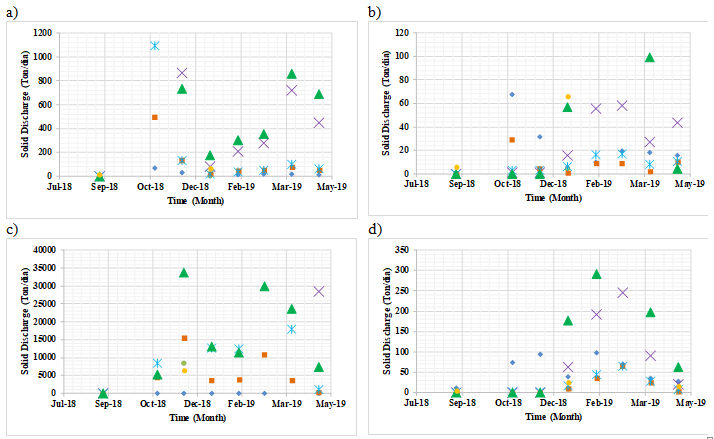

Figure 3 Solid discharge measured between the months of September 2018 to May 2019: a) Station Pissarão 01 b) Station Pissarão 02 c) Station Bom Jardim d) Station Jordão Nascente e) Station Jordão Foz.
In some cases, there was an overestimation of the sediment discharge, quite possibly due to the hydraulic characteristics of the section not being included in the tested range for any of the methods used. Regarding the use and occupation of the soil, in the collections taken in the field, one notes that at all points the APP areas were compromised, and that these did not contain the minimum protection necessary of the riverbed, and / or of the margins, as in the case of the Bom Jardim and Jordão nascent points. Additionally, the surrounding region is marked by the use of agriculture, and at all points, there was some type of culture close to the river. Agriculture can bring different impacts to the river, both in terms of pollution by pesticides and the excessive use of stream water, leading to a decrease in flow. In conversation with some residents, it was reported that there has been an increasing loss of flow in the river over the years.
The graphs in Figures 4a and 4b show, respectively, the amount of sediment transported between two consecutive sections in the Pissarão stream, the first stretch starts at the source and continues upstream from the Pissarão 01 Station, which is the site of monthly collections; the second is starts at Pissarão 01 Station and goes up to Pissarão 02 Station; and the third section goes from Station 02 to the mouth section. The second graph is the reading of the first graph, in which the values are read in module, should these present the results of the difference between the values. If these are positive, it indicates that in the downstream section there will be sediment deposit and the opposite that sediment is removed from the section.
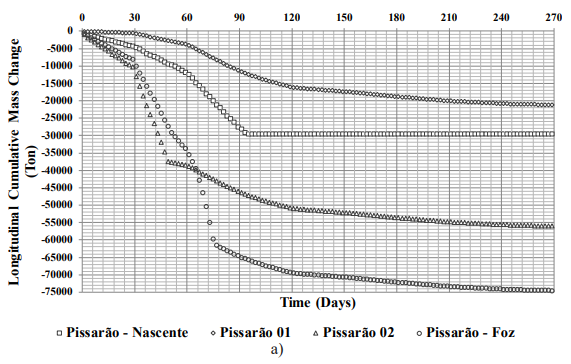
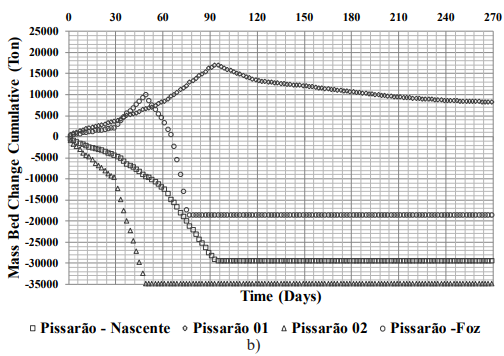
Figure 4 Pissarão stream accumulated sediment mass.
a) Between consecutive sections
b) Cross-sectional analysis
Therefore, one notes that the amount of sediment transported along the stretch between the source and Station 01 showed a virtually uniform growth in the studied period, with a maximum erosion of the stretch being approximately 7,377.40 tonnes, and as in the nascent section, the amount of sediment removed was of 14,306.50 tonnes, in the mass balance at the Pissarão 01 Station there is a deposit of 6,929.10 tonnes of sediments. This value is shown at the end of Figure 4b, where in this season the deposit of sediment constantly increases, which is after the end of the studied period. The same analysis is made for the following two stretches, first for the stretch between Stations Pissarão-01 and Pissarão-02, where the accumulated amount of sediments at Station 01 is 7,377.40 tonnes and at Station 02 46,790.90 tonnes of sediments. As the amount of sediment in the upstream station is greater than that of the downstream, there is a dislocation of 39,413.50 tonnes of sediment at Station 02, which is transported to the mouth section. Figure 4b shows this removal of sediments, where one notes that the value is constant as of the month of December due to the limitation imposed to the program of maximum depth for removal of sediments from the bed of 0.50 m. Noteworthy here is that the Pissarão 02 Station is characterized by the presence of many rocks along the streambed. Finally, between Station 02 and the mouth of the Pissarão stream, there is a sediment deposit at the mouth of 18,254.06 tonnes, as noted in Figure 4b.
The analysis is repeated for the Bom Jardim stream, another tributary of the Jordão River. Worthy of note from Figure 5a is that between the spring and the Bom Jardim Station the total amount of sediment removed from the bed at the Bom Jardim Station was 43,205.50 tons, accelerated in the months of November and December. Figure 5b corroborates this result by showing that in the Bom Jardim Station there is sediment decay, noted also is that between the nascent Station and the Bom Jardim Station, transport occurs more intensely between September and December, which is constant from the last month due to the depth limitation imposed on the program. Finally, between this section and the mouth, the values are lower and there is sediment deposit confirmed in Figure 5b, which shows peak sediment deposit of approximately 4,871.11 tonnes in December, corroborating with Figure 5a & b over the same period.2938
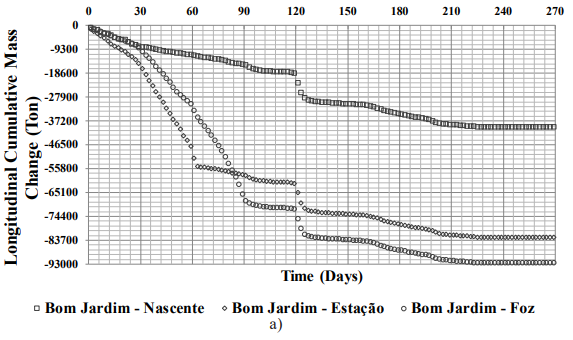
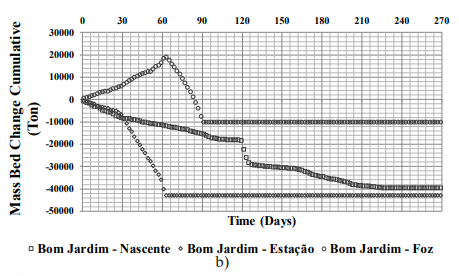
Figure 5 Stream accumulated sediment mass.
a) Between consecutive sections
b) Cross-sectional analysis
In the Jordão River, Figures 6a and 6b show that the spring stretches (confluence of the Pissarão and Bom Jardim streams) and mouth there is an accumulation of sediments, at the spring from November to February and at the mouth between November and January. In the stretch between the source and the Jordão 01 Station, sediment removal at this Station reaches 160,373.03 tons and between the Jordão 01 Station and a 127,718.90 tons are deposited at the end of the study period.
Through the study conducted on the research stations, there is sediment removal noted between the source of the stream and deposit at the Pissarão 01 Station with a positive balance of sediments, and the same occurs between the Pissarão 02 Station and river mouth. In terms of the mass balance, this stream presents a verified contribution in relation to the soil transported to the Jordão stream. The results obtained demonstrate that different methods have different final values, with large variations occurring between them. This is mainly due to the hydraulic characteristics of each section, and the precision that each method has for each characteristic. In some situations the results can be conflicting, which shows that it is not possible to simply apply only one calculation method, and emphasizes the importance of conducting field collections in order to analyze which are the best methods to be applied in each case according to the hydraulic characteristics of each section. In general, one notes that during the rainy season the values obtained are higher, concluding that the sediment transport in the riverbed occurs mainly in times of high precipitation. The high sediment values in some months of the year are mostly justified by the increase in precipitation, but also by the impact generated by the use and occupation of the surrounding soil. There are several negative consequences generated by this misuse of the land, which are also regularly noted by local residents. Therefore, it is recommended that the damage generated by agriculture and livestock be reduced in the surrounding areas, especially with regard to the areas of APP. It would be extremely interesting if there were environmental education campaigns directed to the owners of the land surrounding the stream, in order that these then gain a better understanding into the impacts caused by incorrect land use and thus be able to take corrective measures.
Thus, it is verified that there is sediment erosion at the source of the Pissarão stream with deposit at the Pissarão 01 Station, and erosion in the bed of this stream at the Pissarão 02 and Foz Stations. At the Bom Jardim stream, of this stream, which shows that in the mass balance it is verified that these streams present a contribution in relation to the soil transported to the Jordão stream. In this stream, after the confluence with the Pissarão and Bom Jardim streams, erosion occurs throughout the stream, with greater transport value at the Jordão 01 Station with erosion of 152,246 T and at the Foz Station with 74,011 T.
The authors are grateful to Fundação de Amparo à Pesquisa do Estado de Minas Gerais (FAPEMIG), through grant number 3899/2016, for supporting this research, and Coordenação de Aperfeiçoamento de Pessoal de Nível Superior (CAPES) for granting a master’s scholarship to the first author.
The author declares there is no conflict of interest.

©2021 Pereira, et al. This is an open access article distributed under the terms of the, which permits unrestricted use, distribution, and build upon your work non-commercially.