International Journal of
eISSN: 2576-4454


Research Article Volume 4 Issue 4
1Department of Biological Sciences, University of Medical Sciences, Nigeria
2Department of Fisheries Technology, Federal Polytechnic Nekede, Nigeria
Correspondence: Adebayo Ebenezer Temitope, Department of Biological Sciences, University of Medical Sciences, Ondo City, Ondo State, Nigeria
Received: July 12, 2020 | Published: July 28, 2020
Citation: Temitope AE, Bobo EC. An assessment of composition and diversity of fin fish in the upper course of Otamiri river, Imo State, South-Eastern Nigeria. Int J Hydro. 2020;4(4):14-150. DOI: 10.15406/ijh.2020.04.00239
The composition and diversity of the fin fish of upper course of Otamiri River was study for the period of three months to evaluate the likely effects of the recent anthropogenic activities around the river on the fish species. Water sample for physcio-chemical parameter were collected and analyses using conventional field and standard laboratory techniques. Likewise, the fish samples were collected bi-weekly using active and passive fishing gear. All the physic-chemical parameters measured fall within the standard recommended limit for aquatic management except the pH, ammonia, total suspended solid, Nitrate and carbon (iv) oxides. Also, sixteen species of fish belong to 9 fish families were recorded with the families, Cichlidae recording the highest percentage abundance and also found to be most diverse. The anthropogenic activities around the river couple with over-exploitation of the fisheries resources were found accounted for the decline in the fishes composition and diversity of the river.
Keywords: anthropogenic, over-exploitation, diversity, composition
The significance of fisheries resources in the socio-economic and food security development of any nations cannot be overemphasized, and the importance of fish as a source of protein is an indisputable fact. Apart from being a means of foreign exchange and cheap source of safe animal protein, fishery resource contains other essential nutrients required by the body for healthy living1,2 However, studies have shown that fish yield of most Nigerian inland water is on the decline,3 due to a wide range of causes ranging from environmental degradation of the water bodies to inadequate management of the fisheries resources. Ogueri et al.,4 have establish that water quality of Otamiri River in the recent years is compromised due to the several anthropogenic activities around the river, hence the need to revalidate the fisheries composition and abundance of Otamiri River after several years of earlier studies of Orji Akobuche and Okereke,5 in order to have a update of the fish fauna as a precursor to advising on the most efficient use of the river for socio-economic development.
Study area description
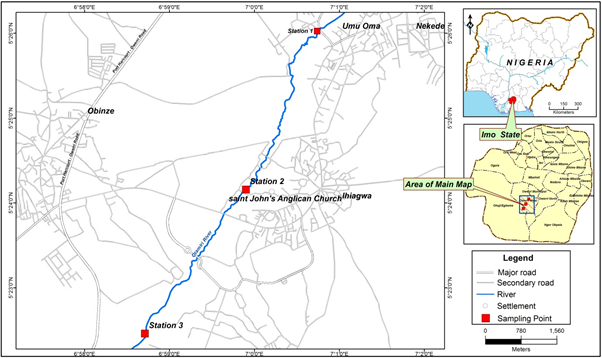
The study was carried out at the upper course of Otamiri River. Otamiri River is located within the tropical rainforest belt of Nigeria and lies between latitude 05o 23'N to 05o 30'N, and longitude 6o 58' E to 7o 04' E (Figure 1). The area is low lying being generally about 300m above sea level. The river runs from Egbu, where it has its major recharge resource and cuts through Nekede, Ihiagwa, Eziobodo, Olokwumuisi, Mgbirichi, Umuagwo and finally to Ozuzuin Etche town of river state of Nigeria, where it finally joins to the Atlantic ocean.6 The region experiences a mean annual temperature of 27oC and an annual rainfall of 200-300mm, with most of the months (April to November) characterized with high rainfall. The river serves the aforementioned transverse communities as main sources of water for Industrial, Agricultural, and Domestic use.

Figure 1 Map of Otamiri River showing the Sampling Stations (Sources: Cartographic Unit,University of Ibadan, 2019).
Sampling design and analysis
Three sampling stations were selected for the studies, and both water and fish samples were collected from the river bi-weekly for three months between the months of July to September, 2019. Sampling was done on the river between the hours of 8:00am –12:00pm on each of the sampling days. Surface water samples for chemical parameters were collected and analysed using a standard procedures.7 Likewise, data on fish species was collected bi-weekly using gill-net, cast-net, trammel-net, single hook and line, long-hook and line, mallea trap, wire basket trap throughout the sampling period. The number of fish caught in each sampling station were counted and recorded accordingly. The number of fish species caught by each of the fishing gear were also counted and recorded. The weights of each fish were obtained using digital weighing balance to the nearest 0.01g. The standard length, fork length and total length were also measured. Fish samples were counted sort out and identified using Nigeria fresh-water identification scheme of Idodo-Umeh,8 and Olaosebika and Raji.9
Statistical analysis
Descriptive statistics was used to analyze data on the physico-chemical parameter of the river. Duncan Multiple Range Test (DMRT) was employed to analyze the variation in the physico-chemical properties of the water samples across the three sampling stations. The analysis of the biological data was made with a combination of indices. Species diversity and evenness was determined with Shanon-Wiener’s index (H), Margalef’s index (D), and Equitability (J) using PAST Version 3.
The physico-chemical parameters
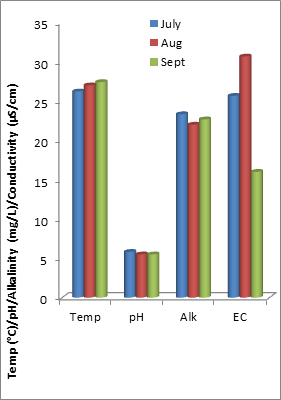
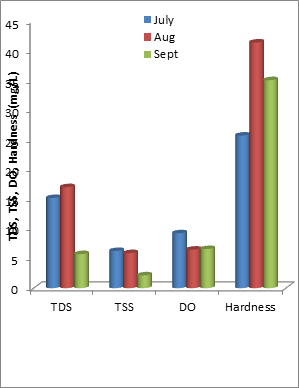
The results of the physico-chemical parameters of the Otamiri River in Owerri West LGA of Imo State, southeastern Nigeria between the periods of July 2019 to September 2019 is shown that all the parameters measured fall within the NESREA10 recommended limit for aquatic management except the pH, ammonia, total suspended solid, Nitrate and carbon (iv) oxides (Table 1), while Conductivity and carbon (iv) oxides were revealed to be significantly different across the sampling stations (Table 2). This finding corroborate the earlier report of Ogueri et al.4 and Adebayo et al.11 where the authors attributed the increased levels of those parameters to the erosional run-off of the adjourning lands due to the clearing of the riparian forest, and the sand dredging. Furthermore, the recorded fluctuation in the physico-chemical parameters (Figure 2‒5) could be attributed to the weather changes during the study period.
|
Parameters |
Range |
Mean±SE |
NESREA (2011) |
|
Temperature (OC) |
24.60- 28.00 |
26.878±0.209 |
a |
|
Transparency (m) |
0.10- 1.42 |
0.901±0.085 |
NS |
|
Current (m/s) |
0.10-1.12 |
0.244±0.056 |
NS |
|
pH |
0.50-6.00 |
5.111±0.409 |
6.5-8.5 |
|
Alkalinity (mg/L) |
16.00-32.00 |
22.667±1.073 |
NS |
|
Conductivity (µS/cm) |
8.00-45.00 |
26.444±2.930 |
NS |
|
Ammonia (mg/L) |
0.01-1.12 |
0.623±0.085 |
< 0.1 |
|
Total Dissolved Solid (mg/L) |
2.00-23.00 |
13.611±1.625 |
NS |
|
Total Suspended Solid (mg/L) |
3.20-7.48 |
5.597±0.320 |
0.25 |
|
Nitrate-Nitrogen (mg/L) |
0.05-0.10 |
0.053±0.003 |
9.1 |
|
Dissolved Oxygen (mg/L) |
4.30-8.60 |
6.653±0.323 |
Not <6.0 |
|
Hardness (mg/L) |
16.00-52.00 |
34.000±2.452 |
NS |
|
Carbon IV Oxide (mg/L) |
26.00-72.00 |
45.528±4.101 |
<20.0 |
|
Chloride (mg/L) |
38.00-68.00 |
49.056±2.084 |
300 |
Table 1 Descriptive statistics of the Physico-chemical Parameters of Otamiri River between July and September, 2019
SE, standard error of mean; NS, Not Specified; and a, aexcept in mixing zones, temperature increase by a 7-Day Average of the Daily Maximum temperatures (7-DADMax) shall not be more than 0.3 ºC above natural background conditions.
|
Parameters |
STATIONS |
||
|
1 |
2 |
3 |
|
|
Temperature (OC) |
27.35a |
26.10 a |
27.18 a |
|
Transparency (m) |
0.89 a |
0.97 a |
0.85 a |
|
Current (m/s) |
0.24 a |
0.14 a |
0.46 a |
|
pH |
6.00 a |
5.33 a |
5.50 a |
|
Alkalinity (mg/L) |
23.00 a |
20.67 a |
24.33 a |
|
Conductivity |
25.83ab |
11.83b |
34.67a |
|
Ammonia (mg/L) |
1.04 a |
0.39 a |
0.74 a |
|
Total Dissolved Solid (mg/L) |
14.17 a |
6.00 a |
17.83 a |
|
Total Suspended Solid (mg/L) |
5.92 a |
4.05 a |
6.25 a |
|
Nitrate-Nitrogen (mg/L) |
0.06 a |
0.05 a |
0.05 a |
|
Dissolved Oxygen (mg/L) |
9.81 a |
5.18 a |
7.30 a |
|
Hardness (mg/L) |
30.67 a |
33.67 a |
37.67 a |
|
Carbon IV Oxide (mg/L) |
32.00b |
62.83a |
41.75b |
|
Chloride (mg/L) |
46.67 a |
48.50 a |
52.00 a |
Table 2 Spatial variation in Physico-chemical parameters of Otamirri River between July and September 2019, (P< 0.05) using Duncan Multiple Range Test (DMRT)
N.B, Values with the same superscript along same row are not significantly different at P<0.05

Figure 2 Temporal variations in mean water temperature, pH, total alkalinity and electrical conductivity.

Figure 4 Temporal variations in mean total dissolved and suspended solids, dissolved oxygen and total hardness.
Fish abundance and composition
The check list of the encountered fish species during the study period is presented in Table 3. Sixteen species belonging to nine families were recorded. These findings shows a decline in the fish composition of the river when compare with previous reports of Okoukwu12 where he identified 20 fish species from 10 families from the river, and Okereke5 in her study on the river recorded 46 species belonging to 20 families. However, the study further affirms Cichlidae to be the most abundance of all the species during the study period. This could be attributed to the highly prolific nature of the family. Furthermore, the recorded highest abundance in the sampling station 1 could be attributed to the low water current in the stations couple with less dredging activities around the sampling station (Figure 6).
|
Family |
Species |
Total abundance |
Percentage abundance |
|
Cichlidae |
Sarotherodon melanotheron |
526 |
59.7 |
|
Hemichromis elongates |
14 |
1.6 |
|
|
Coptodon zilli |
112 |
12.7 |
|
|
Pelmatochromis guntheri |
3 |
0.3 |
|
|
Tilapia dageti |
13 |
1.5 |
|
|
Tilapia mariae |
14 |
1.6 |
|
|
Tilapia guineensis |
3 |
0.3 |
|
|
Notopteridae |
Papyrocranus afer |
79 |
9.0 |
|
Clarotidae |
Chrysicthy nigrodigitatus |
46 |
5.2 |
|
Alestidae |
Alestes macrolepidotus |
39 |
4.4 |
|
Hepsetidae |
Hepsetus akawo |
7 |
0.8 |
|
Mormyridae |
Mormyrops deliciosus |
19 |
2.2 |
|
Petrocephalus bane |
1 |
0.1 |
|
|
Gymnarchidae |
Gymnarchus niloticus |
1 |
0.1 |
|
Channidae |
Parachana obscura |
1 |
0.1 |
|
Cyrinidae |
Barbus occidentalis |
2 |
0.2 |
|
Grand Total |
880 |
100 |
|
Table 3 The check list of the fish sample from Otamiri River between July to September 2019
Fish diversity
The diversity index and spatial diversity index of total fish species recorded in the Otamiri River during the study period is shown in Table 4&5 respectively. Cichlidae was revealed to be most diverse throughout the study period. This could be due to the suitability of the environment. Also, the highest diversity was recorded in station 3 during the study period. This finding agreed with the report of Offem et al.,13 on wetlands of Cross River where he observed that habitat size and heterogeneity increased along up river- down river axis but flow variability decreased at down-river localities.14
|
Taxa |
H |
J |
E |
Q |
|
Cichlidae |
3.81 |
12.38 |
0.55 |
0.87 |
|
Notopteridae |
2.98 |
5.26 |
0.82 |
0.94 |
|
Clarotidae |
2.83 |
4.70 |
0.89 |
0.96 |
|
Alestidae |
2.70 |
4.91 |
0.79 |
0.92 |
|
Hepsetidae |
1.95 |
3.08 |
1.00 |
1.00 |
|
Mormyridae |
2.18 |
3.00 |
0.89 |
0.95 |
|
Gymnarchidae |
0.00 |
0.00 |
1.00 |
0.00 |
|
Channidae |
0.00 |
0.00 |
1.00 |
0.00 |
|
Cyrinidae |
0.69 |
1.44 |
1.00 |
1.00 |
Table 4 Diversity indices of total fish species caught in Otamiri River during the study period
H, shanon weiner’s; J, margarlef index; E, evenness; Q, equitability.
|
Taxa |
Station 1 |
Station 2 |
Station 3 |
|||||||||
|
H |
J |
E |
Q |
H |
J |
E |
Q |
H |
J |
E |
Q |
|
|
Cichlidae |
2.49 |
3.07 |
0.63 |
0.85 |
2.81 |
5.09 |
0.60 |
0.84 |
3.13 |
5.18 |
0.95 |
0.98 |
|
Notopteridae |
1.85 |
2.23 |
0.79 |
0.89 |
2.07 |
0.94 |
0.88 |
0.94 |
1.82 |
2.16 |
0.88 |
0.94 |
|
Clarotidae |
1.66 |
2.01 |
0.88 |
0.93 |
2.02 |
2.20 |
0.94 |
0.97 |
1.51 |
1.74 |
0.90 |
0.94 |
|
Alestidae |
1.27 |
1.37 |
0.89 |
0.92 |
1.50 |
1.73 |
0.75 |
0.84 |
2.14 |
3.22 |
0.94 |
0.97 |
|
Hepsetidae |
0.69 |
1.44 |
1.00 |
1.00 |
0.69 |
1.44 |
1.00 |
1.00 |
1.09 |
1.82 |
1.00 |
1.00 |
|
Mormyridae |
0.69 |
1.44 |
1.00 |
1.00 |
1.21 |
1.44 |
0.84 |
0.88 |
1.37 |
1.30 |
0.98 |
0.99 |
|
Gymnarchidae |
- |
- |
- |
- |
0.00 |
0.00 |
1.00 |
0.00 |
- |
- |
- |
- |
|
Channidae |
- |
- |
- |
- |
0.00 |
0.00 |
1.00 |
0.00 |
- |
- |
- |
- |
|
Cyrinidae |
- |
- |
- |
- |
0.69 |
1.00 |
1.00 |
1.00 |
- |
- |
- |
- |
Table 5 Spatial diversity indices of total fish species caught in Otamiri River during the study period
H = Shanon Weiner’s
J = Margarlef index
E =Evenness
Q = Equitability
This study has vividly established a threat in the composition, abundance and the diversity structure in the fisheries of Otamiri River which has resulted in the elimination of some species probably to their high flesh values from the river. The possible threat could be attributed to poor management practices around the river, and the over-exploitation of the resources from the surrounding populace. Thus the necessary measures to ensure the rejuvenating of these resources should be quickly implemented. Likewise, the anthropogenic activities around the river should be checked.
None.
Authors declare no conflict of interest exists.
None.

©2020 Temitope, et al. This is an open access article distributed under the terms of the, which permits unrestricted use, distribution, and build upon your work non-commercially.