International Journal of
eISSN: 2576-4454


Research Article Volume 3 Issue 4
1Department of Soil, Water and Climate, University of Minnesota, USA
2ARS-USDA Soil and Water Management Research Unit, University of Minnesota, USA
3Department of Agriculture, University of Minnesota, USA
Correspondence: Andry Ranaivoson, Department of Soil, Water and Climate, University of Minnesota, 1991 Upper Buford Circle, St. Paul, MN 55108, USA
Received: July 15, 2019 | Published: August 14, 2019
Citation: Ranaivoson A, Rice P, Moncrief JF, et al. Acetochlor and atrazine dissipation in a woodchip denitrifying bioreactor: a comparison of experimental results with model estimates. Int J Hydro. 2019;3(4):286-306. DOI: 10.15406/ijh.2019.03.00191
Keywords: woodchip bioreactors, acetochlor, atrazine, nitrate, total phosphorus, adsorption reactor model
The herbicides atrazine (2-chloro-4-ethylamino-6-isopropylamino-triazine) and acetochlor (2-chloro-2'-methyl-6-ethyl-N-ethoxymethylacetanilide) are extensively used with corn (Zea Mays)-soybean (Glycine max.) farming system in the Midwest to control weeds (pre/post-emergence). Atrazine inhibits photosynthesis and acetochlor disrupts protein synthesis in target plants.1 In a survey conducted by Minnesota Agriculture Department in 2005, acetochlor and atrazine was the second and third most applied herbicides to corn in surveyed areas covering 76counties and 280,000ha. The same document revealed that statewide use of acetochlor reached 125,000kg on corn crop while atrazine use was 45,000kg.2 Common metabolites of atrazine are de-ethyl atrazine (DEA), de-isopropyl atrazine (DIA), or hydroxyl atrazine (HA), whereas those of acetochlor are ethane sulfonic acid (ESA) and oxalic acid (OXA). These two herbicides as well as their metabolites have been detected in groundwater, drainage water, and in major waterways of the region.
Presence of herbicides in tile drainage water was reviewed by Kladivko et al.3 Some general principles of occurrence of herbicide in drainage water and associated conditions were outlined: (1) presence of subsurface drain tile influences infiltration and changes the partitioning of water between surface runoff and subsurface flow; (2) the fate and potential transport off-site are highly dependent on chemical properties of the pesticides and hydrologic conditions of the land; (3) main pesticide properties of interest are half-life (persistence) and soil sorption; (4) pesticides appear in tile drainflow during the first drainage event after application, and concentrations for successive events usually decline; (5) rainfall timing and depth relative to pesticide application timing and amount, in combination with soil type, seem to be the most important factors for pesticide transport to the subsurface drain. In a Minnesota case study by Buhler et al.,4 atrazine and alachlor (an acetanilide herbicide similar to acetochlor) were applied annually from 1985-1991 on a Webster clay loam with 6.3% of organic matter. Alachlor was detected in 2% of the tile water samples while atrazine was present in 97%. A significant decline in atrazine concentration was not observed until 24months after application ceased. Alachlor, on the other hand, was reported to have limited potential for transport into tile drainage water despite several years of continuous use.
Dissipation of herbicides in a denitrification bioreactor at both laboratory and pilot scales has been reported where herbicides underwent degradation (bio-transformation) and/or chemical/physical alterations (e.g. sorption). Nitrate- and pesticide- (trifluralin, fenitrothion, endosulfan) reduction experiments were run using a pilot-scale denitrification reactor.5,6 Reduction of both groups of chemicals was significant as long as residence time was greater than a 5-hour threshold. High concentrations of pesticides (atrazine) and antibiotics (enrofloxacin, sulfamethazine) were tested in laboratory assays using woodchips extracted from an in-situ reactor.7 Sorption was the dominant mechanism of reduction and denitrifier populations adapted to the antibiotics after 45days. The presence of atrazine did not impair denitrification. Wilber & Wang8 evaluated the dissipation of two acetanilide herbicides, alachlor and propachlor, in glass-bead biofilm columns under various conditions of metabolism, redox potential, and carbon sources. Both herbicides were transformed rapidly under sulfate-reducing conditions although they were also degraded in the presence of carbon sources (acetate and glucose) and under each of three electron acceptor conditions. Temporary loss of the external electron acceptors (O2, NO3, or SO42) slowed degradation of herbicides.
The most likely process for herbicide dissipation within the bioreactor is adsorption on woodchips.9-14 Adsorption of non-ionic compounds on wood is governed by herbicide hydrophobicity and wood lignin, which includes phenolic polymers with hydroxyl, carboxyl, and carbonyl groups.15,16 These oxygen-containing groups confer to lignin the ability to interact with organic compounds via several mechanisms: physical adsorption, hydrogen bonding, coordination and covalent linking, and acidic-basic interactions. Rodriguez-Cruz et al.12 investigated the role of wood properties and ionic properties of herbicides with respect to adsorption. The Freundlich affinity coefficients, Kf, thus obtained were higher than those reported for adsorption of the same pesticides by clay minerals, soil rich in clay minerals, and soil amended with residual organic matter. For non-ionic herbicides (alachlor), a significant relationship (linear regression) was established between the values of Kf, Kow (octanol-water partition coefficient--hydrophobicity), % wood soluble carbon, and % wood lignin concentration. Alachlor belongs to the acetanilide family and is similar to acetochlor in terms of physico-chemical properties.
Seybold et al.17 reported the breakdown of atrazine and metolachlor, an acetanilide herbicide similar to acetochlor, in anaerobic soil and in aqueous phase. Under strong reducing conditions, metoclachlor and atrazine degradation followed first-order and zero-order rates in the aqueous phase of wetland soil, respectively. Half-lives in the water column were 40days for metoclachlor and 80days for atrazine. Concentrations of metabolites peaked at day 25 of the experiment with atrazine degradates (HA, DEA, and DIA) while those of metolachlor (OSA, ESA) peaked at about half as long. Metabolites of atrazine persisted beyond 50days whereas concentrations of metabolites of metolachlor dropped sharply after 50days.
In the current experiment, the goal was to evaluate the effectiveness of a woodchip bioreactor to reduce quantities of acetochlor and atrazine in tile drain water and to investigate their primary mechanism of dissipation, by adsorption or degradation. We hypothesized that both mechanisms play significant roles in herbicide disappearance.
Bioreactor site and farm inputs of herbicides
The site, located near Dundas, Minnesota, USA (44o 25’43.50” N and 93o15’39.53”W), contains two tile-drained, row-crop agricultural fields; one field has a controlled drainage system and the other has a free drainage system. The controlled drainage system drains an area of 2.67ha where the bioreactor is located (Figure 1). The bioreactor is 0.90m wide, 27m long, and 1.80m deep; the depth consists of a layer of 0.60m of soil atop 1.20m of woodchips. The active flow porosity of the woodchip bed was estimated at 0.57m3/m3 from a laboratory experiment. The woodchips are mostly made up of maple (Acer negundo) and red oak (Quercus rubra) (Table 1). The controlled drainage system connects to the bioreactor by a main tile with a control structure containing flow chambers. Two considerations drove the choice of this site for the herbicide experiment: (1) an existing, functioning anaerobic bioreactor; and (2) an accessible water supply from an adjacent ditch (Figure 2).
Sieve opening, in. |
Sample weight, % |
Cumulative sample weight, % |
Red oak weight % |
Red oak |
0.500 |
29.4 |
100 |
20.0 |
Manually sub-sampled |
0.374 |
20.9 |
70.6 |
9.84 |
Manually sub-sampled |
0.187 |
33.3 |
49.7 |
7.80 |
Manually sub-sampled |
0.157 |
3.30 |
16.4 |
|
Too small for sub-sampling |
0.079 |
9.64 |
13.1 |
|
Too small for sub-sampling |
0.039 |
3.45 |
3.45 |
|
Too small for sub-sampling |
Table 1 Woodchip material granulometry and mixture as percentage of maple and red oak by weight. Red oak material was separated from maple wood chunk, where possible, based on visual observation at a given sieve opening. Average percentage of oak by weight is 12.5%
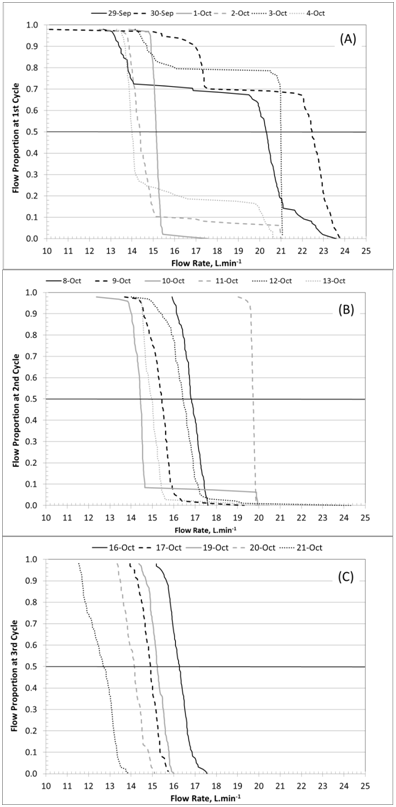
Figure 2 Flow proportion curves as related to daily flow rate per each experiment cycle. Graphs A, B, and C show curves from the 1st, 2nd, and 3rd cycles, respectively. Flow rate values used in the modeling represent 50% of total flow.
The woodchip denitrifying bioreactor was retrofitted with a water tower, pump, injector manifold, refrigerator, and automated control center to accommodate the herbicide dissipation experiments. The experimental set up held the flow rate at 15.1L/min (average) and allowed the spiking of known concentrations of the compounds of interest into the water flow. Based on bioreactor effective volume (20.3m3), the set flow rate targeted a 24-hour hydraulic residence time (HRT). Details of the retrofit set up are presented at Appendix A-1. In summary, at the onset of the experiment a pump was used to fill the bioreactor. Once full, the pump and tower system maintained flow through the bioreactor and a mixing injector, with a range of dilution ratios, delivered the herbicides. Herbicide concentrations entering the bioreactor were held at targeted levels and ratios (acetochlor:atrazine=2.0:1.6; 3.5:2.8; and 7.5:6.0g/L) by maintaining a 0.03% ratio of herbicide spiking solution to tile water. The rationale for these concentrations stems from the range observed in previous field research: for alachlor, 0.96g/L from a Minnesota field4 and 8.6g/L in an Iowa field;18 for atrazine the range was 1.3 to 8.6g/L from various Iowa locations.3,19,20 The lowest concentration in the series was chosen at four times the laboratory detection limit for acetochlor (0.5g/L). The stock solution used for the herbicide was the formulation in the commercial herbicide product Harness (Xtra 5.6L, MO/EPA reg. No 524-485; Monsanto, St. Louis) with 372g/L of acetochlor (1.39moles) and 300g/L of atrazine (1.38moles). A fixed amount of NO3--N was also added in the injected solution mix to keep a minimum concentration of 1.0mg/L of NO3--N entering the bioreactor. Experiments were conducted in three 6-day cycles, one for each paired acetochlor:atrazine concentration level, with maintenance and clean-up procedures implemented between runs, i.e. removal of duckweed delivered with the ditch water from the plumbing components.
Sampling and testing for herbicide, nitrate and total phosphorus
Shelters were installed at the inlet and outlet stations with an ISCO automated sampler fitted inside a refrigerator to keep samples at 4oC until collection time on the 6thday of the cycle. Tubing was placed in each inlet and outlet flow compartment to draw water samples. A pair of 1-L glass bottles was filled every day with one bottle containing sulfuric acid, to keep the final pH at 2.0 for nitrate and total phosphorus,21 And another bottle with no additives for herbicide testing. An additional 1-L bottle of water sample was collected at the end of each cycle to test for total suspended solids, nitrite, ammonium, and soluble phosphorus.
Ammonia (Method 4500NH3 BE), NO3--N and NO2--N (EPA Method 353.2), total suspended solids (USGS I-3765-85), soluble and total phosphorus (EPA Method 365.1) were tested in a commercial laboratory using EPA standard tests (Minnesota Valley Testing Laboratory, Inc., New Ulm, MN). The same laboratory was contracted for herbicide analysis based on a battery of tests called MDA List 1 (Appendix A-2) that determines concentrations of the two herbicides and two metabolites of atrazine (de-ethyl atrazine, DEA, and de-isopropyl atrazine, DIA). The set of chemical tests did not report metabolites for acetochlor. Laboratory detection limits for the herbicides and metabolites were 0.5g/L. Nitrate-N analysis was performed to evaluate if herbicides would limit or inhibit denitrification due to their potential toxicity to the denitrifying bacteria;22-24 Total phosphorus was measured to further investigate a trend of total phosphorus reduction observed in rainfall and snowmelt events prior to the herbicide experiment.
Analysis of woodchip properties
Wood properties such lignin content and C/N ratio (Table 2) were also determined. The lignin content of woodchips plays an important role in adsorption of organic chemicals. We quantified lignin content using the Klason method, which measures the residue obtained by total acid hydrolysis of the carbohydrate portion of the wood.25 Carbon-to-Nitrogen Ratio was determined by an automated combustion method using an induction furnace capable of simultaneous analysis of carbon and nitrogen.26 The ratio for carbon and nitrogen provides an estimate of wood longevity by denitrification as carbon is used as an electron donor, thus some carbon loss is expected over time.27
Sample |
Depth, cm |
Average lignin content, % |
Standard deviation lignin content, % |
C/N ratio |
C/N ratio |
C/N reduction, % |
Red Oak |
|
28.9 |
8.61 |
289 |
|
|
Maple |
|
25.6 |
4.14 |
228 |
|
|
Top Layer |
0-74 |
31.7 |
1.75 |
|
198 |
23.5 |
Bottom Layer |
74-122 |
33.1 |
1.84 |
|
218 |
15.8 |
Table 2 A comparison of woodchip lignin content in the original woodchips verses the bioreactor layers and woodchip carbon-to-nitrogen (C/N) ratio change per layer from 2007 to 2009. The increase in lignin in the bioreactor layers compared to the original red oak and maple samples denotes loss of cellulose and hemicellulose over time (10% loss by weight over two years in the upper layer, 0-74cm). Average C/N ratio of maple and red oak is 259, which was used to compute percent reduction
Bioreactor parameters; temperature, pH, oxidation-reduction potential and dissolved oxygen
An array of thermocouples for recording temperature data and three probes for denitrification parameters were installed. The first array of thermocouples was installed at three locations across the bioreactor length: (1) 4m after the inlet flow box, (2) in the center, and (3) 4m before the outlet flow box; at each of the three locations, ten thermocouples were attached to a vertical stick (2.4m) at a 20-cm interval and inserted into the bed of the bioreactor. The second array of thermocouples was installed in the soil at the inlet and outlet locations perpendicular to the length of the bioreactor and 1 m from its edge.
In the center of the bioreactor, three probes were attached to the same stick and inserted through an access hatch built with a frame wire to prevent woodchip interference. The dissolved oxygen (Campbell Scientific, Inc. Dissolved Oxygen Sensor, Model CS 511, Logan, UT), redox potential, and pH probes were attached at 20cm, 35cm and 40cm above the lower end of the stick, respectively (Campbell Scientific, Inc. pH Sensor, Model CSI M11, ORP Sensor CSIM11-ORP). Data from thermocouples and parameter probes were logged on a 20-minute time interval in a data storage system (Campbell CR 3000 with industrial-grade Compact Flash cards).
Since herbicide removal was observed in the field experiment, and yet no metabolites of atrazine were detected, it was assumed that no biotransformation occurred within the time frame studied and that adsorption would be the likely process by which the herbicides were removed. Therefore, an adsorption reactor approach for the modeling investigation was chosen. Since the system being modeled was dynamic (flowing water), classical sorption models such as Freundlich or Langmuir were not suitable for the simulation.28 Two models capable of representing the dynamic system were chosen for the work, Bohart-Adams and Yoon-Nelson.
Bohart-adams mathematical models for adsorption reactor
Originally, these models were classified as fixed-bed sorption models and usually applied on activated carbon columns, but the principle behind the derivation of the models allows their use for most adsorptive process. Bohart-Adams model (B-A from hereafter) is derived from two concurrent equations.29-31 One that relates rate of residual adsorbing capacity to adsorbing capacity and concentration of solute, and the other that ties solute concentration decrease rate with respect to depth of fixed bed, solute concentration, and flow velocity of solute passing through the adsorbent. The first equation is presented as follows:
(1)
Where N is residual adsorbing capacity, C as solute concentration, t is time, and K is a rate constant, and the second equation is written as follows:
(2)
Where N and C are as previously defined, D is the depth of the fixed bed (length, in the case of the bioreactor) and V is velocity of the flow passing through the fixed bed. By using cross-derivation on these two equations (Eq. 1 derived with respect to D and Eq.2 with respect to t) and by imposing boundary conditions, the Bohart-Adams equation is obtained by integration as:
(3)
By taking the exponential of both sides, one can obtain the breakthrough curve in terms of C/Co, Co being the initial concentration of the solute.
Yoon and nelson mathematical models for adsorption reactor
In a similar manner, Yoon & Nelson32,33 (Y-N from hereafter) showed that their model is based on adsorption kinetics of gas molecules passing through a fixed bed of charcoal. The reasoning is to establish two probability values, Q and P, as probability of adsorption and that of breakthrough (mass remaining in the effluent), respectively. First, the rate of decrease of Q is proportional to both Q and P and, next, the rate of decrease of the breakthrough concentration, Cb, is proportional to Cb itself and to the number of reactive sites at any moment. In turn, the number of reactive sites is proportional to the number of molecules adsorbed at any time, Ci-Cb (Ci being the initial concentration). And Ci-Cb and Cb are both proportional to Q and P, respectively, thus equation 4 follows as:
(4)
In addition, experimental evidence points out that rate of decrease in adsorption probability is directly proportional to the molecular concentration, C, the flow rate, F, and inversely proportional to the weight of the adsorbent matrix, W, thus:
(5)
With k introduced as a dimensionless constant of proportionality. By noting that P=1–Q and P=Cb/Ci, by posing k’=kCF/W, and by separating variables and integrating each side of the equation, one can obtain the equation for adsorption for molecules as:
(6)
Where k’, as the rate constant, has the dimension of reciprocal time (min-1) and t is the time required to obtain 50% breakthrough, Ci the inlet concentration and, Cb the breakthrough concentration. Equations 3 and 6 are the linearized forms of the models and the data from the herbicide experiment were fit to these expressions from which adsorption parameters for each model were derived.
Average flow rate and hydraulic residence time (HRT) per 6-day cycle
Based on the tipping bucket flow data across the three-cycle period, the average flow rate and the associated HRT were 16.7L/min and 20.5hours, respectively. Velocity (flow divided by sectional area) was also computed on a daily basis using the tipping bucket record and the method of Persson & Wittgren34 to associate flow rate with flow fraction. This method allowed the calculation of flow rate for a given period corresponding to 50% of flow fraction; this flow rate value was used to find average daily HRT based on the bioreactor effective volume (Table 3). This iteration was carried out on a daily basis for the three 6-day cycles of the herbicide experiment.
Cycle |
Date |
Flow rate (a), L.min-1 |
Linear velocity (b), cm.hr-1 |
Hydraulic residence time (c), hr. |
1st |
29-Sep |
20.3 |
118 |
16.7 |
30-Sep |
22.5 |
131 |
15.1 |
|
1-Oct |
15.1 |
88.2 |
22.4 |
|
2-Oct |
14.4 |
83.7 |
23.6 |
|
3-Oct |
21.0 |
122 |
16.1 |
|
4-Oct |
14.0 |
81.5 |
24.2 |
|
2nd |
8-Oct |
16.8 |
97.9 |
20.2 |
9-Oct |
15.4 |
89.9 |
22.0 |
|
10-Oct |
14.4 |
84.1 |
23.5 |
|
11-Oct |
19.7 |
115 |
17.2 |
|
12-Oct |
16.4 |
95.7 |
20.6 |
|
13-Oct |
14.9 |
87.1 |
22.7 |
|
3rd |
16-Oct |
16.3 |
94.7 |
20.8 |
17-Oct |
14.9 |
86.8 |
22.7 |
|
18-Oct (d) |
N/A |
N/A |
N/A |
|
19-Oct |
15.2 |
88.7 |
22.3 |
|
20-Oct |
14.1 |
82.4 |
24.0 |
|
21-Oct |
12.7 |
73.8 |
26.7 |
|
Total Average |
|
16.4 |
95.3 |
21.2 |
Total Standard Deviation |
|
2.80 |
16.3 |
3.23 |
Table 3 Average daily flow rate, linear velocity, and associated hydraulic residence time (HRT)
a. Average daily flow rate was obtained by taking the 50% of the probability curve and its corresponding flow rate (Figure 4). The flow rate value is converted to HRT with bioreactor effective volume (20.3m3).
b. Linear velocity (Lin. Veloc.) was calculated by dividing the flow rate with the bioreactor cross-section, perpendicular to the flow direction (106.8cmx121.9cm=13,021cm2). This velocity will be used in the mathematical models to derive adsorption parameters for the experiment.
c. HRT was directly calculated from the average daily flow rate and the effective volume of the bioreactor
d. On October 18, some outlet samples were lost to breakage of glass bottle and the water flowed only for some part of the day due to power failure.
Bioreactor parameters: temperature, pH, dissolved oxygen and oxidation-reduction potential
These parameters complete the assessment of the bioreactor regarding denitrification. Temperature within the bioreactor and the adjacent soil indicates the heat energy flow (in or out of the system) and provides the ambient temperature for the denitrification reaction, which is sensitive to temperature. Measurements of pH help track the occurrence of denitrification, which is an alkalinity-producing reaction (one mole of nitrate reduced for 1 mole of OH-);35 The curve usually shows an increasing trend over a small interval of values. Redox potential indicates the ability of a given environment to either reduce or oxidize any chemical compounds present. In the case of the bioreactor, the range of values span from slightly positive to zero, thus a slightly oxidizing environment. Denitrification itself is a suite of enzyme-mediated reactions that reduce nitrate to nitrogen gas, if favorable conditions are met.
The temperature data recorded at 14:00hours were used in the analysis. Inlet water temperature showed a downward trend during the herbicide experiment from 15oC on September 29, 2010, to 8oC on October 22, 2010. Vertical trend of temperatures (from 60cm to 180cm, below ground surface) at five stations (at bioreactor: inlet, center, outlet; in soil: inlet, outlet) followed the same decreasing trend over time (Figure 3). The soil temperature in the adjacent soils showed the same temporal and vertical trends, except that the final values were higher than those of the bioreactor. For example at the 120cm depth, on October 22, the soil temperatures in the soil and bioreactor at the inlet were 11.0oC and 8.2oC, respectively, and at the outlet were 12.4oC and 9.3oC, respectively (Figure 4). Figure 5 (graph A) shows the estimate of temperature differences between the bioreactor and the adjacent soil for the upper (80-120m) and lower (120-180cm) layers of the profile throughout the experiment. The graph indicates that heat energy flows from the soil into the bioreactor. Figure 5 (graph B) indicates that the inlet water temperature is influenced by air temperature since it is ditch water pumped into the bioreactor.
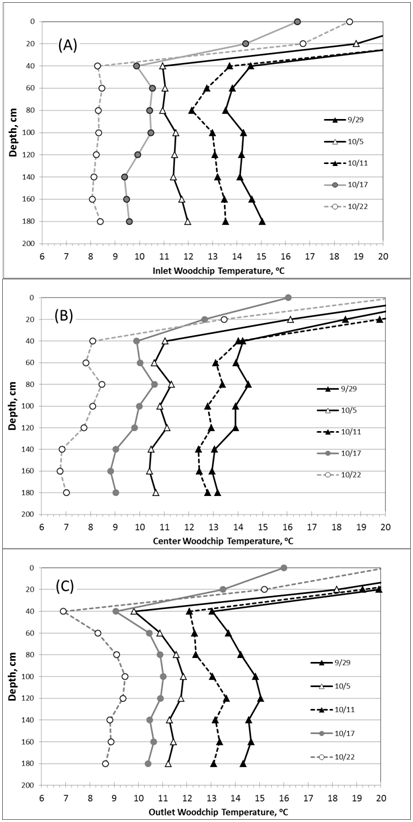
Figure 3Temporal trend of vertical temperature profiles along the length of the bioreactor. Graph (A) Reports temperatures at the inlet, graph (B) The center, and graph (C) At the outlet of the bioreactor. From the soil surface, 0-60 cm is the soil layer above the woodchips and 60-180cm is the woodchip layer.

Figure 4 Temporal trend of vertical temperature profiles in the soil adjacent to the bioreactor at inlet (A) and outlet (B).
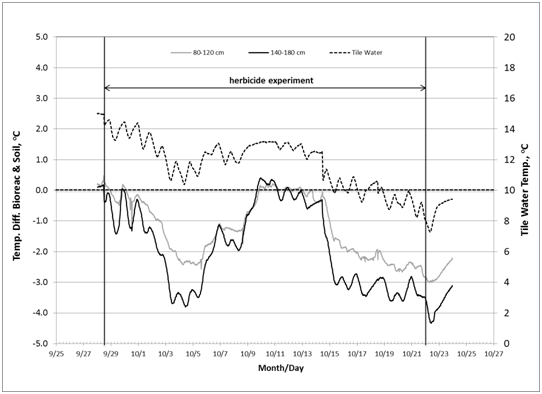
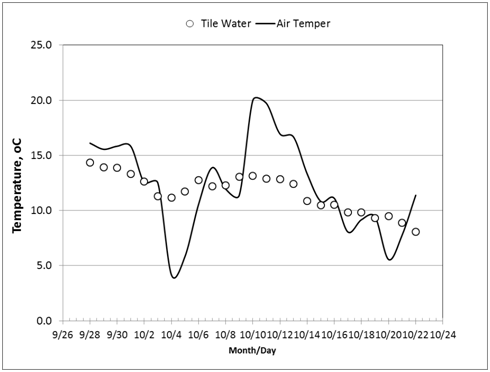
Figure 5 (A) Estimate of heat energy flow between bioreactor and adjacent soil during herbicide experiment; Y-axis (left): temperature difference between bioreactor and soil; Y-axis (right): incoming tile water temperature. (B): Temperature of air (average of maximum and minimum daily air temperature) and inlet tile water recorded at 14:00 hour.
Measured pH values showed a slight increase from 6.85 to 6.93 over the course of the experiment (September 28 to October 22) (Figure 6, Graph A). This increase is evidence of denitrification, which produces bicarbonate alkalinity and reduces carbonic acid.35 Concurrently, dissolved oxygen remains below 1.0ppm (0.4ppm) except at the start of the experiment when the bioreactor was being filled; this low oxygen situation keeps the entire system as an anoxic environment during the experiment. The redox potential curve shows slightly positive values (0to+70mV), which again is evidence that conditions were appropriate for denitrification (Figure 6, Graph B). Literature reports a critical value, +350mV, above which denitrification will not take place.36 Wastewater management practitioners recommend values between -100mV and +100mV for the anoxic zone where the majority of denitrification is taking place.
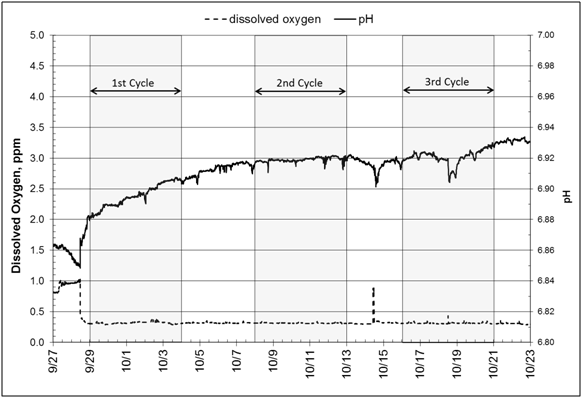
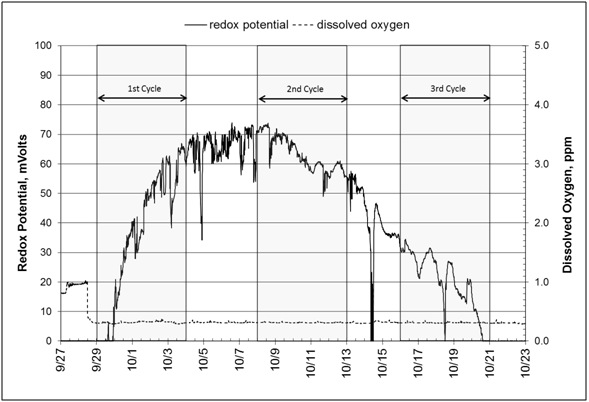
Figure 6 All measurements are taken midway between inlet and outlet stations at 1.68 m below ground surface. A: Graphs of pH and dissolved oxygen. B: Graphs of dissolved oxygen and redox potential (ORP) and dissolved oxygen.
Concentration and Load of Nitrate and Total Phosphorus
Inlet concentrations of nitrate spanned from 6.5mg NO3--N/L to 14.0mg NO3--N/L. Effluent concentrations for the three cycles remained below the MCL value of 10mg NO3--N/L (Figure 7). The overall nitrate load reductions from the first to the third cycle were 69%, 43%, and 33%, in that order (Table 4). The average load reduction was 47% indicates that denitrification was occurring. The decline in percentage of load reduction through the cycles correlates with the temperature decrease recorded through the three cycles; the vertical temperature average (60cm-180cm woodchip layer) for the first through third cycles was 13.1oC, 12.6oC, and 9.6oC, respectively. The average NO2--N concentrations for the second and third cycles increased from 0.047 to 0.578mg NO2--N/L at the inlet to outlet, respectively. Some relative accumulation of NO2--N has occurred during the herbicide experiment although concentrations have remained below the upper limit set by EPA for aquatic systems (1.0mg NO2--N /L). Ratios of NO2--N to NO3--N concentrations were 0.0061 and 0.64 for the second and third cycles, respectively. This accumulation of intermediate nitrogen compound may suggest that some denitrification reaction steps were not fully carried out.
Cycle |
Inlet concentration range, mg/L |
Pollutant |
Unit |
Load at inlet |
Load at outlet |
Reduction per cycle and average reduction, % |
1st |
7.01-11.8 |
Nitrate |
kg |
1.44 |
0.45 |
68.9 |
2nd |
13.3-13.8 |
Nitrate |
kg |
1.86 |
1.06 |
42.7 |
3rd |
13.0-14.1 |
Nitrate |
kg |
1.56 |
1.04 |
33.4 |
|
Total Load, kg |
|
|
4.85 |
2.55 |
47.4 |
1st |
0.233-0.327 |
Tot. P |
g |
44.3 |
8.35 |
81.2 |
2nd |
0.142-0.192 |
Tot. P |
g |
22.8 |
5.71 |
75.0 |
3rd |
0.090-0.102 |
Tot. P |
g |
9.64 |
2.02 |
79.1 |
|
Total Load, g |
|
|
76.8 |
16.1 |
78.4 |
Table 4 Concentration and flow-weighted load of nitrate and total phosphorus. Range of concentrations is given with cumulative mass per cycle at inlet and outlet
Tot P: total phosphorus
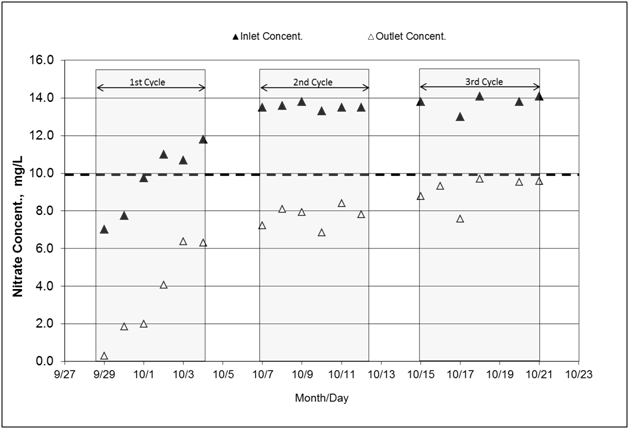
Figure 7 Nitrate-N concentrations measured at the inlet and outlet of the bioreactor. Nitrate-N was tested to ascertain that microorganism communities are carrying out denitrification in presence of herbicides, which can be toxic to some bacteria. The flowing water was spiked with 1.0 mg/L NO3--N. (Abbreviations, Concent.: concentration).
The total phosphorus cumulative load reduction reached 78%, from 76.8 to 16.1g at inlet and outlet, respectively (Table 4). Incoming concentrations consistently decreased across the three cycles; this decrease pattern is consistent to a previously observed trend of total phosphorus concentrations over the course of a given event at this site (unpublished data) (Figure 8). This reduction percentage, 78%, is in the high range as compared to other events (10%-35%) from this site. Total phosphorus concentrations at both inlet and outlet are mostly comprised of soluble phosphorus (99%). Since this load reduction is in the high range and most of the phosphorus is soluble, the findings suggest that biological reduction of phosphorus might have occurred. Some microorganisms, identified as “denitrifying phosphorus accumulating organisms”,37 have been described to have the ability to sustain their uptake activity under anoxic conditions.
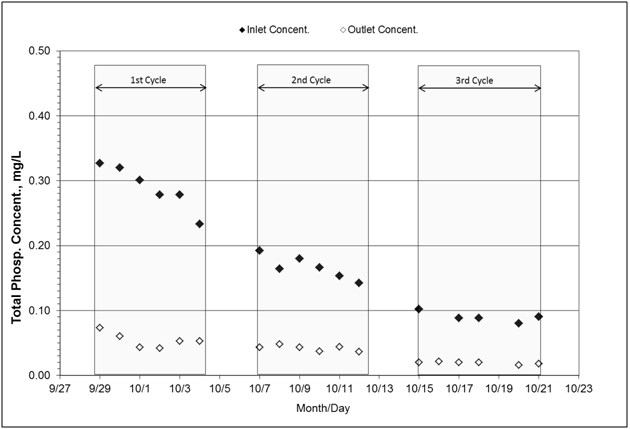
Figure 8 Concentrations of total phosphorus measured at the inlet and outlet of the bioreactor. Incoming water was not spiked for phosphorus. On average, total phosphorus consisted of 99% soluble phosphorus and less than 1% of particulate phosphorus. Total suspended solids concentration reached 6.0mg/L and 3.0mg/L at inlet and outlet, respectively (not shown on graph).
Concentration, load and adsorption simulation of acetochlor
The average acetochlor concentrations were 1.8, 3.0, 6.6mg/L, respectively, slightly below the target concentrations of 2.0, 3.5, 7.5mg/L (Figure 9). The cumulative load of acetochlor was reduced by 70% through the bioreactor across the three cycles with total loads of 1.45g and 0.43g at inlet and outlet, respectively (Table 5). Laboratory analysis of the water collected from the outlet of the bioreactor did not report acetochlor metabolites, therefore, the dissipation of acetochlor observed in this experiment was assumed to be other than degradation.
Cycle |
Target concentration, ug/L |
Inlet concentration range, ug/L |
Pollutant |
Unit |
Load at inlet |
Load at outlet |
Reduction per cycle and average reduction, % |
1st |
2.0 |
1.4-2.4 |
Acetochlor |
g |
0.27 |
0.09 |
67 |
2nd |
3.5 |
2.5-3.2 |
Acetochlor |
g |
0.41 |
0.14 |
67 |
3rd |
7.5 |
6.0-7.4 |
Acetochlor |
g |
0.77 |
0.21 |
73 |
|
Total Load, g |
|
|
|
1.5 |
0.43 |
70 |
1st |
1.6 |
1.1-1.7 |
Atrazine |
g |
0.19 |
0.09 |
51 |
2nd |
2.8 |
1.7-2.2 |
Atrazine |
g |
0.27 |
0.14 |
49 |
3rd |
6.0 |
4.2-5.0 |
Atrazine |
g |
0.48 |
0.21 |
57 |
|
Total Load, g |
|
|
g |
0.95 |
0.44 |
53 |
Table 5 Concentration and flow-weighted load of acetochlor and atrazine
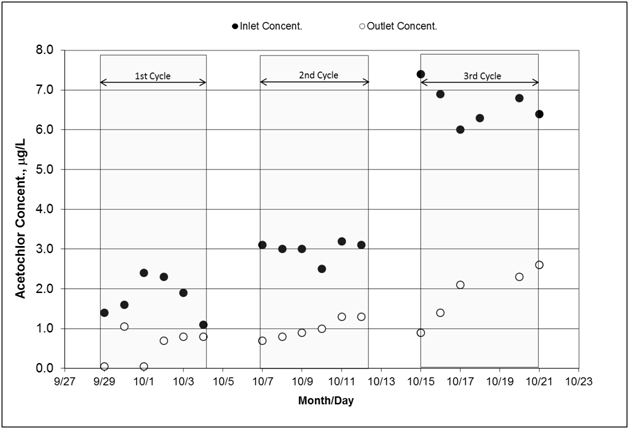
Figure 9 Concentrations of acetochlor measured at the inlet and outlet of the bioreactor. Since the inlet concentrations were not uniform, the associated statistics are given as follows: first cycle average: 1.78ug/L (Coefficient of variation: 29%), second cycle average: 2.98ug/L (CV: 8%), and third cycle average: 6.63ug/L (CV:8%).
The parameters generated with B-A model are presented in Table 6. Effluent concentration values were fitted to a linear equation according to Equation 3 and the parameters were derived from each cycle equation. The first cycle had the lowest determination coefficient (r2) for the fit; this low r-square was due to the unstable flow rate that ended up higher than the target values (15.0L min-1) on three out of six days (Figure 3A). The situation resulted in early breakthrough of acetochlor in the effluent (Figure 9) on 9/30. In further details within the first cycle, the curve of cumulative mass showed flat section where acetochlor mass did not adsorb on the wood matrix (Figure 10); the flat sections correspond to flow rates much greater than the target 15L/min (Table 3 on Sept 29, Sept 30, Oct 3). Thus high flow rates reduced opportunity for adsorption. This same trend is observed with solid phase extraction packing designed to remove chemicals from water, in which sample flow above recommended rates reduces the efficiency of the solid phase to adsorb the chemicals of interest (personal communication with research chemist and information brochure included with solid phase extraction products).

Figure 10 Mass of acetochlor accumulated in the bioreactor for each cycle with respect to pore volume. Accumulated mass are: 178mg (cycle 1), 274mg (cycle 2), and 562mg (cycle 3) with a total of 1014mg. Flow rate was on average 17.9, 16.3, 14.6L/min for first, second, third cycle, respectively.
Wood adsorption was calculated using the wood density measured in the laboratory, 0.26kg/cm3. Based on B-A model, only about 10% of the adsorption capacity (parameter No) of the woodchip was utilized during this experiment; however, time of exhaustion of the woodchip (C=Co) from the same model was reported as 7, 12, and 10days for first, second, and third cycle, respectively (Table 6). The bioreactor should have been able to dissipate more herbicide mass based on residual adsorptive capacity and mass of herbicide adsorbed on woodchip, but as shown in the previous paragraph, flow rate has a large impact on the latter value. The goodness of fit of the B-A model is given at Figure 11; root mean square deviation (RMSD) was used in comparing simulated and actual effluent values from each cycle calculated as the ratio of influent and effluent concentrations (C/Co on y-axis). The B-A was able to simulate quite closely the effluent concentrations from acetochlor.
Cycle |
Acetochlor linear equation |
Determ. coeff, r2 |
Avg K, cm3/ (mg.hr) |
Avg no, ug/kg |
Wood adsor, ug/kg |
Time of exhaust., days |
1st |
y=0.0197x-3.3275 |
0.33 |
11,910 |
43.5 |
4.6 |
7.0 |
2nd |
y=0.0055x-1.5812 |
0.92 |
1,856 |
113 |
7.6 |
12 |
3rd |
y=0.0090x-2.0542 |
0.76 |
1,363 |
185 |
18 |
9.7 |
Table 6 Linear equations per cycle and parameters of Acetochlor experiment based on Bohart-Adams model (Equation #3 in text)i()ii
iiAbbreviations in table, determ. coeff: determination coefficient/Wood adsorp.: wood adsorption/ time of exhaust.: time of exhaustion
The parameters generated by the Y-N model are presented in Table 7. The difference between the two models is the formulation of the concentration used for the linear equation. The Y-N linear model uses C/(Co-C) in contrast with C/Co as in B-A model. The determination coefficient mirrors that of the B-A model with the 1st cycle having a low value compared to the two other cycles. The two main parameters obtained from the Y-N linearization are the rate coefficient, Kyn, and t, which is the time to reach 50% concentration breakthrough. According to Y-N, the t model parameter is 5.3, 7.0, 6.8days for first, second, and third cycle, respectively. Time for concentration breakthrough (C=0.9Co) with the Y-N model is higher than predicted by B-A since the values are 9, 18, 14days for the first, second, and third cycle, respectively. Breakthrough concentration was considered at 0.9 of that of influent concentration (Co) due to practical considerations of field experiment and the mathematical formulation of the Y- N breakthrough curve. The RMSD values have the same magnitude as of those obtained by the B-A model (Figure 11).
Cycle |
Acetochlor linear equation |
Determ. coeff, r2 |
Kyn, hr-1 |
t, hr |
t, day |
1st |
Y=0.0258X-3.2825 |
0.32 |
0.026 |
127 |
5.3 |
2nd |
Y=0.0082X-1.3874 |
0.92 |
0.0082 |
169 |
7.0 |
3rd |
Y=0.012X-1.9472 |
0.78 |
0.012 |
162 |
6.8 |
Table 7 Linear equations per cycle and parameters of the Acetochlor experiment for Yoon-Nelson model (Equation #6 in text)iii
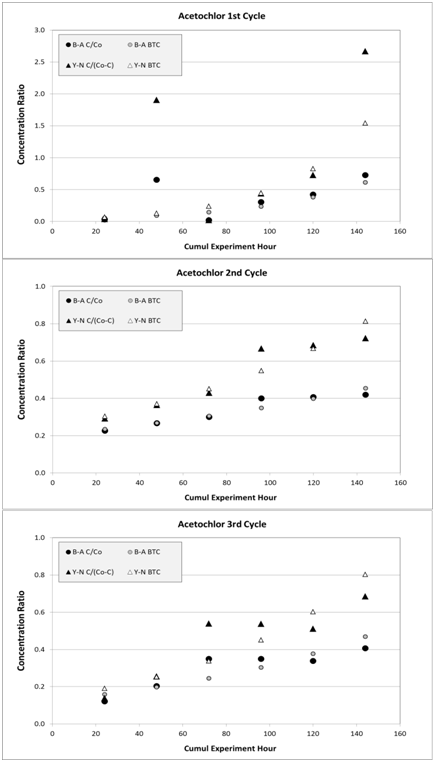
Figure 11 Simulated acetochlor data, as breakthrough curve (BTC), for three cycles from Bohart-Adams (B-A) and from Yoon-Nelson (Y-N) models, compared to experimental data, respectively. Concentration ratio is computed as C/Co with B-A and as C/(Co -C) with Y-N. Associated root mean square deviations (RMSD) are 0.24, 0.03, and 0.06 for B-A model and 1.52, 0.10, and 0.26 for Y-N model at first /graph (A) Second /graph (B) And third /graph (C) Cycles, respectively.
Concentration, load and adsorption simulation of atrazine
Similar to the situation with acetochlor the target spiked values for atrazine were not attained via the injector and flow rate combination; average concentrations for each run are shown in Figure 12. The overall dissipation of atrazine is 53% with total loads of 0.95g at inlet and 0.44g at outlet (Table 5). Laboratory analysis of the water collected from the outlet of the bioreactor did not contain atrazine metabolites, therefore the dissipation of atrazine observed in this investigation was assumed to be other than degradation. Similar to acetochlor, the two adsorption reactor models were applied to atrazine dissipation.

Figure 12 Concentrations of atrazine measured at the inlet and outlet of the bioreactor. Since the inlet concentrations were not uniform, the associated statistics are given as follows: first cycle average: 1.28ug/L (Coefficient of variation (CV):26%), second cycle average: 2.00ug/L (CV:8%), and third cycle average: 4.50ug/L (CV:7%).
The B-A model resulted in a better fit for atrazine than it had for acetochlor during the 1st cycle (r2=0.52 compared to r2=0.32 for acetochlor). Improved fit was also observed for the 2nd and 3rd cycles (Table 8) relative to the first cycle, as previously observed with acetochlor. The amount of adsorbed herbicide is less than 11% compared to the estimated residual adsorption capacity, thus the apparent explanation to this large fraction of unused adsorption site relies again on flow rate values (Figure 13). The RMSD is similar to that of acetochlor in terms of magnitude for the three cycles when comparing experimental with simulated data; B-A model closely fits atrazine experimental effluent data (Figure 14).
Cycle |
Atrazine linear equation |
Determ. coeff, r2 |
Avg K, cm3/ (mg.hr) |
Avg no, ug/kg |
Wood adsor., ug/kg |
Time of exhaust., days |
1st |
y=0.0188x-2.5862 |
0.52 |
15,588 |
25.6 |
2.5 |
5.7 |
2nd |
y=0.0047x-1.0750 |
0.8 |
2,365 |
60.5 |
3.7 |
9.5 |
3rd |
y=0.0090x-1.5795 |
0.78 |
2,008 |
96.0 |
10.2 |
7.4 |
Table 8 Linear equations per cycle and parameters of the Atrazine experiment based on Bohart-Adams model (Equation #3 in text)
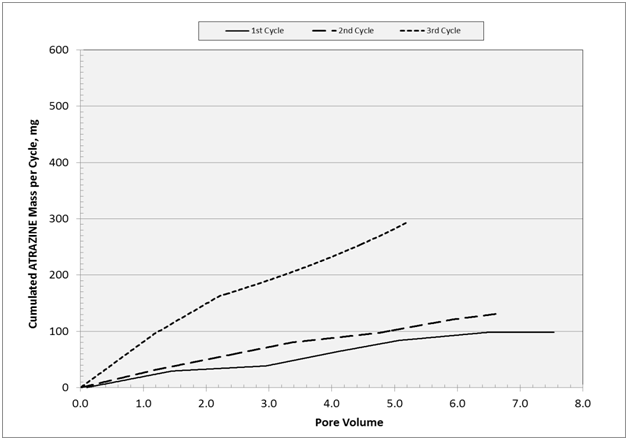
Figure 13 Cumulative mass of atrazine for each cycle with respect to pore volume unit. Accumulated mass are: 98 mg (cycle 1), 132mg (cycle 2), and 273mg (cycle 3) with a total of 503mg.
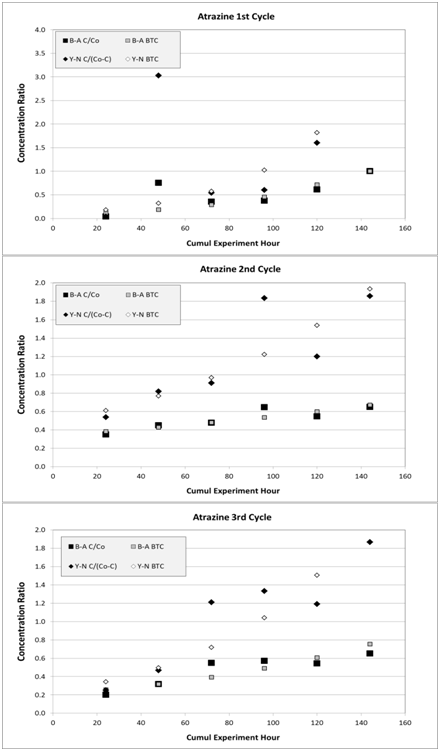
Figure 14 Simulated atrazine data, as breakthrough curve (BTC), for three cycles from Bohart-Adams (B-A) and from Yoon-Nelson (Y-N) models, compared to experimental data, respectively. Associated RMSD are 0.24, 0.05, and 0.09 for B-A model and 1.29, 0.29, and 0.30 for Y-N at first/graph (A) Second/graph (B) And third/graph (C) Cycles, respectively.
Parameters for Y-N model are presented in Table 9. The first cycle fit is again lower than the two following cycles in terms of determination coefficient. The Kyn parameter is comparable to that of acetochlor within the same order of magnitude. The tparameter gave smaller values compared to those of acetochlor (average: 3.7days vs. 6.4days), but closer together (standard deviation: 0.46 vs. 0.94). RMSD remains close to the same range as those of acetochlor (Figure 14) and time for concentration breakthrough (C=0.9Co) are 8, 13, 10days for the first, second, and third cycle cycle, respectively (Table 9).
Cycle |
Atrazine linear equation |
Determ. coeff, r2 |
Kyn, hr-1 |
t, hr |
t, day |
1st |
Y=0.024X-2.2825 |
0.3 |
0.024 |
95.1 |
4 |
2nd |
Y=0.0096X-0.722 |
0.79 |
0.0096 |
75.2 |
3.1 |
3rd |
Y=0.012X-1.9472 |
0.82 |
0.0154 |
93.4 |
3.9 |
Table 9 Linear equations per cycle and parameters of the Atrazine experiment for Yoon-Nelson model (Equation #6 in text)
Compared to atrazine, acetochlor showed a stronger affinity for the woodchips with regard to adsorption processes. Based on the quantities of acetochlor, atrazine cumulative mass should have given a total of 811mg, in agreement with the mass ratio in the applied formulated product (80%); actual atrazine cumulative mass was 503 mg or 50% of that of acetochlor (1014mg). Evaluation of the physical-chemical characteristics of the compounds and the logarithm of octanol-water partition coefficient (log Kow) for acetochlor (4.141) and atrazine (2.502) revealed a higher degree of hydrophobicity for acetochlor that may explain in part the observed stronger adsorption to the woodchips. The other possible cause of decreased adsorbed load of atrazine is the co-solute phenomenon30 also known as competitive adsorption. Previously cited researchers found that preferential sorption occurred when lindane (g-HCH) is mixed with other solutes like a-HCH, b-HCH, and DDT on active carbon fixed-bed. The sorption order became DDT>lindane>a-HCH>b-HCH, all from the same organo-chlorine insecticide family.
1http://sitem.herts.ac.uk/aeru/iupac/Reports/12.htm
2http://sitem.herts.ac.uk/aeru/iupac/Reports/43.htm
Herbicide dissipation was studied in a retrofitted field denitrifying bioreactor to handle an average flow rate of 15.0L/min (20.5-hour HRT) and to allow spiking the flow water with increasing concentrations of acetochlor and atrazine. The experiment was conducted over three 6-day cycles. Metabolites of atrazine were not detected in the water at the outlet of the bioreactor; thus, dissipation was believed to result from adsorption rather than degradation. It appears that herbicide hydrophobicity and woodchip lignin content contribute to the adsorption capacity of a woodchip bioreactor to dissipate acetochlor and atrazine. The bioreactor was thus considered as an adsorption reactor with a depth equal to its length and the layer of woodchip as its activated carbon column. By monitoring several bioreactor parameters, it was possible to study the conditions of denitrification and herbicide dissipation concomitantly; among those are temperature with vertical profile and temporal trends throughout the experiment. Based on temperature difference between the bioreactor and the adjacent soil, heat energy could flow from the outside to the inside of the bioreactor. Denitrification achieved a nitrate load reduction of 47% and total phosphorus load was reduced by 79%; the latter being made up mostly of soluble phosphorus.
The flow rate fluctuated during the first cycle, producing early concentration breakthroughs, while the following two cycles exhibited more stable flow rates. Substantial dissipation of the herbicides was observed throughout the three cycles with an average of 70% and 53% reduction in load for acetochlor and atrazine, respectively. Cumulative mass of each herbicide showed that adsorption rates are largely dependent on flow rate fluctuations despite the availability of potential sites on the wood matrix; final mass of herbicides did not follow the mass ratio formulation (atrazine/acetochlor=0.80). The first cycle demonstrated the effect of flow rate fluctuation on adsorption of both herbicides with cumulative mass curves displaying plateaus during faster flow rates (average: 20L/min).
Both Bohart-Adams (B&A) and Yoon-Nelson (Y&N) models provided parameterization of the bioreactor adsorption based on effluent concentrations for the two herbicides. Both models showed that breakthrough time of the herbicides can occur within two weeks despite a large residual adsorbing capacity of the wood material; B&A model estimated an average wood matrix exhaustion time of 9.5 and 7.5days for acetochlor and atrazine, respectively. For the Y&N model, breakthrough times (C=0.9Co) were 14 and 10days for acetochlor and atrazine, respectively.
In the experimental and modeled conditions evaluated here, adsorption appears to be the mechanism most important to herbicide dissipation with no evidence of degradation based on lack of detection of atrazine metabolites. This is in contrast to our hypothesis that both mechanisms would play a significant role in herbicide disappearance. The half-lives of acetochlor and atrazine herbicides in soil have been measured to be 3.4-29days and 28-150days, respectively (Herts-IUPAC, UK database). We anticipate the half-life of these herbicides in an anaerobic bioreactor would be greater. Additional experiments are required to determine the quantity of herbicides and possible degradates present in bioreactor outflow after greater lengths of time following herbicide exposure. The use of woodchip bioreactors to remove both nutrients and herbicides in tile drain water needs further assessment, including economic feasibility, to validate the promising results to date.
None.
The author declares that there are no conflict of interest.
None.
For the herbicide experiment, the site was retrofit to handle a constant flow rate of 15.1L/min and to spike a known concentration of herbicide in the water flow. Based on bioreactor effective volume (20.3m3), the set flow rate will insure approximately 24-hour residence time for water. The system handled 6 pairs of 1-L glass bottles for collecting water samples. Out of each pair of glass bottle, one collected herbicide sample while the other was acidified for sampling nitrate and total phosphorus. The sampling cycle was 6-day with a daily sub-sampling schedule (every 3hour for a volume of 120mL). To keep the water moving at a steady flow rate the system was built with the following components:
The pump was powered by a propane-fueled generator (WINCO, Inc. PSS8B/8,000-watt unit, Le Center, MN) and a set of water depth sensors in the water tower and electric command board activated the pump for automatic fill up of the water tower. A 15.24cm PVC pipe fed the water tower from the injection pump and another set of 15.24-cm, 5.08-cm, and 2.54-cm PVC pipe in series and check valve carries the water to the manifold. At start-up, the bioreactor was first filled directly with the pump and, later, the water was automatically pumped to the tower reservoir. After each run of 6-day cycle, the flow was stopped for maintenance (duckweed infestation in the ditch water) and for clean-up of the plumbing component. The set up allows a 10 cycles per day to fill the water tower and keep the flow running through the bioreactor. The mixing injector carries a range of dilution ratio to deliver given herbicide concentrations for (atrazine and acetochlor); the ratio used was 0.03% for all target concentrations (2.0, 3.5, 7.5ppb) (Table 3). The herbicide solution contained the commercially available formulated product Harness (Xtra 5.6L, Syngenta, EPA reg. No 524-485) with 372g/L of acetochlor and 300g/L of atrazine. A fixed amount of nitrate was also added in the injected solution mix to keep a final concentration of 1.0mg/L of NO3-N. All chemicals were weighed or pipetted to make a final volume in a 24.6-L glass jar. Two of the same glass jars were used in turn to transport prepared solutions to the field. Injected concentrations of herbicides stem from both analytical detection limit (0.5g/L) and concentration range of herbicides found in tile drain line.
Minnesota Department of Agriculture List 1 for herbicide analyzes 22 herbicides with GC-MS equipment that includes acetochlor and atrazine; it also includes atrazine metabolites de-ethyl-atrazine (DEA) and de-isopropyl-atrazine (DIA). Method 3510 is described in the following link:http://www.epa.gov/osw/hazard/testmethods/sw846/pdfs/3500c.pdf
The list provided by the commercial laboratory is given below
Item |
Herbicide |
Commercial name |
Method |
1 |
Acetochlor |
3510/GCMS |
|
2 |
Alachlor |
(Lasso) |
3510/GCMS |
3 |
Atrazine |
(Aatrex) |
3510/GCMS |
4 |
Chlorpyrifos |
(Lorsban) |
3510/GCMS |
5 |
Cyanazine |
(Bladex) |
3510/GCMS |
6 |
Deethylatrazine |
3510/GCMS |
|
7 |
Deisopropylatrazine |
3510/GCMS |
|
8 |
Dimethenamid |
(Frontier) |
3510/GCMS |
9 |
EPTC |
(Eradicane) |
3510/GCMS |
10 |
Ethalfluralin |
(Sonolan) |
3510/GCMS |
11 |
Fonofos |
(Dyphonate) |
3510/GCMS |
12 |
Metolachlor |
(Dual) |
3510/GCMS |
13 |
Metribuzin |
(Sencor, Lexone) |
3510/GCMS |
14 |
Pendimethalin |
(Prowl) |
3510/GCMS |
15 |
Phorate |
(Thimet) |
3510/GCMS |
16 |
Prometon |
(Pramitol) |
3510/GCMS |
17 |
Propachlor |
(Ramrod) |
3510/GCMS |
18 |
Propazine |
(Milogard) |
3510/GCMS |
19 |
Simazine |
(Princep) |
3510/GCMS |
20 |
Terbufos |
(Counter) |
3510/GCMS |
21 |
Tri-Allate |
(Far-Go) |
3510/GCMS |
22 |
Trifluralin |
(Treflan) |
3510/GCMS |

©2019 Ranaivoson, et al. This is an open access article distributed under the terms of the, which permits unrestricted use, distribution, and build upon your work non-commercially.