International Journal of
eISSN: 2577-8269


Research Article Volume 7 Issue 3
Professor, Colleges of Medicine and Graduate Studies, University of Science Arts and Technology, Montserrat
Correspondence: Orien L Tulp, PhD, MD, FACN, CNS, Professor, Colleges of Medicine and Graduate Studies, University of Science Arts and Technology, Montserrat, BWI, MSR1110
Received: April 26, 2023 | Published: May 15, 2023
Citation: Tulp OL. Does the epigenetic expression of obesity, insulin resistance and their metabolic sequelae contribute to brain senescence? Int J Fam Commun Med. 2023;7(3):67-71. DOI: 10.15406/ijfcm.2023.07.00314
Cognitive senescence and brain shrinkage have been reported in Alzheimer’s disease and is often associated with obesity but the pathophysiologic factors which bring about the neural declines remain unclear. A retrospective examination of factors of Insulin resistance and obesity in lean and obese rats indicated that final body weights of obese phenotype were more than double those of their lean littermates throughout adulthood, and carcass fat content at 10.5 months of age 15-fold greater than similarly fed lean littermates. In addition, the life span of the obese phenotype was decreased by approximately 30% in both male and female rats compared to their lean littermates. In addition, glycemic parameters indicated that the obese rats developed significant insulin resistance, while brain lipid, protein and DNA content were significantly reduced by one third or more in the obese phenotype by ~10 months of age, when they had approached their peak body weights. These observations suggest that the onset and progression obesity and its metabolic sequelae contributes to brain shrinkage, decreased DNA and protein content, key factors in the development of cognitive senescence in aging in this strain of rat.
Keywords: obesity, brain development, hyperinsulinemia, senescence, DNA, starch, sucrose, rat
The incidence of obesity has increased to alarming proportions among most Westernized nations as they emerged from an agricultural to an industrialized economy in recent decades.1 Along with the increase in obesity and overweight conditions the prevalence of Alzheimer’s disease has also increased, and the collective impact of both conditions and their commonly associated metabolic sequelae including hypertension (HTN) and non-insulin dependent diabetes (NIDDM) and their associated cytokine-mediated chronic inflammation have resulted in serious challenges for institutions to provide optimal medical care to all those who may be impacted.2–10 The onset of obesity, once considered a common observation commencing around middle age, has now been reported in much younger individuals including adolescents, where it is likely to remain throughout adulthood, and contributing to the development of syndromes including insulin resistance.1 As reviewed, one of the common findings in obesity and overweight conditions is a state of chronic low-grade inflammation, including the generation and release of IL-6 and other inflammatory cytokines linked to chemoattractant proteins including MCP-1.10 The inflammatory state has been associated with premature decline, increased mortality and morbidity resulting from the comorbidities cited above.2–7 In addition, increased adiposity and obesity have been linked to premature dementia and Alzheimer’s disease, and in impaired neurodevelopment and DNA damage in multiple tissues especially when it occurs during the aging process.2–7 The brain has also been found to develop elements of insulin resistance, that may implicate multiple hormonal actions.4,7,8 Thus, the purpose of this editorial is to review the magnitude of brain shrinkage in aging, obese hyperinsulinemia-prone rats, where the obesity is expressed as an independent autosomal recessive genetic trait, and compared to their normally reared lean littermates where the obesity syndrome does not develop.13–16 The biochemical mechanisms that result in brain shrinkage in aging are incompletely defines, but likely implicate both nutritional and physiologic factors including alterations in biochemically and epigenetically mediated processes of DNA metabolism such as DNA- and histone-methylation, alterations in chromatin remodeling with advancing age, gut factors, and nutrient absorption and bioavailability.
Inflammation has been shown to result in neurodegeneration of DNA in various tissues, including the CNS, and is likely linked to the development of chronic insulin resistance and neuroinflammation and eventual premature neurocellular apoptosis.2–4 The origin of much of the inflammatory cytokines resides within adipose tissue depots and ultimately distributed systemically with visceral adipose tissue likely contributing a significant role in this as it does to other aspects of the pathophysiologic sequelae of metabolic dysregulation.17–19 The profound obesity that develops soon after weaning in this strain demonstrated marked elevations in plasma insulin, amylin, leptin and other regulatory hormones, while chronic decreases in both sympathetically- and thyroidally-mediated hormonal actions effecting aspects of key energy metabolism remain present throughout their known lifespan.13,20–22 This strain of corpulent rat is deemed particularly well suited for comparisons between obesity and leanness and adding brain shrinkage as the unique expression of the epigenetic recessive trait remains the only established difference between the congenic lean and the obese phenotypes, thereby establishing the obesity trait as an independent risk factor of significance, and the multiple hormonal mechanisms which contribute to the development of the obese stigmata are now well established.13–16
In the current study, considerations for PICOT (Animal Population and strain, Time and Phenotype, Comparison with a congenic littermate, final Outcome upon end of the study, and Time in age) were incorporated into the experimental design of the study.17 Animals of the LA/Ntul//-cp congenic rodent strain were reared in plexiglass cages as littermate pairs. Cages were lined with approximately one inch of fresh pine shavings and maintained in a 50% RH/22°C ventilated environment throughout. Rats were allowed house water and a refined semisynthetic diet ad libitum. The diet contained 54% cornstarch, 20% protein, 16% mixed fats, and essential vitamins, minerals and essential fiber as described by Michaelis et al.15 from weaning until 10-11 months of age. Animals were maintained at 50% RH at 22°C in a well-ventilated animal room. At ~10 months of age animals were sacrificed via cervical dislocation and bloods were collected for serum insulin and glucose concentration. Measures of brain and body composition including brain lipid, protein, and DNA and of carcass protein and fat content determined at ~10 months of age as described previously.18–21 For the longevity study depicted in Figure 1 rats were maintained under the same environmental conditions but received Purina Chow #5012 from weaning, Data reported were analyzed via standard statistical procedures as previously cited.18,22,23
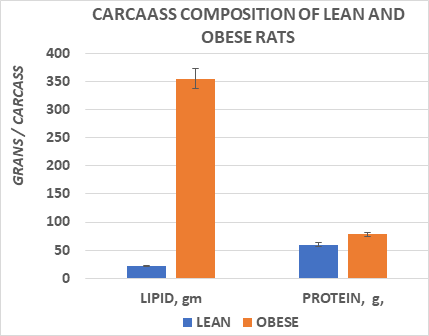
The effects of body weight and longevity are depicted in Figure 1, taken from approximately 700 measurements of normally fed rats from our breeding colony. That data indicates that final body weights of the obese phenotype of both sexes while similar at weaning, gained weight rapidly and remained approximately 3-fold greater than their lean littermates throughout adulthood, while being of similar body weights. In addition, the obese phenotype in both sexes tended to attain their maximal lifespan up to 6 or more months earlier than their respective lean littermates while consuming the same diet and environmental conditions. In Figure 2, carcass fat and protein content of male rats at ~10 months of age are reflected and indicate that carcass fat content of obese rats was 15-fold greater than similarly fed lean littermates, and carcass protein content was also a modest 20 percent greater in the obese rats, consistent with the greater load bearing impact of the obesity in those animals.

Figure 1 Data are mean ± 1 SEM, n=4 to 12 rats/group of over 600 rats. Data extracted from ILAR News Journal 32(3), 1990 and Global Summit on Endocrinology, April 18, 2023.

Figure 2 Data are mean ± 1 SEM, n=8 rats/group. Carcass composition obtained in male rats at 10 months of age. Data extracted from Michaelis et al, 1988. pp 13-15.
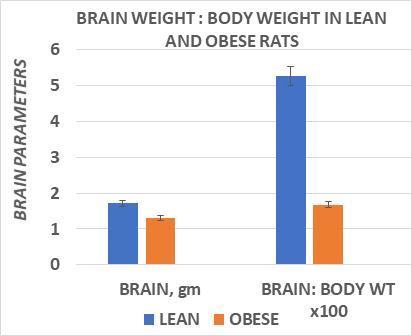
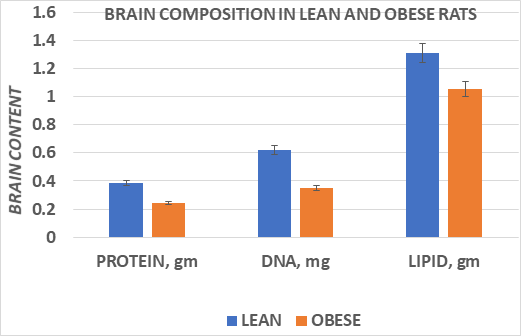
In Figure 3, brain weights of male obese rats were obtained at ~10 months of age, at a time when they had attained their peak body weights and indicted that brain weight of obese rate were approximately one third less than were observed in their lean littermates. The effects of brain weight and body weights are depicted in Figure 3 and indicates that brain weights were significantly lower in the obese than in the lean phenotype when measured at 10.5 months of age. In addition, the ratio of brain weight to body weight was significantly less in the obese than the lean littermates as expected, at least partially reflective of the greater adiposity of the obese rats but the magnitude of the difference was more than would have been predicted had the brain mass have not been decreased in the aging obese rats. The composition of the brain tissue is depicted in Figure 4, and indicates that the brain lipid, protein, and DNA content was generally proportional to the reduced brain mass, with only a modest trend toward an increase in brain lipid content among obese animals (77% in lean vs 81%, in obese, p=n.s.).

Figure 3 Data are mean ± 1 SEM, n= 8 rats/group. Data extracted from J Psychol & Clin Psych 2023; 14(3), PP38-43.

Figure 4 Data are mean ± 1 SEM, n= 8 rats/group. Data extracted from J Psychol & Clin Psych 2023: 14(3), pp 38-43.
Measures of plasma glucose and insulin concentrations at four months of age are depicted in Figure 5 and indicate that while animals of both lean and obese phenotypes were euglycemic, plasma insulin concentrations and the insulin to glucose ratios were markedly increased in the obese phenotype. Michaelis et al.15 and Huang et al.29 previously reported that the obese phenotype of this strain remains euglycemic but hyperinsulinemic and demonstrate parameters of insulin resistance via an impaired oral glucose tolerance throughout much if not all of their lifespan, consistent with the observations of this cited study.13,14,20-24
As depicted in Figure 1, when animals were maintained under standard laboratory conditions including a well-established optimal rodent chow diet, the longevity of the obese male rats was approximately 30% less than their lean littermates that tended to survive for 35 or more months with the same nutritional regimen. The females tended to survive even longer than the males, but the obese females also tended to succumb to aging approximately 30% sooner than their lean female littermates. The LA/Ntul//-cp is deemed a suitable model to investigate the isolated parameters of obesity as the NIH background LA/N strain has been noted for its longevity-prone lifespan. The series of backcrossing accomplished a congenic status where the only demonstrated difference between lean and obese littermates was the epigenetic expression of the obese characteristic as an autosomal recessive trait, and which has remained true for multiple generations of offspring.13 Since the only known difference between the lean and the obese phenotypes of either sex is believed to be the epigenetic expression of the obese phenotype, this observation suggests that the presence of obesity along with its typical metabolic sequelae including hyperinsulinemia and disordered glycemic and glucocorticoid parameters likely contributed to their earlier demise.31 Hyperinsulinemia and an impaired glucose tolerance occur in the obese phenotype of this strain, but the obese animals have not developed frank NIDDM even when fed sucrose-laden high glycemic index diets to date, despite a severe magnitude of obesity and obesity-linked insulin resistance.13–15 In contrast to the magnitude of obesity, the obese phenotype was found to have a modestly greater lean mass, as indicated by the greater carcass protein content, and reflective therefore of the greater body weight load-bearing mass caused by the greater fat mass of the obesity.28
Dysregulation of glucocorticoid activity is a common observation in obesity, where it impaired the intracellular and membrane-linked actions of insulin on affinity for essential glucose transporter proteins.13,18,24,29,30 The glucocorticoid hormones also have been shown to contribute to the impaired glucose regulation in the obese phenotype of this strain.29,30 Thus, glucocorticoid actions are presumed to impede the formation and intracellular translocation of GLUT4 transporters in insulin dependent tissues including adipose tissue, skeletal muscle, and brain, three of the most dependent tissues for processes requiring insulin-mediated and facilitated glucose uptake. Adrenalectomy reversed the magnitude of insulin resistance, enabled a restoration of the impaired thermogenesis and a normalization of glycemic responses to a glucose challenge withing only days following the removal of the glucocorticoid influences.29
In contrast, when the brain tissues were analyzed in the present review, the total brain weight was decreased by an average of 25%, and the brain total lipid, protein and DNA content were decreased to a similar magnitude. The percent of lipid in the obese phenotype was 80.9%, while the percent lipid in the lean animals averages a close 77-78% by weight.16 Thus, the brain shrinkage was generally proportional to the lipid, protein, and DNA content. While no specific behavioral or psychological tests were conducted in this study, the decrease in total brain DNA content is consistent with reduced brain cellularity, which in malnutrition studies had been associated with decreased cognitive performance. The obese animals were housed in littermate pairs with equal ad libitum access to the same dietary regimens, so specific nutritional factors are unlikely to have played a role in the apparent brain shrinkage.
The magnitude of insulin resistance is reflected in Figure 5 and confirms the hyperinsulinemic state in the obese phenotype. Historically the magnitude of insulin resistance and glucose intolerance is of lesser magnitude in female vs male obese rats, and if in fact the magnitude of hyperinsulinemia and obesity may correlate with the magnitude of inflammatory responses, then it may help to explain the greater longevity observed in the females than the males. Regardless of the metabolic or inflammatory factors associated with the greater longevity in females, they routinely survived longer than their male counterparts while consuming the same dietary regimen and housing conditions.
This is believed to be the first detailed report of brain composition in obesity associated brain shrinkage in aging obese rats and may provide a window to further explore the relationship between brain biochemistry and functions in the rat, and perhaps to better understand the pathophysiologic process of brain shrinkage as it occurs in Alzheimer’s disease in the elderly. The rapid increase in the incidence of obesity beginning in adolescence and continuing into adulthood and later years has now attained epidemic proportions in industrialized societies, where the potential demands for the delivery of health care resources. The findings are indicative of promoting healthy changes in dietary practices toward more healthy options such as the heart healthy Mediterranean diet, which can lower the magnitude of inflammation and its likely sequelae when compared to some other less heart healthy dietary options often practices in Westernized, industrialized societies.
The results of this review demonstrate the occurrence of brain shrinkage in aging obese rats, of a magnitude similar to that which occurs in dementia and Alzheimer’s disease in aged humans and appears to be linked at least in part to factors associated with chronic hyperinsulinemia, insulin resistance, and neuroinflammation. The reduced brain mass was associated with generally proportional decreases in brain total protein and DNA content, such that had cognitive studies been conducted would in all likelihood have demonstrated corresponding decreases in cognitive and exploratory activity, but which assessments were not reliably possible considering the standard oversized plexiglass showbox cages in which the animals were housed throughout their lifespan and the unanticipated discovery of brain shrinkage. Body fat content was markedly increased, and longevity decreased in the obese phenotype, consistent with an obesity linked association with a reduced life span in the obese but not in their lean littermates that lacked the epigenetic expression of the obesity trait. Obesity has often been linked to other comorbidities including hypertension and non-insulin dependent diabetes, but in the present study the reduced lifespan occurred where the presence of obesity was the only known variable. This strain of rat is a congenic animal model with no other known obvious or directly linked genetically encoded comorbidities. In the obese phenotypes of the LA/Ntul//-cp and the closely related corpulent strains of rats arterial atheroma’s and fatty streaks, indicators of cardiovascular disease have been reported and may therefore have also contributed to the decreased longevity observed in this review.23,24 Whatever the pathophysiology involved, the obese phenotype demonstrated a significant reduction in longevity in association with significant brain shrinkage and neurocellular loss.
The PICOT format referenced above is a helpful approach for summarizing research questions that explore the effect of therapy:5
The author is grateful for the Institutional resources made available by the University of Science Arts and Technology, Montserrat for the development of this editorial review.
The author declares there is no conflict of interest.

©2023 Tulp. This is an open access article distributed under the terms of the, which permits unrestricted use, distribution, and build upon your work non-commercially.