eISSN: 2469-2778


Case Report Volume 9 Issue 2
1Abu Dhabi Stem Cells Center. Al Misahah Street. - Zone 1. Villa no. 25. Abu Dhabi, Al Rowdah, Unite Arab Emirates
2Sheikh Khalifa Medical City Hospital, Abu Dhabi, Unite Arab Emirates, UAE
Correspondence: Dr. Carlos A Villegas Valverde MD, MSc, Associate Professor and Associate Researcher, Abu Dhabi Stem Cells Center
Received: March 05, 2021 | Published: March 18, 2021
Citation: Villegas-Valverde CA, Ventura-Carmenate Y, Alkaabi FM, et al. Early immune reconstitution assessment by flow/mass cytometry in autologous hematopoietic transplantation performed in a patient with multiple myeloma. Hematol Transfus Int J. 2021;9(2):21-26. DOI: 10.15406/htij.2021.09.00246
Evaluation of immunoprofile as predictive and prognostic biomarker are essential to follow up patients in Multiple Myeloma after autologous hematopoietic stem cells transplantation (AHSCT). It can be defining the engraftment and predicts complications. An AHSCT was performed for the first time in the United Arab Emirates to treat a patient with multiple myeloma. We apply the evaluation of the patient's immune status before and during the early follow-up by flow and mass cytometry. The analysis revealed a decrease in all leukocyte populations in blood seven days after transplantation, mainly of B and T helper lymphocytes. The patients showed diarrhea and cellulitis as complications. An increase in regulatory T and NK lymphocytes was evidenced at the same time. 28 days’ post-transplantation, all lymphocyte populations were recovered, except for B lymphocytes, a high level of T regulatory and NK was maintained. The early immune restoration coincided with the recovery of the complications presented by the patient. the leukocyte composition of apheresis was similar to that found in blood at baseline time. Our study evidenced that the extended immunoprofile by mass cytometry could be useful to predict the outcome and response to transplantation.
Keywords: immune reconstitution, autologous hematopoietic stem cells transplantation, flow cytometry, mass cytometry
Multiple myeloma (MM) accounts for approximately 10% of hematologic malignancies. Its ranks fourth incidence among malignant hemopathies in the United Arab Emirate (UAE).1 Autologous stem cells transplantation (ASCT) has remains as the standard of care for patients younger than 65 years. The progression-free survival rate of transplant-eligible cases is approximately 34-60% at 5 years and an overall survival rate of 10-40% at 10 years. However, the success of this therapy, depends on multiple factors, including the therapeutic response, due to its impact on relapses. In this sense one aspect that has to be evaluated as a predictive biomarker is patient´s immune status.2–4
Within the most important biomarkers are immunoprofiling before and after ASCT, including immune reconstitution. The consensus on the cellular populations that should be evaluated as predictors of response, focus on the lymphocyte immunophenotypes, especially Natural Killer cells (NK) and T regulatory cells (Tregs).2–4 At present, flow cytometry is mainly used for single-cell immunophenotyping. However, its disadvantages include: a certain limitation in the number of markers that can be used in the same cell and the complexity of compensating for spectral overlap. Mass cytometry, a relatively novel technology, does not have these limitations and around 40 markers can be used simultaneously on the same cell, which considerably broadens the single-cell analysis.5
Abu Dhabi Stem Cells Center and Sheikh Khalifa Hospital preformed the first ASCT in the UAE in a patient with MM; the evaluations of the state of the immune system and early reconstitution are outlined. The nascent autochthonous ASCT program that is being developed in the country showcases the importance of the evaluation of predictive and prognostic biomarkers by flow and mass cytometry, which is evident in the case.
Case description
A 49-year-old male patient was diagnosed with multiple myeloma in May 2018. The pre-transplant treatment completed seven cycles compound by vincristine, dexamethasone, Bortezomib, lenalidomide and the end carfilzomib, lenalidomide and dexamethasone (KRd). A very good partial response was obtained after KRd, followed by an autologous stem cell transplantation. It was performed two apheresis session followed by Melphalan protocol. The engraftment happened ten days after transplantation (WBCs counts started to rise). The patient had diarrhea and cellulitis as a complication of the immunosuppression, his condition was resolved after seven days with antibiotic treatment.
Diagnostic assessment
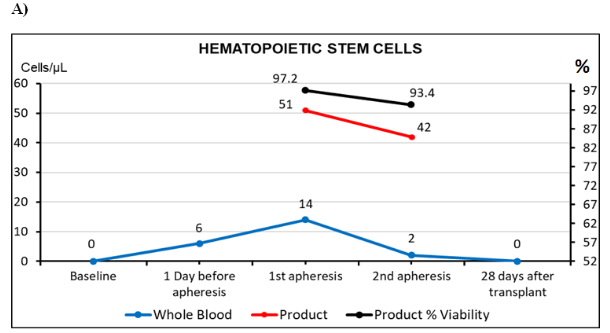
The stem cell CD34+ identification and count was assessed by flow cytometry as per the ISHAGE protocol.6 Day of admission, the cells CD34+ were undetectable in peripheral blood. At the fourth post-mobilization day with Neupogen at 10 mcg/kg/day, the CD34+ were in 6 cells/µL therefore apheresis was postponed. The next day (fifth), CD34+ cells increased to 14 cells/µL and the first apheresis was conducted, collecting 510 cells/µL in the bag and the second one 420 cells/µL. The resulting dose administered to the patient was 3.6 x 10⁶ cells/Kg (Figure 1A). Mononuclear cells (MNC) collection efficiency (CE) was in 90.0%. Calculated by the formula: CE (%) = collected MNC yield/[Avg MNC count x (WB volume processed – AC volume)] x 100. Legend: Avg MNC count=(subject pre-procedure MNC + Subject post-procedure MNC)/2 and AC=anticoagulant volume.7
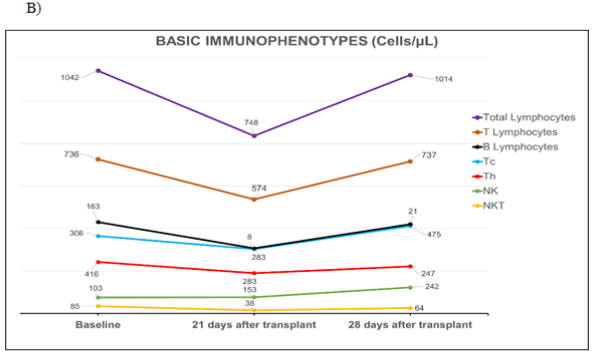
Flow cytometry assessment: Three peripheral blood immunoprofiles were made by flow cytometry: at admission, at 21 and 28 days’ post-transplantation (Figure 1). The pre-transplantation Neutrophil/Lymphocytes Ratio was 1.4, and at days 21 and 28 were 3.3 and 1.5 respectively. A decrease in all lymphocyte subpopulations was found at day 21. B lymphocytes were the most affected, decreasing to 8 cells/µL, followed by helper T lymphocytes (Th) with 283 cells/µL (Figure 1B). While the NK cells showed a tendency to increase. At 28 days there was an immune reconstitution with values similar to those found at baseline. However, B lymphocytes did not show a recovery (21 cells/µL). The NK cells augmented more than double those found from basal conditions. Treg at admission were within the normal range (2.5% of CD4+ T lymphocytes). At 21 days, their blood concentration quadrupled (8.6%) respect to baseline time due to the increase of natural and activated Treg subsets. At 28 days their concentration decreased but maintained values much higher than those of baseline time (Figure 1C).


Figure 1 Basic immunophenotypes studies by flow cytometry.
A) Identification and enumeration of stem cells in peripheral blood and the product of the two apheresis, performed on the patient during transplantation process. Cellular viability was included in the obtained product. Cellular values in the bag refer to dilution 1:10. ISHAGE recommendations were followed for absolute count by single platform. B) Quantification of lymphocyte subpopulations before and after transplantation. C) Immunophenotype of T regulatory cells (Treg) before and after transplantation. Tregs, detected as percentage of all lymphocytes and the rest of Treg subpopulations as percentages of Th lymphocytes.
Tc, lymphocytes t cytotoxic; Th, lymphocytes t helper; NK, natural killer cells; NKT, natural killer t cells. These studies were performed by 10 colors flow cytometer Beckman Coulter, Navios Ex.
Mass cytometry assessment: Immunophenotyping by mass cytometry, using the Maxpar® Direct™ Immune Profiling Assay™ kit, was performed on the two collected products and in patient’s peripheral blood at day 21 (Table 1). Global decrease in B lymphocytes in peripheral blood at 21 days, was due to naive, memory and transitional cells, with high levels of plasma cells (0.42%). In the case of Th lymphocytes, which were also more diminished at 21 days in peripheral blood, because of naive and central memory cells, with a relative increase of effector memory phenotype. In the characterization of MNC carried out on the products, cellular concentrations were found similar to those existing in the peripheral blood from basal conditions. However, a decrease in T lymphocyte concentrations was found in apheresis in comparison to baseline whole blood (60.2% vs 70.6% respectively), especially of TCD8+ lymphocytes (29.3% vs 6.1%, respectively). Comparison between first and the second apheresis showed a considerable increase of TCD8+ lymphocytes (6.17% vs 19.9%, respectively) and of their terminally differentiated subpopulation (1.3% vs 4.8%, respectively). However, an opposite trend was detected in monocytes (16.7% vs 6.8%) (Table 1).
|
Populations |
1st apheresis product |
2nd apheresis product |
Peripheral blood. 21 days after ASCT |
|||
|
Cells |
% |
Cells |
% |
Cells |
% |
|
|
Intact Lives Cells |
165655 |
100 |
300000 |
100 |
206091 |
100 |
|
Lymphocytes |
41346 |
24.96 |
63255 |
21.09 |
41743 |
20.25 |
|
1. CD3 T Cells |
24087 |
58.26 |
39417 |
62.31 |
28973 |
69.41 |
|
· CD8 T cells |
2550 |
6.17 |
12587 |
19.9 |
12390 |
29.68 |
|
Naïve |
497 |
1.2 |
3010 |
4.76 |
774 |
1.85 |
|
Central Memory |
20 |
0.05 |
504 |
0.8 |
348 |
0.83 |
|
Effector Memory |
1477 |
3.57 |
6033 |
9.54 |
5918 |
14.18 |
|
Terminal Effector |
556 |
1.34 |
3040 |
4.81 |
5350 |
12.81 |
|
· CD4 T cells |
17704 |
42.81 |
20774 |
32.84 |
14708 |
35.23 |
|
Naïve |
7708 |
18.64 |
6581 |
10.4 |
1331 |
3.19 |
|
Central Memory |
1991 |
4.81 |
5139 |
8.12 |
4674 |
11.2 |
|
Effector Memory |
6314 |
15.27 |
7261 |
11.48 |
7324 |
17.55 |
|
Terminal Effector |
1691 |
4.1 |
1793 |
2.83 |
1379 |
3.3 |
|
Treg |
904 |
2.19 |
1128 |
1.78 |
2849 |
6.83 |
|
Th1-like |
513 |
1.24 |
621 |
0.98 |
1001 |
2.4 |
|
Th2-like |
2396 |
5.79 |
3039 |
4.8 |
3034 |
7.27 |
|
Th17-like |
2253 |
5.45 |
2702 |
4.27 |
1220 |
2.92 |
|
2. T cells with TCR-γδ |
1043 |
2.52 |
2336 |
3.69 |
632 |
1.51 |
|
3. MAIT & NKT CD4- cells |
2790 |
6.75 |
3720 |
5.88 |
1243 |
2.98 |
|
4. B cells |
6800 |
16.45 |
11802 |
18.66 |
505 |
1.21 |
|
Naïve |
6124 |
14.81 |
11084 |
17.52 |
302 |
0.72 |
|
Memory |
292 |
0.71 |
326 |
0.52 |
28 |
0.07 |
|
Plasmablasts |
384 |
0.93 |
392 |
0.62 |
175 |
0.42 |
|
5. NK cells |
10459 |
25.3 |
12036 |
19.03 |
12265 |
29.38 |
|
Early NK |
2690 |
6.5 |
2690 |
4.25 |
6202 |
14.86 |
|
Late NK |
7839 |
18.95 |
9346 |
14.78 |
6063 |
14.52 |
|
6. Monocytes |
29932 |
18.07 |
23759 |
7.92 |
6908 |
3.35 |
|
Classical |
27594 |
16.66 |
20395 |
6.8 |
5646 |
81.73 |
|
Transitional |
2272 |
1.37 |
3065 |
1.02 |
779 |
11.28 |
|
Non-classical |
66 |
0.04 |
299 |
0.1 |
483 |
6.99 |
|
7. Dendritic Cells |
2 |
0 |
1045 |
0.35 |
925 |
0.45 |
|
pDC |
0 |
0 |
879 |
0.29 |
364 |
39.35 |
|
mDC |
2 |
0 |
166 |
0.06 |
561 |
60.65 |
|
8. Granulocytes |
41530 |
25.07 |
173864 |
57.95 |
133566 |
64.81 |
|
Neutrophils |
41373 |
24.98 |
146272 |
48.76 |
129239 |
62.71 |
|
Basophils |
69 |
0.04 |
0 |
0 |
0 |
0 |
|
Eosinophils |
3 |
0 |
2 |
0 |
28 |
0.01 |
|
CD66b-Neutrophils |
85 |
0.05 |
27590 |
9.2 |
4299 |
2.09 |
|
9. NLR |
- |
- |
- |
- |
- |
3.2 |
Table 1 Leukocyte immunophenotypes characterized by mass cytometry
ASCT, autologous stem cells transplantation; Treg, T regulatory cells; Th, T helper cells; TCR, T Cells Receptor; NK, natural killer cells; NKT, natural killer t cells; MAIT, mucosal associated invariant t cells; pDC, plasmacytoid dendritic cells; mDC, myeloid dendritic cells; NLR, neutrophil lymphocyte rate
The percentage (%) of lymphocytes subset were calculated from overall lymphocytes, the rest of % populations were calculating from intact live cells. These studies were performed by mass cytometer, Helios™ CyTOF® technology by Fluidigm
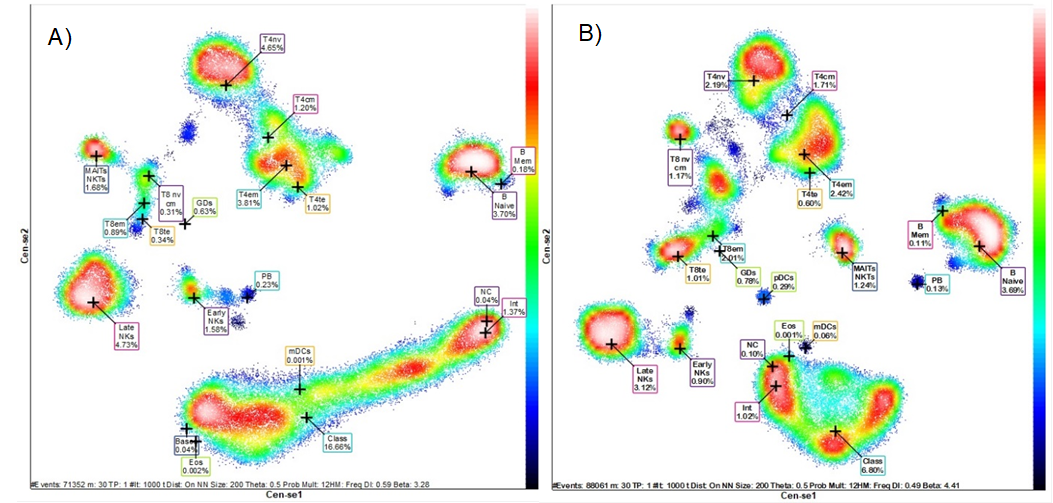
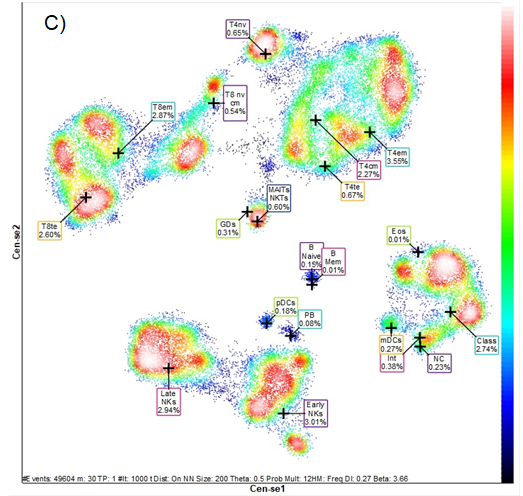
Figure 2 shows frequency heat maps with the groups representing the different subsets of leukocytes and lymphocytes contained in the two apheresis products and in the peripheral blood at 21 days after transplantation. Each group shows the heterogeneous composition and concentration of leukocyte and lymphocyte populations of innate and adaptive immunity. These changes in cell subpopulations and concentration can be seen graphically in a single dimensionality reduction image. High-dimensional analysis was performed by Maxpar® Direct™.


Figure 2 Mass cytometry pictures. n-dimensional analysis (Frequency Heatmap).
Distribution of the different leukocyte populations and several subpopulations in A) product of the first apheresis, B) product of the second apheresis and C) peripheral blood at 21 days post-transplantation.Legend: T4nv, naïve T helper cells; T8nv, cytotoxic T cells naïve; T4cm, central memory T helper cells; T8cm, central memory T cytotoxic cells; T4em, effector memory T helper cells; T8cm, effector memory T cytotoxic cells; T4te, terminal effector T helper cells; T8te, terminal effector T cytotoxic cells; GDs, Gamma Delta T cells; MAITs, mucosal associate invariant T cells; NKTs, Natural Killers T cells; B Mem, memory B lymphocytes; PB, plasmablasts; NK, Natural killers cells; Eos, eosinophils; Class, classical monocytes; Int, transitional monocytes; NC, Non-classical monocytes; pDC, plasmocytoid dendritic cells; mDC, myeloid dendritic cells. Black-blue less concentrate to red white high concentrate Analysis by Maxpart® PathsetterTM (Fluidigm).
To found prognostic and predictive biomarkers response to transplantation continues to be a challenge and is required for personalized and precision medicine. In this way, the evaluation of the immunoprofile reveals immune reconstitution and can predict the progression-free interval, relapses and survival as subrogate biomarkers of immune surveillance. Also, the risk of sepsis can be predicted, the relevance of subsequent transplants and the selection of immunotherapy.5,8 An element of good prognosis found in this patient was an NLR <3.0 before transplantation, although on day 21 it was slightly high (3.3) and on day 28 it normalized. Immune dysregulation and chronic inflammation constitute a poor prognosis in MM, the monocyte and lymphocyte counts, as well as the NLR are established prognostic biomarkers but must be measured at baseline conditions and after transplantation. Early immune reconstitution within the first month is also a good prognosis.8 The improvement of two presented clinical complications (diarrhea and sepsis) coincided with the increase in the early immune replacement presented in this patient. Which could be related to the improvement of the immunocompetent cell concentrations and a better control of the inflammation that is generated in these patients.
The relative count of Tregs increased after engraftment of auto-HSCT. It became higher than pre-transplant level and then in the following 21 and 28 days was still high (Figure 1C). this result was similar to finding by Derman et al.9 Their excess at the time of engraftment is associated with early relapse; although relapses should be assessed over the course of a year.2 Subpopulations of Tregs undergoes the same kinetics before and after engraftment but it's values between 21 and 28 days decreased to close to baseline levels. Treg/CD45RA+ is considered a quiescent subpopulation and remained at low values with little modification during the transplantation process which may be related to a relative resistance to melphalan and the reposition from the product of apheresis. The extended immunophenotype allows to know the concentration of several subpopulations that make up a specific lineage, which allows a more precise interpretation of the result. For instance, the increase in Treg post-tranplantation predicts poor prognosis, especially if its rising the memory cells, which are already primed to tumor antigens, but if it occurs in the naive subset, they can contribute to control inflammation and improve the prognosis. The opposite occurs with memory TCD8+ where the cells supplied within the graft contribute to the control of the disease, even when the graft is contaminated with malignant myeloma cells, as it could have happened in this case due to the predominance of plasmablasts detected in the graft.9–11
Regards to NK cells in patients who recovered more than 100 cells/µL at 1-month pos-ASCT, has longer progression-free survival compared to those with low NK cell recovery. Evidence shows that other lymphocytes do not have the same prognosis association strength as these cells have, so special attention is paid to them when evaluating them as prognostic biomarkers, that include defense against infectious diseases.12,13
Mass cytometry has the ability to detect a large number of parameters (in this case 40 parameters) and is a convenient method for accurate immunoprofiling of the apheresis product and peripheral blood. Allowed the quantification of monocyte subpopulations both in apheresis and in the patient's peripheral blood 21 days after transplantation. Percentages and absolute count of the classical, intermediate and non-classical monocyte subsets among CD14+ monocytes did not differ from values reporting previously for MM patients after ASCT.14 These cells belong to innate immunity and are associated with the inflammatory process and seem to be involved in the development of myeloma bone disease through the release of soluble mediators that stimulate osteoclastogenesis, and the presence of non-classical monocytes may be a potential marker for increased osteoclast precursors. These cells also provide protection against infections.15
Mass cytometry made possible to show in which specific leukocyte subpopulations, lie the changes found in the different measurements, since this technology allows the analysis of several subphenotypes of each major population (T, B and NK). Using a detailed immunophenotype can improve the prognostic and predictive value of the evaluation of the immune system, both in the evaluation of post-transplant immune reconstitution and in the evolution and outcomes of the underlying disease. This can only be done by multiparametric methods with high-dimensional single cell analysis, in which mass cytometry is a valued technology (Figure 2).
Evaluation of extended immunoprofile by mass cytometry is essential to predict outcome and response to transplantation. It was found that the improvement in complications coincided with early immune reconstitution, evaluated by mass and flow cytometry. Additionally, extended immunoprofiling could be used to predict graft success and relapse, assess immune surveillance against tumor cells, and prevent infectious complications. Our case was the first ASCT achieved in the UAE.
The authors declare that there are no conflicts of interest regarding the publication of this paper.
None.
The studies involving human participants were reviewed and approved by Research Ethic Committee of Abu Dhabi Stem Cells Center. The patient provided their written informed consent to participate in this study. This study was not experimental. Ethical guideline was conducted in accordance with the Declaration of Helsinki.

©2021 Villegas-Valverde, et al. This is an open access article distributed under the terms of the, which permits unrestricted use, distribution, and build upon your work non-commercially.