eISSN: 2576-4497


Narative Review Volume 7 Issue 4
1Neurology Resident Physician, Department of Neurology, Hospital Universitario La Cardio, Bogotá, Colombia
2Academic Coordinator Adult Intensive Care Unit, MSc Education for Health Professionals, Department of Critical Medicine and Intensive Care, Hospital Universitario San Vicente Fundación, Medellín, Colombia
3Medical Specialist in Critical Medicine & Intensive Care, Department of Critical Medicine and Intensive Care, Hospital General de Medellin, Medellín, Colombia
4Medical Specialist in Critical Medicine & Intensive Care, Department of Critical Medicine and Intensive Care, Clnica Angiosur, Medellín, Colombia
5Professor, Universidad CES, Colombia
Correspondence: Dormar David Barrios Martínez, Academic Coordinator Adult Intensive Care Unit, MSc Education for Health Professionals, Department of Critical Medicine and Intensive Care, Hospital Universitario San Vicente Fundación, Medellín, Colombia
Received: December 02, 2024 | Published: December 13, 2024
Citation: Mendoza MCV, Martínez DDB. Multimodal cerebral perfusion monitoring, use at the patient’s bedside. Hos Pal Med Int Jnl. 2024;7(4):136-141. DOI: 10.15406/hpmij.2024.07.00258
The human brain is the organ that consumes the most oxygen in the basal state, when presenting a decrease in oxygen supply, physiological mechanisms are activated to preserve this supply and thus avoid permanent brain injuries. When a brain injury of any cause occurs, it is essential to carry out a correct diagnosis and monitoring, to establish early and effective therapeutic actions to reduce secondary organic damage, seeking to improve the prognosis of patients with severe neurological injuries. Next, a review of the physiology of cerebral metabolism and multimodal perfusion monitoring techniques, measurement of cerebral metabolism and its correct interpretation is carried out.
Keywords: brain, brain metabolism, brain monitoring, neurocritical care, neuroprotection
From a metabolic point of view, the brain is the most oxygen-consuming organ in the human body. The human brain accounts for 2% of body weight and uses 15-20% of cardiac output and consumes approximately 20% of total body oxygen and 25% of all glucose.1,2 The neuron, the main cell of the nervous system, is more than 90% dependent on oxygen for ATP production and almost exclusively dependent on oxygen to generate energy from glucose. Its consumption in healthy people is approximately 3.5 ml/100g tissue/min. Of this, only about one third of the oxygen is consumed since it also has a large reserve capacity.1 Oxygen demands are directly proportional to the neuronal metabolic rate. Oxygen is entirely used for mitochondrial oxidation of glucose in order to generate energy.1,3
A detailed review of how oxygen is involved in multiple metabolic tasks at the brain level and how it has systemic repercussions in the face of brain dysfunction; how this irregular behavior leads to multiple disorders and its multi-organ effect. In order to know the current status of this topic, a narrative review was carried out, aimed at finding out different techniques to perform multimodal cerebral perfusion monitoring, indications, devices and current implications. The relevant terms or keywords used to perform the bibliographic searches were: Brain, Brain metabolism, Brain monitoring, Neurocritical care, Neuro protection, Brain, Brain metabolism, Brain monitoring, Neurocritical care, Neuroprotection. These terms are referred to as free language, and the MeSH platform was used to translate them into controlled language. The following databases were used to conduct the narrative review: PubMed, Embase, Google Scholar, Scielo, Cochrane. Part of the search was limited to text articles only (Table 1).4
|
Inclusion and exclusion criteria |
||
|
Items |
Inclusion Criteria |
Exclusion Criteria |
|
Language |
English & Spanish |
Different languages |
|
Seniority |
Maximum 10 years |
More than 10 years |
|
Thematic |
Narrative Reviews, Sysematic Reviews, Meta-analyses and Clinical Practice Guidelines |
Articles different from the inclusion criteria |
|
Quality |
The recommendations of the Scale for the Assessment of Narrative Review Articles - SANRA(25) were followed |
Guidelines other than inclusion criteria |
|
MeSH terms |
Brain, Brain metabolism, Brain monitoring, Neurocritical care, Neuroprotection, Brain, Brain metabolism, Brain monitoring, Neurocritical care, Neuroprotection |
Terms different from the inclusion criteria |
Table 1 Methodology
When we talk about the functional and structural organization of the central nervous system we must know that it has three components: neurons, supporting tissues or glia and blood vessels. Neurons are maintained from birth and have a particular characteristic, "they cannot reproduce when damaged or destroyed".1
According to their function, there are three types of cells at the brain level:1
- Afferent or sensitive neurons: transform external stimuli from the environment into a motor and electrical reflex, which can occur involuntarily (e.g., breathing).
- Efferent or motor neurons: propagate nerve impulses from the central nervous system to effector tissues such as muscles and glands.
- Multipolar neurons or interneurons: interconnect afferent and efferent neurons within neural pathways.
A major component in brain physiology is cerebrospinal fluid (CSF), which bathes the brain parenchyma. It has a volume of approximately 150 ml with a daily production of approximately 500 ml at a rate of approximately 0.35 ml/minute, two-thirds of which is produced by the choroid plexuses and one-third by the arachnoid membranes.5 Experimental biomodels suggest that cerebrospinal fluid production remains stable if cerebral perfusion pressure is maintained between 50-60 mmHg (CPP = MAT - ICP) (Cerebral perfusion pressure: CPP; Mean arterial pressure: MAT; Intracranial pressure: ICP).1 Normal CSF pressure is between 70-180 mmH2O, with an average of 130 mmH2O; which is equal to 10 mmHg in the horizontal position.6 The functions of CSF are diverse. As it has the same density as the brain, it allows the brain to float, maintaining a weight of 50 grams. It also helps protect against direct or indirect impact and keeps the brain stable during changes in position, respiration or fluctuations in blood pressure. On the other hand, it allows the transport of substances such as neurotransmitters, hormones and ions, maintaining the ionic balance within the CNS.1 The CSF also helps to eliminate fluids, proteins, cells and metabolic waste production, however, the glymphatic system has recently been described as a mechanism for promoting the efficient elimination of soluble proteins and metabolites from the central nervous system and also facilitating the distribution throughout the brain of various compounds, including glucose, lipids, amino acids, growth factors and neuromodulators.7,8 Water transport is regulated by specific proteins called "aquaporins" (AQP). In CSF, sodium is the main cation and its concentration is similar to that of plasma. On the contrary, chlorine is found at higher concentrations in plasma due to the impermeability of the BBB which is conditioned by the Donnan effect which speaks of the equilibrium that occurs between ions when crossing the membrane that will depend on the concentrations of these and their charges.9 On the other hand, glucose is transported by diffusion facilitated by the GLUT transport system, its concentration is equal to 60% of that of plasma.1,3,10
The Monro-Kellie model describes intracranial pressure (ICP) as the sum of the pressures produced by the volume of the brain parenchyma, cerebrospinal fluid and blood contained within the veins and arteries, the latter two remaining constant values. Normal values will vary with age, changes in body position and clinical situation. In healthy people the normal ICP value is 7-15 mmHg in the horizontal position and negative in the standing position.1,11 To maintain constant ICP, any variation in the volume of any of the compartments must be counter-regulated by the others. When this mechanism fails, ICP increases. CSF contributes significantly to ICP regulation in the acute phase, mainly through the pressure gradient in the dural venous sinus, which is responsible for 90% of the increase in ICP, while changes in CSF production and resistance in transit or absorption do not have a major influence on ICP levels.1,11 Cerebral blood flow (CBF) is about 55 ml/100 g of brain tissue per minute, which corresponds to approximately 15% of the entire cardiac output. FSC is higher in gray matter (78 ml/100g/min) compared to white matter (18 ml/100g/min).5
According to the Hagen-Poiseuille equation, laminar flow through a blood vessel is proportional to the pressure difference between the inlet and outlet of the circuit and to the vessel diameter, and inversely proportional to the viscosity of the circulating fluid.12
This pressure gradient is obtained by calculating the difference between the mean arterial pressure and the venous pressure; this is called the cerebral perfusion pressure. As venous pressure is difficult to measure, intracranial pressure is measured instead.1
PPC = PAM - PIC
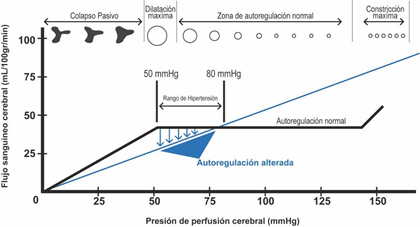
Cerebral blood vessels have the intrinsic capacity to maintain a constant cerebral flow, in a cerebral perfusion pressure range between 50 - 150 mmHg, this is known as cerebral autoregulation. Cerebral autoregulation originates from the resistance of the arterioles which adapt their diameter in relation to different stimuli, thus determining cerebral vascular resistance. When CPP increases above 50 mmHg, cerebral arterioles begin to contract, and cerebral vascular resistance begins to increase in order to maintain a constant cerebral flow. Conversely, when cerebral perfusion pressure decreases, cerebral vascular resistance decreases due to vasodilatation (Figure 1).1,12,13 Under pathological conditions this mechanism is compromised and takes a linear trend, as mean arterial pressure falls, cerebral blood flow decreases and as mean arterial pressure rises, cerebral blood flow increases. This means that cerebral blood flow depends on the control of the tone of cerebral arterioles, which are modulated by cerebral perfusion pressure.5 There are also metabolic factors that intervene in the regulation of cerebral perfusion pressure, among these are acidosis and tissue hypoxia that cause cerebral vasodilatation and therefore increase cerebral blood flow, which ultimately leads to greater intracranial hypertension.1,11,12,14,15 Another mechanism of great importance is the regulation of arterial vessels by partial pressure of CO2, where for every 1 mmHg change in paCO2, cerebral blood volume increases 0.04 ml/100 g of brain tissue.1,11

Figure 1 Brain Autoregulation Curve1.
Among the different factors that contribute to increased or decreased cerebral blood flow are:1
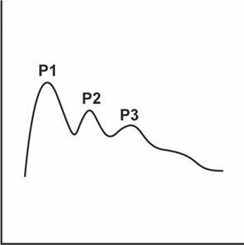
The ICP curve has three peaks in its morphology (Figure 2).1 The first peak reflects the intracranial inflow of arterial flow, while the other two are a reflection of venous flow. The first is called the percussion wave (P1), which has a large, broad, well-defined peak and represents the arterial pulse over the choroid plexuses and reflects cerebral flow. The second peak is the plateau or tidal wave (P2) and its amplitude is variable but less than P1 and the third peak, also known as the dicrotic wave (P3), these last two waves reflect the retrograde venous beat of the jugular veins over the cortical veins. It is important to know that, although the absolute value in the monitor is not modified, it is always necessary to evaluate the morphology of the waves, because it can happen that the morphology shows an increase in P2 greater than P1 and P3 (pyramidal shape) which speaks of venous hypertension, without representing changes in the absolute value of ICP, which alludes to a decrease in compliance.1,12

Figure 2 Intracranial pressure1.
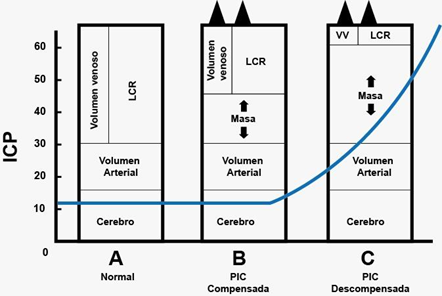
The relationship between volume and pressure in the brain is not linear, which means that in physiological situations brain volume can vary without causing alterations in ICP, thanks to compensatory mechanisms such as those mentioned above; however, after reaching its maximum capacity for autoregulation, ICP increases exponentially. In pathological situations any minimal increase in intracranial volume leads to exaggerated increases in intracranial pressure. All this is explained by the compliance formula that also applies to the intracranial space (Figure 3).1

Figure 3 Pressure/volume curve1.
Compliance = ΔV/ΔP
Primary damage is that which occurs during the first hours of the injury, regardless of the cause (ischemia, hemorrhage, trauma, etc.); from the cellular point of view, structural and functional alterations develop, which can be reversible and irreversible, as well as diffuse or focal. Microscopically, lacerations and retractions of axons are observed, where axonal injury is the common denominator of diffuse cerebral damage; rupture of the cerebral vasculature can also be observed.1,3,10–12,15 Secondary damage refers to additional damage caused by new insults that aggravate or perpetuate the initial primary damage. Its causes may be intracranial or systemic. They can be observed at any moment of the patient's clinical evolution. When they appear, the first thing to do is to treat the primary lesion; however, their prevention, detection and early treatment is essential (Table 2).1
|
Systemic |
Intracranial |
|
Arterial hypotension |
Intracranial hypotension |
|
Hypoxemia |
Late cerebral hematoma |
|
Hypercapnia |
Cerebral edema |
|
Hypocapnia |
Cerebral hyperemia |
|
Fever |
Vasospasm |
|
Hyponatremia |
Seizures |
|
Hypoglycemia |
|
|
Hyperglycemia |
|
|
Severe anemia |
|
|
Acidosis |
|
|
Disseminated intravascular coagulation |
|
|
Systemic inflammatory response syndrome |
|
Table 2 Causes of secondary damage 16
It is also important to recognize the presence of cerebral edema, differentiating between vasogenic and cytotoxic cerebral edema. With respect to the former, it occurs when the BBB is disrupted, with subsequent accumulation of extracellular protein fluids, leading to the release of proinflammatory cytokines and the subsequent infiltration of inflammatory cells. Cytotoxic brain edema occurs in the face of dysfunction of ion channels and osmotic flow. With subsequent loss of membrane electrochemical gradients and depletion of ATP reserves.15
When talking about neuroprotective strategies, it is important to be clear that there are some counter-regulatory mechanisms against brain injury, which will become the goals to be met during our clinical assessment:12
- Core temperature below 37.5 in order to decrease disproportionate oxygen consumption.
- Serum sodium between 135-145, maintaining this electrolyte in normal ranges guarantees the adequate use of mitochondrial and neuronal energy, as well as the transmission of signals.
- Hemoglobin between 7-10 g/dl to ensure adequate oxygen transport, however, this has a limitation, it does not assure us how well or poorly the hemoglobin protein is related to oxygen.
- Serum glucose between 110 - 150 mg/dl, thus ensuring sufficient glucose for brain oxidation to provide energy for brain requirements.
- PaCo2 (partial pressure of carbon dioxide) between 35-40 mmHg which promotes neither deleterious vasodilatation nor vasoconstriction in the patient with intracranial hypertension.
- Normal oxygenation parameters (oxygen saturation SaO2 >92% and oxygen partial pressure PaO2 >90) which guarantee the necessary substrate to maintain minimal mitochondrial oxidation.
- Normovolemia that will reflect less passage to the BBB and less cerebral edema, in addition to the different hydroelectrolytic alterations.
Adhering to these strategies ensures that the minimal needs necessary to maintain brain homeostasis are met. All this at the bedside and recognizing that not all patients are equal responders.
Currently there are several ways to monitor and follow up the neuroprotective interventions carried out, being clear about what our goals are and what the information obtained from them will be useful for. Among the various diagnostic and therapeutic aids we have:12,14
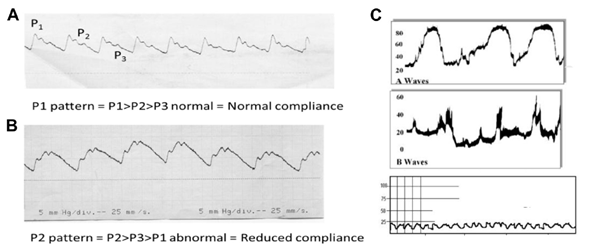
- ICP/CPP measurement catheter: by means of this invasive device we can determine the conduction pressure necessary to guarantee adequate cerebral perfusion, being relevant not only the value of this, but also the morphology of the previously mentioned curve (Figure 4).13

Figure 4 ICP waves recorded at 25 mm/sec. showing its 3 components (P1, P2, P3).13 A, Wave with normal morphology; B, Predominant P2 pattern [Reduced Compliance]; C, Waves of image A and B in patient with Endocranial Hypertension .
- Transcranial Doppler: allows us to measure blood velocities at the level of cerebral blood vessels (peak systolic, peak diastolic and mean cerebral blood velocities; as well as cerebral vascular resistances reflected as the pulsatility index), these are a surrogate of cerebral blood flow either local or regional.17 Among the different data that we can subtract from the Transcranial Doppler are:
0.5 cm = ICP > 20 mmHg
-Poor prognosis is considered any period < 10mmHg during the first 24h after brain injury or any period for more than 30 minutes. Greater probability of death with levels ≤ 6 mmHg.
- 15 mmHg: mild-moderate tissue hypoxia
- 10 mmHg: severe tissue hypoxia
- 5mmHg: critical tissue hypoxia.
Sjvo2 catheter - Measurement of venous gases from the jugular gulf: allows us to evaluate the relationship between cerebral blood flow and cerebral metabolic requirements. With these gases we can perform different calculations described in Table 3 & 4 and thus determine whether anaerobic metabolism prevails in the brain, in order to subsequently establish what type of hypoxia is related to the patient's clinical condition.19
|
Arterial oxygen content [CaO2] |
|
|
|
CaO2 = (1.34 × Hb × SaO2) + (0.003 × paO2) |
17-20 ml/dl |
|
Venous oxygen content [CvO2] |
|
|
|
CvO2 = (1.34 × Hb × SjvO2) + (0.003 × pjvO2) |
12-15ml/dl |
|
Arterio-venous O2 difference [D(a-v)O2] |
|
|
|
D(a-v)O2= CaO2 - CvO2 |
[D(a-v)O2] <4 ml O2/100mL greater intake than consumption (flow perfusion): hyperemia. FSC in excess in relation to requirements, decreased oxygen extraction. [D(a-v)O2] >8 ml O2/100mL consumption greater than input (ischemia): Hypoperfusion. FSC decreases in relation to requirements. Increased oxygen extraction |
|
Oxygen Extraction Cup [OER] |
|
|
|
OER = (CaO2 - CvO2)/CaO2 |
25-35% |
|
Arteriovenous glucose difference [AJVD glc] |
|
|
|
AJVD glc = arterial glc - jugular-venous glc |
0.2 - 0.8 mmol |
|
Lactate arteriovenous difference [AJVD lact] |
|
|
|
AJVD lac = arterial lac - jugular-venous lac |
-0.2 - 0.2 mmol |
|
Oxygen Glucose Index [OGI] |
|
|
|
OGI = avDO2/AJVD glc |
>6 aerobic metabolism, lactate <6 anaerobic metabolism |
|
lactate-glucose index [LGI] |
|
|
|
LGI = AJVD lact/AJVD glc |
LGI negative = lactate production; LGI positive = lactate uptake |
|
Lactate Oxygen Index [LOI] |
|
|
|
LOI = AJVD lact/ avDO2 |
LOI negative: lactate release (anaerobic) LOI Positive: lactate consumption (aerobiosis) Normal <0.03 >0.08 increase in lactate production = ischemia |
|
Delta CO2 |
|
|
|
AJVD pCO2 = paCO2 - pjvCO2 |
Normal 6, >9 anaerobic metabolism |
|
[AJVD pCO2] [AJVD pCO2 |
|
|
|
|
|
Table 3 Brain metabolism formulas16
Hb, hemoglobin; SaO2, Arterial oxygen saturation; paO2, arterial oxygen pressure; SjvO2, venous oxygen saturation; pjvO2, venous oxygen pressure
|
SvyO2 value - interpretation |
|
|
90 - 100% |
Very low metabolic activity, compatible with brain death, deep hypothermia or AVM |
|
75 - 90% |
Absolute or relative hyperemia, compatible with late head trauma, hypercapnia or MAC |
|
60 - 75% |
Normal value, does not exclude focal ischemia or infarction |
|
50 - 60% |
Increased O2 extraction, compatible with no ischemia or mild ischemia |
|
45 - 50% |
Moderate ischemia, should be associated with lactate determination |
|
< 45% |
Severe ischemia, compatible with anaerobic metabolism. Urgent treatment is needed |
Table 4 Interpretation of jugular gulf venous gas values18
Tissue hypoxia is a state in which the cell and tissue do not receive sufficient oxygen supply according to their needs or receive it in sufficient quantities, but do not use it. It is a state in which oxidative energy production and glycolytic energy production are insufficient, leading to lactic acidosis and cellular malfunction. Eight causes of tissue hypoxia have been described (Table 5).20–23
|
Hypoxia class |
PET profile |
Neuromonitoria profile |
|
Ischemic |
FSC decrease Decrease CMRO2 Increase OEF |
PTiO2 low Increased lactate/pyruvate ratio |
|
Disperfusion |
Normal FSC Normal OEF Decrease CMRO2 |
Normal PTiO2 Increased lactate/pyruvate ratio |
|
Uncoupling |
Normal FSC Decrease OEF Decrease CMRO2 |
Normal PTiO2 Increased lactate/pyruvate ratio |
|
Shunt |
Increase FSC Decrease/normal OEF Decreased/normal CMRO2 |
PTiO2 Normal Increased lactate/pyruvate ratio |
|
Low extraction ● Hypoxic ● Anemic ● High Affinity |
Increased/ Normal FSC Increase/ Normal OEF Decrease CMRO2 |
PTiO2 low Increased lactate/pyruvate ratio |
|
Hypermetabolic |
Increase FSC Increase OEF Normal CMRO2 |
PTiO2 low Increased lactate/pyruvate ratio |
Table 5 Types of tissue hypoxia -CMRO2 cerebral metabolic oxygen consumption Multimodal cerebral perfusion monitoring, use at the patient's bedside21
Ischemic hypoxia: It occurs when there is insufficient cerebral blood flow, which will be determined by cerebral perfusion pressure, so a decrease in this, as well as a vasoconstriction or obstruction of flow can cause. A decreased cardiac output will trigger systemic hypotension, it can also be secondary to peripheral vasodilatation.
Therapy: depends on the mechanism responsible for the reduction in FSC. One can optimize MAT with fluids or vasopressor/inotropic drugs, reduce ICP, correct hyperventilation, and treat vasospasm or vessel occlusion with endovascular therapy.
Extraction hypoxia: conditions that generate a low extraction tension are grouped together. The extraction tension is understood as the oxygen tension obtained after the extraction of a standard amount of oxygen per liter of blood. It indicates the degree of compensation between arterial oxygen pressure, effective hemoglobin concentration and mean saturation tension. Within this group are described:
Hypoxemic hypoxia due to low arterial pO2, abnormal oxygen exchange. It is associated with ventilation-perfusion mistmatch, atelectasis, pulmonary contusion, pneumonia, mechanical ventilation associated injury, ARDS.
Therapy: mechanical ventilation with protective parameters, increased FiO2, appropriate PEEP levels, recruitment maneuvers, infection management, respiratory therapy.
Anemic hypoxia with a low effective hemoglobin concentration.
Therapy: transfusion to maintain Hb above 7 g/dl, ideally 10 g/dl
High affinity hypoxia where there is a low mean saturation tension, which generates a shift of the hemoglobin dissociation curve to the left, this can happen due to hypothermia, alkalosis, hypocapnia (hyperventilation) and transfusion of long stored blood which may lack adequate levels of 2,3 DPG, and this deficiency increases the affinity of Hb for O2 (hypoxia due to high affinity).
Therapy: correction of the underlying disorder
Hypoxia due to extrapulmonary shunt: in cases of increased arteriovenous shunt secondary to fistulas or hyperdynamic syndromes such as severe sepsis.
Disperfusion hypoxia
In which there is an increase in the average diffusion distance
In the decrease of the endothelial diffusion area.
The therapy consists of reducing cerebral edema.
Histotoxic hypoxia when cytochrome is inhibited by toxic agents such as cyanide.
Uncoupling or cytotoxic hypoxia: uncoupling between O2 and ATP due to mitochondrial dysfunction caused by neurotoxicity triggered by trauma, repeated metabolic crises or sepsis.
Hypermetabolic hypoxia when energy metabolism is increased as in fever, crisis, paroxysmal sympathetic hyperactivity or sepsis.
Therapy: management of the cause, temperature control, antibiotics, adequate nutrition, sedoanalgesia.
Brain metabolism is very susceptible to hypoxia, so early evaluation of brain metabolism is essential. Within the intensive care unit, various methods are available to evaluate the metabolic state of the brain in pathological situations that allow measures to be taken to reduce brain damage. The different neuromonitoring methods must be known in order to be able to interpret them appropriately and make timely decisions.
None.
The authors declare that there are no conflicts of interest.

©2024 Mendoza, et al. This is an open access article distributed under the terms of the, which permits unrestricted use, distribution, and build upon your work non-commercially.