
Research Article Volume 2 Issue 1
Wall properties of peristaltic MHD nanofluid flow through porous channel
Nabil T M El dabe, G M Moatimid, Mohamed A Hassan, Wessam A Godh
Regret for the inconvenience: we are taking measures to prevent fraudulent form submissions by extractors and page crawlers. Please type the correct Captcha word to see email ID.

Department of Mathematics, Faculty of Education, Ain Shams University, Egypt
Correspondence: Wessam A Godh, Department of Mathematics, Faculty of Education, Ain Shams University, Heliopolis, Cairo, Egypt, Tel +00 966562098390
Received: August 24, 2017 | Published: February 28, 2018
Citation: El-dabe NTM, Moatimid GM, Hassan MA et al. Wall properties of peristaltic MHD Nanofluid flow through porous channel. Fluid Mech Res Int. 2018;2(1): 00019. DOI: 10.15406/fmrij.2018.02.00019
Download PDF
Abstract
In this article, the magnetohydrodynamic (MHD) peristaltic transport of a nanofluid through porous medium is investigated. The effects of the slip conditions together with the wall properties are taken into account. The traveling wave technique is used to obtain the stream function distribution. Also, the homotopy perturbation method (HPM) is utilized to present the other distributions like; temperature and concentration. Finally, several diagrams are plotted to discuss and interpret the effects of various physical parameters of the considered problem. One of the important results of this paper is the behavior of the nanoparticle concentration with different values of Reynolds number, slip parameter, elasticity parameters, thermophoresis parameter, Hartman number and the Brownian motion parameter.
Keywords: nanofluid, Peristalsis, slip conditions, wall properties, porous medium, Homotopy Perturbation Method (HPM), traveling wave solution.
Introduction
In many physiological situations, peristalsis is used by the body to propel or mix the contents of a tube, for example, in a ureter, gastrointestinal tract, the bile duct and the other glandular ducts. One of the importances of using peristaltic pumping is avoiding use any internal moving parts such as pistons, in the pumping process. Specifically, in the fluid mechanics, the peristaltic motion is the dynamic interaction of flexible boundary with the fluid. Latham1 and Shapiro et al.2 introduced a large amount of information on the peristalsis via theoretical and experimental approaches.
The latest studies in the peristaltic motion can be seen through several articles. Sankad & Patil3 studied the peristaltic flow of Herschel Bulkley fluid in a non-uniform channel with porous lining. Hayat et al.4 studied the effects of homogeneous-heterogeneous reactions with convective boundary conditions on peristaltic transport of third order fluid in a channel. Hayat et al.5 studied the mixed convective peristaltic flow with the effects of Hall current. Kavitha et al.6 analyzed the peristaltic transport of a Jeffrey fluid. Hayat et al.7 studied the effects of convective heat and mass conditions in the peristaltic transport.
Due to vast applications of nanofluids with a high rate of heat transfer in engineering and industrial processes, they have gained the attention of researchers. These kinds of fluids occur in liquids which are containing suspensions of nanoparticles. These particles contain carbides, metals, oxides, carbon nanotubes etc. Initially, the term nanofluid presented by Choi8 as a description of a new approach to enhance the energy performance. Lee et al.9 explained that by an inclusion of nanoparticles in base fluids the nanofluids are devised as an advanced class of fluids such as propylene glycol, ethylene glycol, water, oils, silk fibroin, lubricants, and biofluids. Some of the important applications of nanofluids are in heat transfer, pharmaceutical processes, nuclear reactor coolant, space technology and nuclear reactor coolant. Thus, under different assumptions, the works on nanofluids have been progressed by many researchers.10−12
The slip parameter, according to Navier13, is the proportionality constant between the difference of the velocities of fluid and of the boundary and the shear stress at that boundary. Fluids exhibiting such behavior are related to many applications such as the polishing of artificial heart valves and internal cavities. Recently effects of slip conditions have been investigated by Aly & Ebaid14, and Hayat et al..15 The flow in a compliant channel has many physiological applications. Such as blood flow in arteries and veins, urine flow in the urethras and air flow in the lungs. Hina16 studied peristaltic transport of Eyring–Powell fluid with heat/mass transfer, wall properties and slip conditions. There are several investigations to study the effect of the magnetohydrodynamic (MHD) peristaltic flow of a fluid is of interest in connection with certain problems of the movement of conductive physiological fluids e.g. the blood and blood pump machines. Many researchers have studied MHD peristaltic flow by using different fluids in channel/tubes. Representative attempts in this direction can be mentioned by Refs.17,18
The purpose of the present work is to study the effects of slip conditions, wall properties and porous medium on a magnetohydrodynamic (MHD) peristaltic transport of a nanofluid. The velocity, streamlines, temperature, and nanoparticles concentration distributions were solved through two methods of solutions. The equation of streamlines is solved by using the traveling wave solution method while the equations of the temperature and nanoparticles concentration are solved by using homotopy perturbation method. The results of the streamlines and velocity are compared with the previous results obtained by Srinivas and Gayathri19 graphically. The structure of the present work is as follows: In section 2 we formulate the problem. In section 3 we present steps of solutions by using two methods of solution (3.1 traveling wave solutions and 3.2 homotopy perturbation method). Our discussion of results was presented in Section 4. Finally, in Section 5, we give concluding remarks for this study.
Formulation of the problem
We consider a two-dimensional flexible porous channel of a uniform thickness.
The walls of the channel are taken as a stretched membrane, on which the traveling sinusoidal wave of moderate amplitude is imposed. The following assumptions are made in this investigation:
- A magnetic field of strength B0 is considered to be applied parallel to the y-axis.
- The fluid is assumed to be of Newtonian, viscous, incompressible and nanofluid.
- The motion is assumed to be axisymmetric.
- We assume that the characteristic properties of this two-dimensional flow depend on the coordinates(x,y), where the flow direction is taken as the x-axis and the y-axis is vertical.
- The motion is assumed to be horizontal and the gravity of earth is neglected to facilitate the solution.
- As shown in Figure 1 at the steady state
, while in the unsteady state
and the channel wall geometry is represented as:
(1)
Where
Under the previous assumptions, the basic equations governing the motion for the problem are:
The incompressibility conditions yields
(2)
The conversation of momentum gives
(3)
And
(4)
The conversation of energy results
(5)
The concentration equation presents
(6)
In according with the axisymmetric motion of the flexible wall, the theory of stretched membrane with viscous damping force is considered. Mitra & Prasad20 suggested the dynamic boundary conditions
at
, where
, and
is an operator, which is used to represent the motion of stretched membrane with viscosity damping forces such that
is the elastic tension in the membrane,
is the mass per unit area,
is the coefficient of viscous damping forces and
is the pressure on the outside surface of the wall due to tension in the muscles. This tension may be obtained through the constitutive relation of the muscles when the displacements are known. For simplicity, we may ignore the parameter
.
Using Eq. (3), we get the compliant wall condition as:
(7)
To complete the considered boundary-value problem, we must present the appropriate boundary conditions:
at
and
, at
. Also we have slip conditions at the walls are defined as:
(8)
In the above equations and conditions u and v are the velocity components along the x and y directions respectively. d is the mean half width of the channel, a is the amplitude,
is the wavelength,
is the phase speed of the wave,
is the dimensional non-uniformity of channel,
are the density of the fluid and the particle respectively,
are the volumetric volume expansion of the fluid and the particle respectively, p is the pressure,
is the coefficient of viscosity of the fluid,
is the fluid electrical conductivity, B0 is the applied magnetic field, K is the permeability of the porous medium, k is the thermal conductivity of the fluid, T is the temperature, DB is the Brownian diffusion coefficient, DT is the thermophoretic diffusion coefficient, the heat transfer and nanoparticle processes are maintained by considering temperatures T0,T1and nanoparticle phenomena
to the walls of the channel at
, respectively, and h is the dimensional slip parameter.
Introducing a stream function
and by using the following non-dimensional quantities:
(9)
Where
are geometric parameters, R is the Reynolds number, M is the Hartman number, E1,E2,E3 are the non-dimensional elasticity parameters, Pr is the Prandtl number, Q is non-uniformity parameter,
is the Knudsen number (slip parameter), Sc Schmidt number, Nb is the Brownian motion parameter, Nt is the thermophoresis parameter and K is the permeability parameter.

Figure 1 Geometry of the problem.
Now, in analogy with the definition of the stream function
together with the dimensionless quantities as given in (9), the governing equations of motion given:
(10)
(11)
(12)
(13)
In addition, the related boundary conditions yield:
(14)
(15)
where
. More, it is assumed that the zero value of the streamline at the line y=0,19
(16)
(17)
The eliminating of pressure between equations (10), (11) and evaluating (15) yield the following equations:
(18)
(19)
Now, the previous system of equations (12-19) will be solved in the next sections.
Method of solution
Traveling wave solutions
The main advantage of this method is that we can construct exact solutions of higher order nonlinear evolution equations more effectively in comparison with other methods21. To obtain the solution of the streamlines in Eq. (18) we seek the traveling wave solution in the form
(20)
Where
is the wave speed.
Then
(21)
From Eq. (20), (21) in Eq. (11) we obtain an ordinary differential equation as follows:
(22)
Choose
and substituting into Eq. (22) we get
(23)
which have the solution
(24)
Where
(25)
Integrating Eq. (24) with respect to
since
then we get
Substituting from the previous Eq. into Eq. (20) we get
(26)
By using the boundary conditions (14), (16) and (19) to find the values of M1,M2,M3,M4, we finally get:
(27)
As a special case by using the long wavelength approximation and neglecting the wave number along with low-Reynolds number, i.e.
one can find that
(28)
Where, the functions
are defined in the Appendix.
In order to assess the accuracy of the solution of the streamline and velocity distribution in our problem, the special case (28) was compared with the previous results of Srinivas and Gayathri19 graphically. There is a good agreement between them, as shown in Figures 2& 3 .
Homotopy Perturbation method
To find the solution of temperature and nanoparticles concentration in Eqs. (12) and (13), we use the homotopy perturbation method. This technique is a combination of the perturbation method and the homotopy method which eliminates the drawbacks of the traditional perturbation methods while keeping all their advantages. On the basis of the homotopy perturbation method22−24 we can write (12) and (13) as follows:
(29)
(30)
Here,
and
give the linear operator chosen as
. The initial approximations
and
can be defined as
(31)
Let us define
(32)
(33)
Incorporating Eqs. (32), (33) into Eqs. (29), (30) (with deriving
from Eq. (27) with respect to x and y) and then equating like powers of q, one observes the system of equations along with the relative boundary conditions. According to the scheme of the HPM, we have the final solutions for temperature and nanoparticles concentration when
as.
(34)
(35)
Where, all functions
and
are defined in the Appendix. In calculating and plotting the functions we used the Mathematical program.
Results and discussion
This section elucidates the behavior of velocity profile, nanoparticle concentration, temperature profile and streamlines configuration on different involved parameters and also it contains a comparison between the present results of the velocity and streamlines and the previous results of Srinivas and Gayathri19 which is considered as a special case of our work by using the long wavelength approximation and neglecting the wave number along with low-Reynolds number. The results are compared in Table 1 and graphically in Figure 2 and Figure 3. There is an excellent match between the two solutions as shown in the table and figures.
y |
Srinivas and Gayathri19 |
Our article |
|
|
-1 |
4.9505 |
4.9288 |
-0.8 |
6.7301 |
6.7005 |
-0.6 |
7.6817 |
7.6479 |
-0.4 |
8.1785 |
8.1426 |
-0.2 |
8.4154 |
8.3784 |
0 |
8.4852 |
8.4479 |
0.2 |
8.4154 |
8.3784 |
0.4 |
8.1785 |
8.1426 |
0.6 |
7.6817 |
7.6479 |
0.8 |
6.7301 |
6.7005 |
1 |
4.9505 |
4.9288 |
Table 1 Comparison between the present results of the velocity
for various values of yand the previous results of Srinivas and Gayathri19 which is considered as a special case of our work at
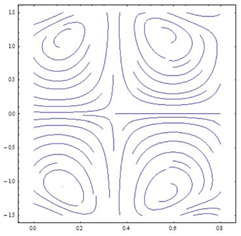
Figure 2 Plots of Streamline
distribution
a) In the special case in our problem.
b) In previous results of S Srinivas and R Gayathri27 at
R=0;
=0; k= 0.05;
=0.2;
=0.1; E1=0.6; E2=0.4; E3=0.1; Pr=0.01; Nb=0.5; Nt =0.6.
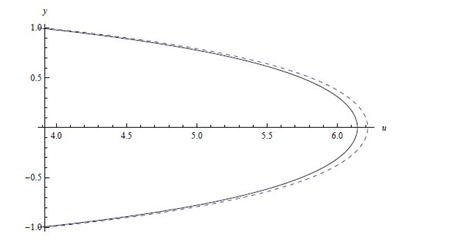
Figure 3 Velocity u distributions
ــــــــــــــ In the special case in our problem,
−−−−−−−−−−−−−− In previous results of S Srinivas and R Gayathri27 at
R=0;
=0; k= 0.5;
=0.2;
=0.3; E1=0.5; E2=0.5; E3=0.1; Pr=0.01; Nb=0.5; Nt =0.6.
The velocity profile
Figure 4 has been plotted to see the impact of the Slip parameter
on velocity profile. As the resistance is reduced due to the deviation of fluid in a channel which enhances the velocity profile (Figure 4). It is noted from Figure 5 that the velocity profiles is strictly decreasing for increasing values of the porous parameter. It is illustrated that the presence of porous medium is to enhance increase the resistance to the flow. Which retards the fluid velocity and this associated with a decrease in the momentum boundary layer thickness. Magnetic field applied in a transverse direction acts as a retarding force for the fluid flow and thus the velocity profile decreases for increasing values of Hartman number M as shown in Figure 6.
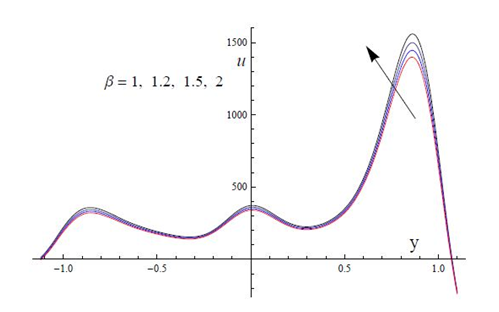
Figure 4 Plots of velocity u versus y for the effects of
at
R=0.1;
=0.05; M=4; k=0.2;
=0.2;
=0.1; Q=0.1; E1=0.6; E2=0.4; E3=0.1
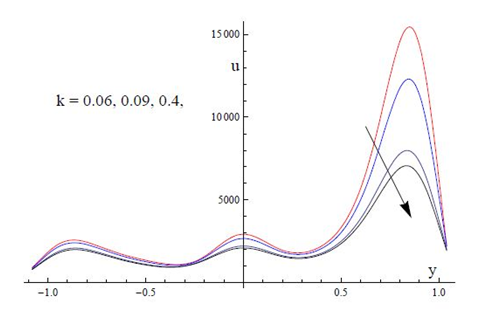
Figure 5 Plots of velocity u versus y for the effects of K at
R=0.1;
=0.05; M=4;
=0.2;
=0.1; Q=0.1;
=10; E1=0.6; E2=0.4; E3=0.1
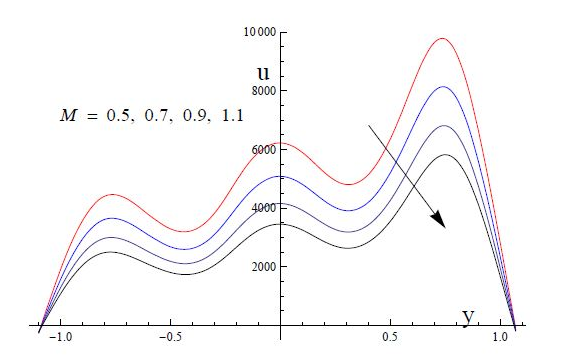
Figure 6 Plots of velocity u versus y for the effects of M at
R=0.1;
=0.05; k=0.2;
=0.2;
=0.1; Q= 0.1;
=0.1; E1= 0.6; E2= 0.4; E3= 0.1
The nanoparticle concentration
The effect of Hartman number M on nanoparticle concentration is presented in Figure 7. The reduction in the nanoparticle concentration
is noticed is response to growing values of the Hartman number M. Because the large values of the Hartman number M support the magnetic field strength which appears to be retarding force for the flow.

Figure 7 Plots of nanoparticle concentration versus y for the effects of M at
R=0.5;
=0.5; k=0.5;
=0.2;
=0.1; Q=0.1;
=0.2; E1=0.6; E2=0.4; E3=0.1; Pr=0.01; Nb=0.6; Nt=0.8; Sc=0.6
Figure 8 shows the effect of the slip parameter
on nanoparticle concentration. The results show that nanoparticle concentration reduces in a particular domain with enhancing the Slip parameter
. After that domain, the behavior of the nanoparticle concentration
is different, where it increases with increasing the Slip parameter
.
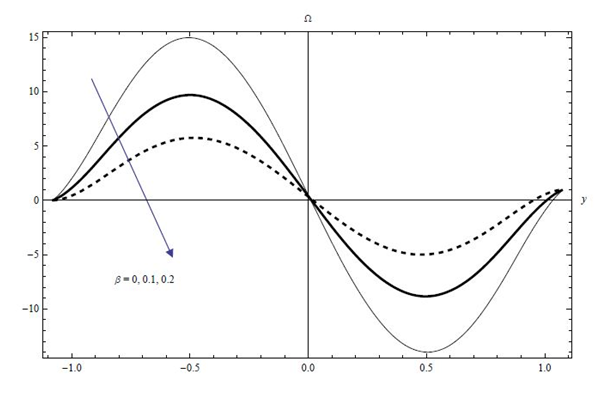
Figure 8 Plots of nanoparticle concentration versus y for the effects of
at
R=0.5;
=0.5; M=4; k=0.5;
=0.2;
=0.1; Q=0.1; E1=0.6; E2=0.4; E3=0.1; Pr=0.01; Nb=0.6; Nt=0.8; Sc=0.6
The influence of the permeability parameter k on the nanoparticle concentration is analyzed in Figure 9. It is clear from this figures that enhance of the permeability parameter k from 1 to 1000 (which taken as
) leads to an increase in nanoparticle concentration.

Figure 9 Plots of nanoparticle concentration versus y for the effects of k at
R=0.5;
=0.5; M=4;
=0.2;
=0.1; Q=0.1;
=0.2; E1=0.6; E2=0.4; E3=0.1; Pr=0.01; Nb=0.6; Nt=0.8; Sc=0.6
We next move to analyze the effects of the Brownian motion parameter Nb and the thermophoresis parameter Nt on the nanoparticle concentration through the Figure 10 and Figure 11 respectively. It is demonstrated that by increasing of the thermophoresis parameter Nt, the volume fraction of nanoparticle increases. On the other hand, an opposite trend has been observed as the Brownian motion parameter Nb varies. This is because, the random motion of nanoparticles getting increased with an increase in Brownian motion parameter, which in turn an enhancement of fluid temperature and reduction of the nanoparticle diffusion.

Figure 10 Plots of nanoparticle concentration versus y for the effects of Nb at
R= 0.5;
=0.5; M=4; k=0.5;
=0.2;
=0.1; Q=0.1;
=0.1; E1=0.6; E2=0.4; E3=0.1; Pr=0.01; Nt=0.8; Sc=0.6
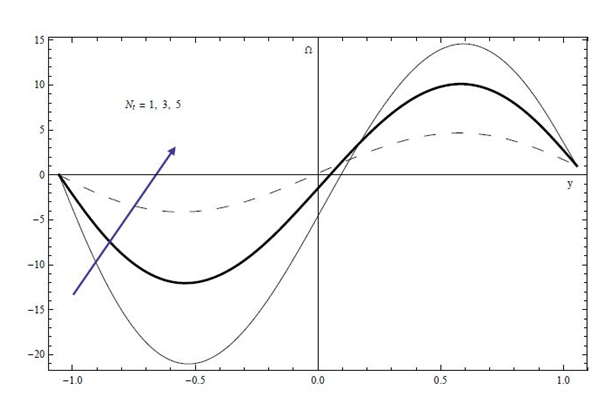
Figure 11 Plots of nanoparticle concentration versus y for the effects of Nt at
R=0.5;
=0.5; M=4; k=0.5;
=0.2;
=0.1; Q=0.1;
=0.1; E1=0.6; E2=0.4; E3=0.1; Pr=0.01; Nb=0.1; Sc=0.6
Figure 12 represents the impact of Reynolds number R on nanoparticle concentration. It is observed from this figure that the nanoparticle concentration increases when Reynolds number R is increased.

Figure 12 Plots of nanoparticle concentration versus y for the effects of R at
=0.5; M=4; k=0.5;
=0.2;
=0.1; Q=0.1;
=0.1; E1=0.6; E2=0.4; E3=0.1; Pr=0.01; Nb=0.6; Nt=0.8; Sc=0.6
Figures 13−15 describe the effects of variation for non-dimensional elasticity parameters E1, E2 and E3 on nanoparticle concentration. The results reveal that elasticity of walls E1, E2 and E3 enhance the nanoparticle concentration.

Figure 13 Plots of nanoparticle concentration versus y for the effects of E1 at
R=0.5;
=0.5; M=4; k=0.5;
=0.2;
=0.1; Q=0.1;
=0.1; E1=0.1; E3=0.1; Pr=0.01; Nb=0.6; Nt=0.8; Sc=0.6

Figure 14 Plots of nanoparticle concentration versus y for the effects of E2 at
R=0.5;
=0.5; M=4; k=0.5;
=0.2;
=0.1; Q=0.1;
=0.1; E1=0.4; E3=0.1; Pr=0.01; Nb=0.6; Nt=0.8; Sc=0.6
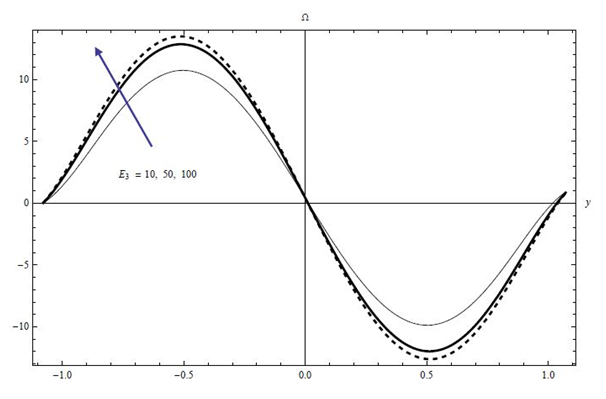
Figure 15 Plots of nanoparticle concentration versus y for the effects of E3 at
R=0.5;
=0.5; M=4; k=0.5;
=0.2;
=0.1; Q=0.1;
=0.1; E1=0.4; E2=0.1; Pr=0.01; Nb=0.6; Nt=0.8; Sc=0.6
The temperature profile
Figure 16 shows that the larger values of the Hartman number M produce strong magnetic field that takes out the fluid heat to generate current and so magnetic field tends to act like a retarding force which causes reduction in temperature.

Figure 16 Plots of temperature profile versus y for the effects of M at
R=0.5;
=0.5; k=0.5;
=0.2;
=0.1; Q=0.1;
=0.1; E1=0.6; E2=0.4; E3=0.1; Pr=0.01; Nb=0.6; Nt=0.8; Sc=0.05
Figure 17 shows the effect of the slip parameter
on nanoparticle concentration. The results show that decreasing in temperature profile presences in a specific domain with increasing the Slip parameter
. After that domain, the relationship is reflected with the Slip parameter
.

Figure 17 Plots of temperature profile versus y for the effects of
at
R=0.5;
=0.5; M=20; k=0.05;
=0.2;
=0.1; Q=0.1; E1=0.6; E2=0.4; E3=0.1; Pr=0.01; Nb=0.5; Nt=0.8; Sc=0.05
The influence of the permeability parameter k on the temperature profile is analyzed in Figure 18. It is clear from this figure that enhances of the permeability parameter k from 5×10⁻⁸ to 1000 in (which taken as
) leads to an increase in temperature profiles. This means that when the holes of the porous medium are very large the loss of the temperature from the fluid to the porous medium by conduction reduces and hence the temperature of the fluid increases.
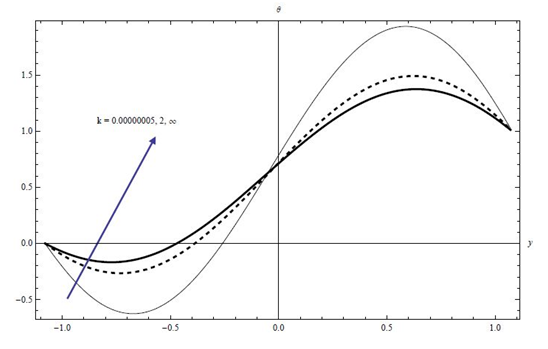
Figure 18 Plots of temperature profile versus y for the effects of k at
R=0.5;
=0.5; M=20; k=0.04;
=0.2;
=0.1; Q=0.1;
=0.1; E1=0.6; E2=0.4; E3=0.1; Pr=0.01; Nb=0.5; Nt=0.8; Sc=0.05
We next move to analyze the effects of the Brownian motion parameter Nb and the thermophoresis parameter Nt on the temperature profile through the Figures 19−20 respectively. It is demonstrated that the temperature of the fluid increased with an increase in the Brownian motion parameter Nb and the thermophoresis parameter Nt. This is because, the random motion of nanoparticles getting increased with an increase in Brownian motion parameter, which in turn an enhancement of fluid temperature.
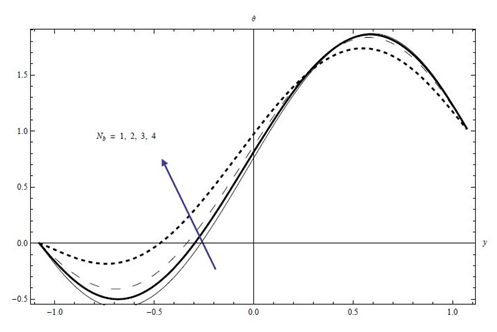
Figure 19 Plots of temperature profile versus y for the effects of Nb at
R=0.5;
=0.5; M=4; k=0.05;
=0.2;
=0.1; Q=0.1;
=0.1; E1=0.6; E2=0.4; E3=0.1; Pr=0.01; Nt=0.8; Sc=0.05
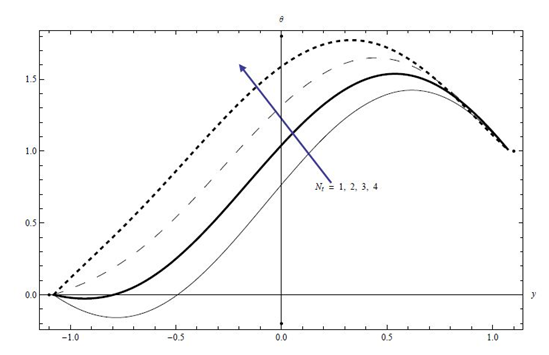
Figure 20 Plots of temperature profile versus y for the effects of Nt
R=0.5;
=0.5; M=20; k=0.05;
=0.2;
=0.1; Q=0.1;
=0.1; E1=0.6; E2=0.4; E3=0.1; Pr=0.01; Nb=0.5; Sc=0.05
Figure 21 represents the impact of Reynolds number R on temperature profile. It is observed from this figure that the temperature profile increases when Reynolds number R is increased.
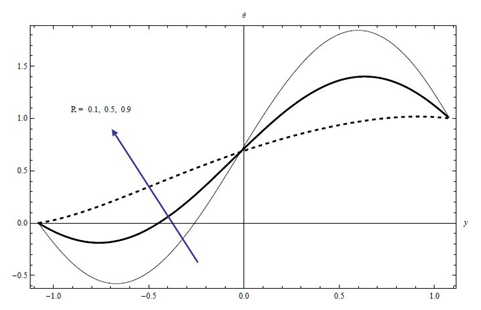
Figure 21 Plots of temperature profile versus y for the effects of R at
=0.5; M=20; k=0.05;
=0.2;
=0.1; Q=0.1;
=0.1; E1=0.6; E2=0.4; E3=0.1; Pr=0.01; Nb=0.5; Nt=0.8; Sc=0.05
Figures 22−24 describe the influence of non-dimensional elasticity parameters E1, E2 and E3 on temperature profile. It is observed that temperature is the increasing functions of E1, and E2 while it decreases for E3 due to damping effect of the peristaltic walls.

Figure 22 Plots of temperature profile versus y for the effects of E1 at
R=0.5;
=0.5; M=20; k=0.05;
=0.2;
=0.1; Q=0.1;
=0.1; E2=0.1; E3=0.1; Pr=0.01; Nb=0.5; Nt=0.8; Sc=0.05

Figure 23 Plots of temperature profile versus y for the effects of E2 at
R=0.5;
=0.5; M=20; k=0.05;
=0.2;
=0.1; Q=0.1;
=0.1; E1=0.4; E3=0.1; Pr=0.01; Nb=0.5; Nt=0.8; Sc=0.05
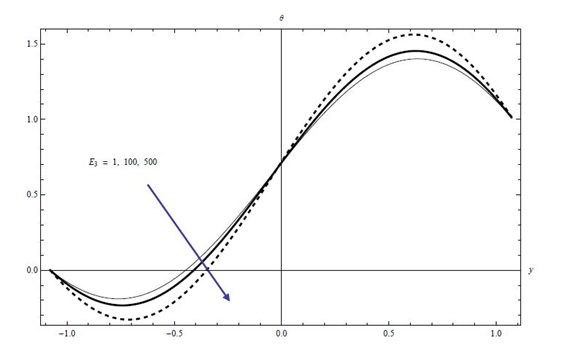
Figure 24 Plots of temperature profile versus y for the effects of E3 at
R=0.5;
=0.5; M=20; k=0.05;
=0.2;
=0.1; Q=0.1;
=0.1; E1=0.4; E2=0.1; Pr=0.01; Nb=0.5; Nt=0.8; Sc=0.05
Streamlines configuration
The behavior of the trapping with the permeability parameter k is explained in Figure 25. It shows that the volume of the trapped bolus increases with increasing the permeability parameter k and more trapped bolus appears with increasing the permeability parameter k.
The effect of slip parameter
on the trapping is illustrated in Figure 26. We observe that streamlines closed loops creating a cellular flow pattern in the channel and more trapped bolus appears with increasing slip parameter
.
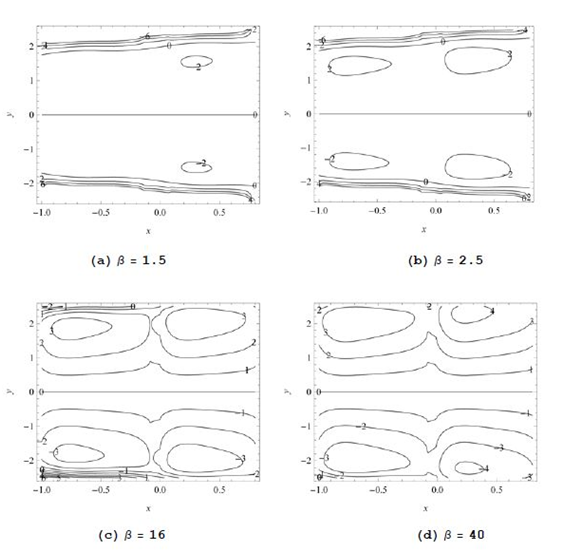
Figure 26 (A−D) Plots of Streamline
distribution for the effects of
at
R=5;
=0.5; M=4; k=0.5;
=0.2;
=0.04; Q=0.2; E1=0.6; E2=0.4; E3=0.1
Figure 27 highlights of the streamline patterns and trapping for different values of the Hartman number M. It is observed that the volume of the bolus decreases with increase of the Hartman number M and slowly disappears for the large value of the Hartman number M, where the fluid moves as a bulk.

Figure 27 (A−D) Plots of Streamline
distribution for the effects of M at
R=5;
=0.5; k=0.05;
=0.2;
=0.1; Q=0.1;
=0.3; E1=0.6; E2=0.4; E3=0.1
Conclusion
The main results of our study can be epitomized in the following points:
- The velocity u is the increasing function of the slip parameter
and the non-dimensional elasticity parameters E1, and E2 while it decreases for the Hartman number M, the permeability of the porous medium k and non-dimensional elasticity parameters E3.
- The temperature
is the increasing function of the non-dimensional elasticity parameters E1, E2 the porous medium k, the Reynolds number R, the Brownian motion parameter Nb and the thermophoresis parameter Nt while it decreases for the slip parameter
, the Hartman number M, and non-dimensional elasticity parameters E3.
- The nanoparticle concentration is the increasing function of the permeability of the porous medium k, the thermophoresis parameter Nt, the Reynolds number R and the non-dimensional elasticity parameters E1, E2, E3 while it decreases for the slip parameter
, the Hartman number M, and the Brownian motion parameter N_b.
- The value of trapped bolus is increases with increasing of the slip parameter
and the permeability of the porous medium k while it decreases with increasing of the Hartman number M.
Finally, the comparison was made between the present results of the velocity and streamlines and the previous results of Srinivas and Gayathri19 which is considered as a special case of our work and the results were compared graphically and the graphical comparisons showed an excellent compatible between the curves.
Acknowledgements
Conflict of interest
Authors declare there is no conflict of interest in publishing the article.
Nomenclature
Nomenclature |
a |
Amplitude. |
pr |
Prandtl number. |
B0 |
Magnetic field. |
|
Dimensional and non-dimensional non-uniformity of channel respectively. |
C |
Nanoparticle concentration. |
R |
Reynolds number. |
Cv |
Coefficient of viscous damping forces. |
Sc |
Schmidt number. |
cf |
Volumetric volume expansion of the fluid. |
T |
Temperature. |
cp |
Volumetric volume expansion of the particle. |
t |
Time. |
C* |
Phase speed. |
u,v |
Components of velocity along x, y directions. |
d |
Mean half width of the channel. |
|
Knudsen number (Slip parameter). |
DB |
Brownian diffusion coefficient. |
|
Density of the fluid and the particle respectively. |
DT |
Thermophoretic diffusion coefficient. |
|
Geometric parameters. |
E1, E2, E3 |
Non-dimensional elasticity parameters. |
|
Wave length. |
K |
Permeability of the porous medium. |
|
Wave speed. |
k |
Thermal conductivity of the fluid. |
|
Coefficient of viscosity of the fluid. |
M |
Hartman number. |
|
Kinematic viscosity. |
|
Mass per unit area. |
|
Dimensionless temperature. |
Nb |
Brownian motion parameter. |
|
Fluid electrical conductivity. |
Nt |
Thermophoresis parameter. |
|
Dimensionless nanoparticle concentration. |
p |
Pressure. |
|
Knudsen number (Slip parameter). |
p0 |
Pressure on the outside surface of the wall due to the tension in the muscles. |
|
|
References
- Latham LW. Fluid motion in peristaltic pumps. MS. thesis, Dept. of Mechanical Engineering, MIT, Cambridge, UK; 1996.
- Shapiro AH, Jaffrin MY, Weinberg SL. Peristaltic pumping with long wavelengths at low Reynolds number. J Fluid Mech. 1969;37(4):799−825.
- Sankad GC, Patil AB. Peristaltic flow of Herschel Bulkley fluid in a nonuniform channel with porous lining. Pro Eng. 2015;127:686−693.
- Hayat T, Bibi A, Yasmin H, et al. Simultaneous effects of Hall current and homogeneous/heterogeneous reactions on peristalsis. J Taiwan Inst Chem Eng. 2016;58:28−38.
- Hayat T, Zahir H, Tanveer A, et al. Influences of Hall current and chemical reaction in mixed convective peristaltic flow of Prandtl fluid. Journal of Magnetism and Magnetic Materials. 2016;407:321−327.
- Kavitha A, Reddy RH, Saravana R, et al. Peristaltic transport of a Jeffrey fluid in contact with a Newtonian fluid in an inclined channel. Ain Shams Eng J. 2015;8(4):683−687.
- Hayat T, Quratulain M, Rafiq, et al. Soret and Dufour effects on peristaltic transport in curved channel with radial magnetic field and convective conditions. Journal of Magnetism and Magnetic Materials. 2016;405:358−369.
- Choi US, Eastman JA. Enhancing thermal conductivity of nanofluids with nanoparticles. ASME, International mechanical engineering congress and exhibition, San Francisco, USA, 1995; 8p.
- Choi SUS, Lee S, Li S, et al. Measuring Thermal Conductivity of Fluids Containing Oxide Nanoparticles. Journal of Heat Transfer. 1999;121(2):280−289.
- Rahman SU, Ellahi R, Nadeem S, et al. Simultaneous effects of nanoparticles and slip on Jeffrey fluid through tapered artery with mild stenosis. J Mol Liq. 2016;218:484−493.
- Akram S. Nanofluid effects on peristaltic transport of a fourth grade fluid in the occurrence of inclined magnetic field. Scientia Iranica Transaction F Nanotechnology. 2016;23(3):1502−1516.
- Ellahi R, Hassan M, Zeeshan A. Shape effects of nanosize particles in Cu−H2O nanofluid on entropy generation. Int J Heat Mass Transfer. 2015;81:449−456.
- Navier CLMH. Sur les lois de lequilibre et dumouvement des corps solides elastiques. Bulletin des Sciences par la Societe Philomatique de Paris. 1823;177−181.
- Aly EH, Ebaid A. Effect of the velocity second slip boundary condition on the peristaltic flow of nanofluids in an asymmetric channel: exact solution. Abstract and Applied Analysis. 2014;191876:1−11.
- Hayat T, Nisar Z, Ahmad B, et al. Simultaneous effects of slip and wall properties on MHD peristaltic motion of nanofluid with Joule heating. Journal of Magnetism and Magnetic Materials. 2015;395:48−58.
- Hina S. MHD peristaltic transport of Eyring−Powell fluid with heat/mass transfer, wall properties and slip conditions. Journal of Magnetism and Magnetic Materials. 2016;404:148−158.
- Hayat T, Quratulain M, Alsaadi Rafiq, et al. Soret and Dufour effects on peristaltic transport in curved channel with radial magnetic field and convective conditions. Journal of Magnetism and Magnetic Materials. 2016;405:358−369.
- Ellahi R, Hussain F. Simultaneous effects of MHD and partial slip on peristaltic flow of Jeffrey fluid in a rectangular duct. Journal of Magnetism and Magnetic Materials. 2015;393:284−292.
- Srinivas S, Gayathri R, Kothandapani M. The influence of slip conditions, wall properties and heat transfer on MHD peristaltic transport. Computer Physics Communications. 2009;180(11):2115−2122.
- Mittra TK, Prasad SN. On the influence of wall properties and Poiseuille flow in peristalsis. J Biomech. 1973;6(6):681−693.
- Lee J, Sakthivel R. Exact travelling wave solutions for some important nonlinear physical models. Pramana journal of physics. 2013;80(5):757−769.
- Ji Huan He. Approximate analytical solution for seepage flow with fractional derivatives in porous media. Computer Methods in Applied Mechanics and Engineering. 1998;167(1−2):57−68.
- Ji Huan He. Homotopy perturbation technique. Computer Methods in Applied Mechanics and Engineering. 1999;178:257−262.
- Ji Huan He. Application of homotopy perturbation method to nonlinear wave equations. Chaos Solitons and Fractals. 2005;26(3):695−700.

©2018 El-dabe, et al. This is an open access article distributed under the terms of the,
which
permits unrestricted use, distribution, and build upon your work non-commercially.


